Statistiques de base
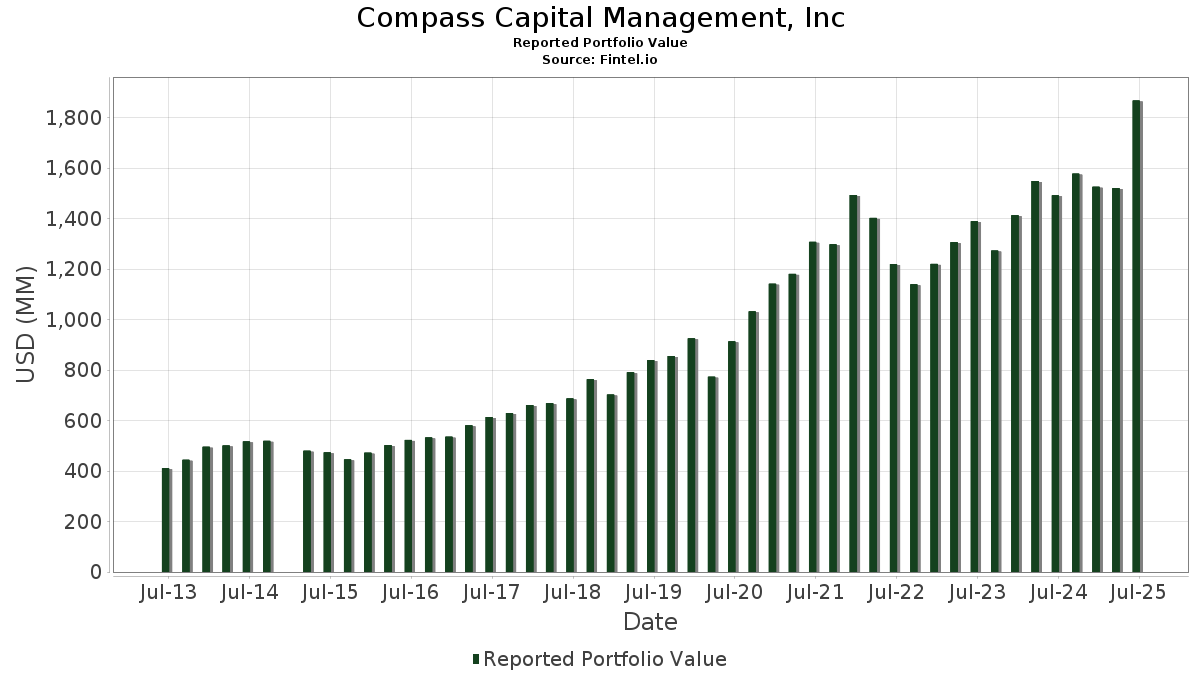
| Valeur du portefeuille | $ 1 867 176 486 |
| Positions actuelles | 63 |
Dernières positions, performances, ASG (à partir des dépôts 13F, 13D)
Compass Capital Management, Inc a déclaré un total de 63 positions dans ses derniers dépôts auprès de la SEC. La valeur la plus récente du portefeuille est calculée à 1 867 176 486 USD. Les actifs sous gestion réels (ASG) sont cette valeur plus les liquidités (qui ne sont pas divulguées). Les principales positions de Compass Capital Management, Inc sont Microsoft Corporation (US:MSFT) , Amphenol Corporation (US:APH) , Fiserv, Inc. (US:FI) , Visa Inc. (US:V) , and Intercontinental Exchange, Inc. (US:ICE) . Les nouvelles positions de Compass Capital Management, Inc incluent Palo Alto Networks, Inc. (US:PANW) , ServiceNow, Inc. (US:NOW) , Royal Caribbean Cruises Ltd. (US:RCL) , Marriott International, Inc. (US:MAR) , and Mastercard Incorporated (US:MA) .
Meilleures augmentations ce trimestre
Nous utilisons la variation de l'allocation du portefeuille car il s'agit de l'indicateur le plus significatif. Les changements peuvent être dus à des transactions ou à des variations de prix des actions.
| Titre | Actions (en millions) |
Valeur ($ en millions) |
% du portefeuille | ΔPortefeuille % |
|---|---|---|---|---|
| 0,10 | 20,74 | 1,1108 | 1,1108 | |
| 0,02 | 18,94 | 1,0143 | 1,0143 | |
| 0,06 | 18,85 | 1,0097 | 1,0097 | |
| 0,19 | 94,12 | 5,0410 | 0,9796 | |
| 0,06 | 17,46 | 0,9352 | 0,9352 | |
| 0,03 | 17,37 | 0,9302 | 0,9302 | |
| 0,11 | 16,07 | 0,8607 | 0,8607 | |
| 0,07 | 15,32 | 0,8207 | 0,8207 | |
| 0,03 | 14,80 | 0,7928 | 0,7928 | |
| 0,05 | 14,38 | 0,7699 | 0,7699 |
Principales baisses ce trimestre
Nous utilisons la variation de l'allocation du portefeuille car il s'agit de l'indicateur le plus significatif. Les changements peuvent être dus à des transactions ou à des variations de prix des actions.
| Titre | Actions (en millions) |
Valeur ($ en millions) |
% du portefeuille | ΔPortefeuille % |
|---|---|---|---|---|
| 0,58 | 55,28 | 2,9606 | -1,0811 | |
| 0,29 | 63,34 | 3,3920 | -1,0040 | |
| 0,37 | 57,00 | 3,0526 | -1,0010 | |
| 0,19 | 66,69 | 3,5719 | -0,9987 | |
| 0,20 | 60,15 | 3,2212 | -0,9510 | |
| 0,11 | 59,55 | 3,1894 | -0,8848 | |
| 0,14 | 59,81 | 3,2032 | -0,8623 | |
| 0,50 | 57,14 | 3,0601 | -0,8613 | |
| 0,18 | 61,09 | 3,2717 | -0,8329 | |
| 0,13 | 58,74 | 3,1457 | -0,7119 |
Déclarations 13F et dépôts de fonds
Ce formulaire a été déposé le 2025-08-07 pour la période de déclaration 2025-06-30. Cliquez sur l'icône du lien pour voir l'historique complet des transactions.
Mettre à niveau pour débloquer les données premium et exporter vers Excel ![]() .
.
| Titre | Type | Prix moyen de l'action | Actions (en millions) |
ΔActions (%) |
ΔActions (%) |
Valeur ($ en millions) |
Portefeuille (%) |
ΔPortefeuille (%) |
|
|---|---|---|---|---|---|---|---|---|---|
| MSFT / Microsoft Corporation | 0,19 | 15,04 | 94,12 | 52,43 | 5,0410 | 0,9796 | |||
| APH / Amphenol Corporation | 0,84 | -8,66 | 82,72 | 37,52 | 4,4304 | 0,4738 | |||
| FI / Fiserv, Inc. | 0,40 | 39,79 | 69,53 | 9,14 | 3,7237 | -0,4665 | |||
| V / Visa Inc. | 0,19 | -5,27 | 66,69 | -4,03 | 3,5719 | -0,9987 | |||
| ICE / Intercontinental Exchange, Inc. | 0,36 | -3,79 | 66,30 | 2,33 | 3,5508 | -0,7105 | |||
| SYK / Stryker Corporation | 0,17 | -1,57 | 66,24 | 4,61 | 3,5476 | -0,6170 | |||
| FAST / Fastenal Company | 1,53 | 87,87 | 64,07 | 1,75 | 3,4316 | -0,7102 | |||
| CHKP / Check Point Software Technologies Ltd. | 0,29 | -2,38 | 63,34 | -5,24 | 3,3920 | -1,0040 | |||
| GOOGL / Alphabet Inc. | 0,36 | 1,04 | 62,79 | 15,15 | 3,3628 | -0,2238 | |||
| WMT / Walmart Inc. | 0,63 | -3,40 | 61,99 | 7,60 | 3,3200 | -0,4694 | |||
| TMO / Thermo Fisher Scientific Inc. | 0,15 | 35,84 | 61,57 | 10,69 | 3,2975 | -0,3610 | |||
| SHW / The Sherwin-Williams Company | 0,18 | -0,45 | 61,09 | -2,11 | 3,2717 | -0,8329 | |||
| ADP / Automatic Data Processing, Inc. | 0,20 | -6,07 | 60,15 | -5,18 | 3,2212 | -0,9510 | |||
| MSI / Motorola Solutions, Inc. | 0,14 | 0,75 | 59,81 | -3,24 | 3,2032 | -0,8623 | |||
| MRK / Merck & Co., Inc. | 0,75 | 26,13 | 59,75 | 11,23 | 3,2003 | -0,3331 | |||
| QCOM / QUALCOMM Incorporated | 0,37 | 3,73 | 59,64 | 7,54 | 3,1939 | -0,4533 | |||
| ROP / Roper Technologies, Inc. | 0,11 | -0,00 | 59,55 | -3,86 | 3,1894 | -0,8848 | |||
| ACN / Accenture plc | 0,20 | 6,78 | 58,82 | 2,28 | 3,1501 | -0,6321 | |||
| LIN / Linde plc | 0,13 | -0,61 | 58,74 | 0,14 | 3,1457 | -0,7119 | |||
| EXPD / Expeditors International of Washington, Inc. | 0,50 | 0,87 | 57,14 | -4,17 | 3,0601 | -0,8613 | |||
| ITW / Illinois Tool Works Inc. | 0,23 | 0,75 | 57,06 | 0,45 | 3,0560 | -0,6804 | |||
| JNJ / Johnson & Johnson | 0,37 | 0,41 | 57,00 | -7,52 | 3,0526 | -1,0010 | |||
| DHR / Danaher Corporation | 0,28 | 6,69 | 55,56 | 2,81 | 2,9756 | -0,5788 | |||
| CHD / Church & Dwight Co., Inc. | 0,58 | 3,04 | 55,28 | -10,04 | 2,9606 | -1,0811 | |||
| FDX / FedEx Corporation | 0,24 | 7,98 | 54,27 | 0,69 | 2,9065 | -0,6386 | |||
| PANW / Palo Alto Networks, Inc. | 0,10 | 20,74 | 1,1108 | 1,1108 | |||||
| NOW / ServiceNow, Inc. | 0,02 | 18,94 | 1,0143 | 1,0143 | |||||
| RCL / Royal Caribbean Cruises Ltd. | 0,06 | 18,85 | 1,0097 | 1,0097 | |||||
| MAR / Marriott International, Inc. | 0,06 | 17,46 | 0,9352 | 0,9352 | |||||
| MA / Mastercard Incorporated | 0,03 | 17,37 | 0,9302 | 0,9302 | |||||
| RTX / RTX Corporation | 0,11 | 16,07 | 0,8607 | 0,8607 | |||||
| AMZN / Amazon.com, Inc. | 0,07 | 15,32 | 0,8207 | 0,8207 | |||||
| ISRG / Intuitive Surgical, Inc. | 0,03 | 14,80 | 0,7928 | 0,7928 | |||||
| AAPL / Apple Inc. | 0,07 | 407,27 | 14,39 | 368,52 | 0,7709 | 0,5688 | |||
| CRM / Salesforce, Inc. | 0,05 | 14,38 | 0,7699 | 0,7699 | |||||
| LLY / Eli Lilly and Company | 0,02 | 6 991,15 | 14,37 | 6 615,89 | 0,7697 | 0,7556 | |||
| BA / The Boeing Company | 0,06 | 13,25 | 0,7095 | 0,7095 | |||||
| 0VQD / Chubb Limited | 0,04 | 12,54 | 0,6715 | 0,6715 | |||||
| CAT / Caterpillar Inc. | 0,03 | 11,83 | 0,6338 | 0,6338 | |||||
| HD / The Home Depot, Inc. | 0,03 | 2 543,14 | 10,45 | 2 544,56 | 0,5595 | 0,5335 | |||
| ZTS / Zoetis Inc. | 0,06 | 9,37 | 0,5018 | 0,5018 | |||||
| SBUX / Starbucks Corporation | 0,10 | 9,33 | 0,4995 | 0,4995 | |||||
| BRK.A / Berkshire Hathaway Inc. | 0,00 | 0,00 | 8,75 | -8,73 | 0,4684 | -0,1618 | |||
| DAL / Delta Air Lines, Inc. | 0,18 | 8,72 | 0,4671 | 0,4671 | |||||
| DVN / Devon Energy Corporation | 0,23 | 7,38 | 0,3951 | 0,3951 | |||||
| GEV / GE Vernova Inc. | 0,01 | 3,30 | 0,1770 | 0,1770 | |||||
| JPM / JPMorgan Chase & Co. | 0,01 | 2,80 | 0,1500 | 0,1500 | |||||
| DE / Deere & Company | 0,01 | 2,76 | 0,1476 | 0,1476 | |||||
| SPGI / S&P Global Inc. | 0,00 | 1,57 | 0,0840 | 0,0840 | |||||
| BLK / BlackRock, Inc. | 0,00 | 1,26 | 0,0674 | 0,0674 | |||||
| MCD / McDonald's Corporation | 0,00 | 5,47 | 1,13 | -1,40 | 0,0603 | -0,0148 | |||
| BP / BP p.l.c. - Depositary Receipt (Common Stock) | 0,04 | 1,12 | 0,0602 | 0,0602 | |||||
| XOM / Exxon Mobil Corporation | 0,01 | 0,83 | 0,0443 | 0,0443 | |||||
| OMC / Omnicom Group Inc. | 0,01 | 0,00 | 0,78 | -13,18 | 0,0416 | -0,0173 | |||
| 1AMGN / Amgen Inc. | 0,00 | 0,65 | 0,0351 | 0,0351 | |||||
| HON / Honeywell International Inc. | 0,00 | 0,61 | 0,0324 | 0,0324 | |||||
| PAYX / Paychex, Inc. | 0,00 | 0,54 | 0,0290 | 0,0290 | |||||
| SPY / SPDR S&P 500 ETF | 0,00 | 32,62 | 0,54 | 46,72 | 0,0288 | 0,0047 | |||
| TGT / Target Corporation | 0,01 | -11,64 | 0,53 | -16,59 | 0,0286 | -0,0134 | |||
| PEP / PepsiCo, Inc. | 0,00 | 0,00 | 0,50 | -11,82 | 0,0268 | -0,0106 | |||
| SLB / Schlumberger Limited | 0,01 | 0,27 | 0,0147 | 0,0147 | |||||
| EMR / Emerson Electric Co. | 0,00 | 0,24 | 0,0129 | 0,0129 | |||||
| DIS / The Walt Disney Company | 0,00 | -50,71 | 0,22 | -38,06 | 0,0120 | -0,0118 |