Statistiques de base
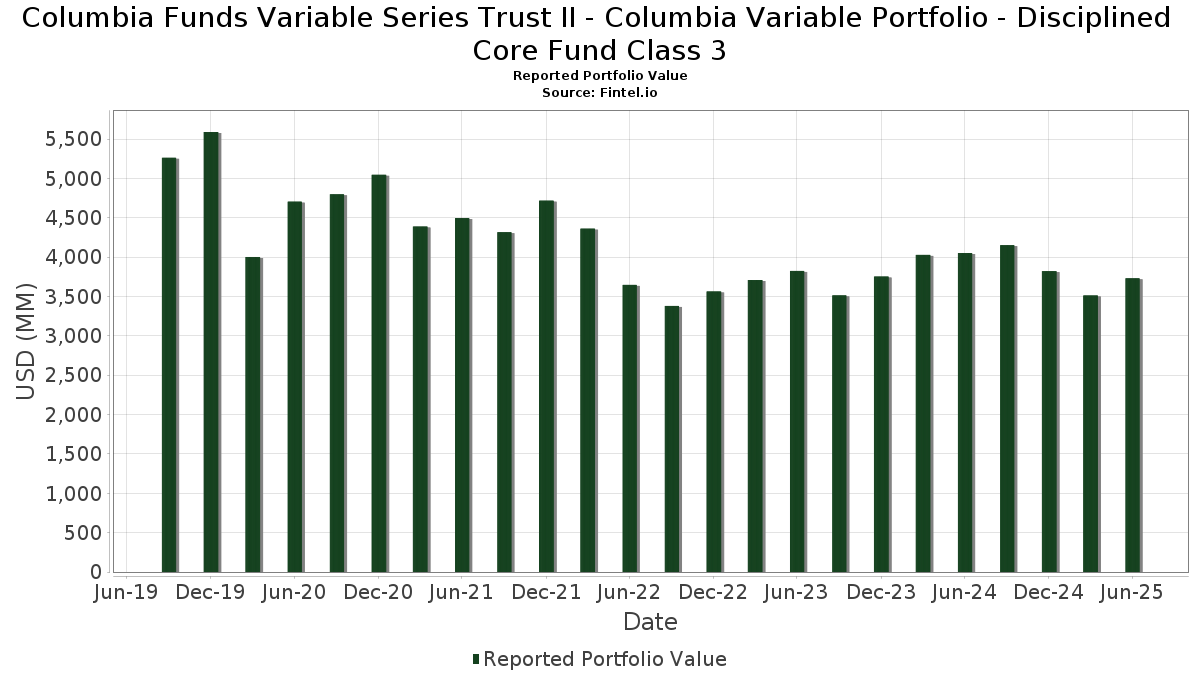
| Valeur du portefeuille | $ 3 731 013 009 |
| Positions actuelles | 83 |
Dernières positions, performances, ASG (à partir des dépôts 13F, 13D)
Columbia Funds Variable Series Trust II - Columbia Variable Portfolio - Disciplined Core Fund Class 3 a déclaré un total de 83 positions dans ses derniers dépôts auprès de la SEC. La valeur la plus récente du portefeuille est calculée à 3 731 013 009 USD. Les actifs sous gestion réels (ASG) sont cette valeur plus les liquidités (qui ne sont pas divulguées). Les principales positions de Columbia Funds Variable Series Trust II - Columbia Variable Portfolio - Disciplined Core Fund Class 3 sont NVIDIA Corporation (US:NVDA) , Microsoft Corporation (US:MSFT) , Apple Inc. (US:AAPL) , Alphabet Inc. (US:GOOGL) , and Meta Platforms, Inc. (US:META) . Les nouvelles positions de Columbia Funds Variable Series Trust II - Columbia Variable Portfolio - Disciplined Core Fund Class 3 incluent Conagra Brands, Inc. (US:CAG) , Uber Technologies, Inc. (US:UBER) , Eastman Chemical Company (IT:1EMN) , .
Meilleures augmentations ce trimestre
Nous utilisons la variation de l'allocation du portefeuille car il s'agit de l'indicateur le plus significatif. Les changements peuvent être dus à des transactions ou à des variations de prix des actions.
| Titre | Actions (en millions) |
Valeur ($ en millions) |
% du portefeuille | ΔPortefeuille % |
|---|---|---|---|---|
| 2,11 | 333,90 | 8,9443 | 2,3121 | |
| 0,61 | 64,19 | 1,7195 | 1,7195 | |
| 0,51 | 251,38 | 6,7338 | 1,0932 | |
| 0,17 | 58,61 | 1,5699 | 0,9598 | |
| 0,25 | 181,27 | 4,8558 | 0,7572 | |
| 0,33 | 32,81 | 0,8790 | 0,6401 | |
| 0,33 | 22,54 | 0,6038 | 0,6038 | |
| 0,66 | 67,80 | 1,8162 | 0,5773 | |
| 1,04 | 21,32 | 0,5711 | 0,5711 | |
| 0,12 | 45,28 | 1,2128 | 0,4374 |
Principales baisses ce trimestre
Nous utilisons la variation de l'allocation du portefeuille car il s'agit de l'indicateur le plus significatif. Les changements peuvent être dus à des transactions ou à des variations de prix des actions.
| Titre | Actions (en millions) |
Valeur ($ en millions) |
% du portefeuille | ΔPortefeuille % |
|---|---|---|---|---|
| 26,42 | 26,42 | 0,7077 | -1,1282 | |
| 0,98 | 200,20 | 5,3628 | -0,9131 | |
| 0,06 | 17,25 | 0,4620 | -0,7575 | |
| 0,00 | 0,00 | -0,7496 | ||
| 0,02 | 6,85 | 0,1836 | -0,7331 | |
| 0,14 | 30,03 | 0,8045 | -0,6955 | |
| 0,08 | 36,80 | 0,9859 | -0,5555 | |
| 0,11 | 7,29 | 0,1954 | -0,5555 | |
| 0,38 | 34,76 | 0,9311 | -0,5490 | |
| 0,32 | 20,73 | 0,5552 | -0,4926 |
Déclarations 13F et dépôts de fonds
Ce formulaire a été déposé le 2025-08-22 pour la période de déclaration 2025-06-30. Cliquez sur l'icône du lien pour voir l'historique complet des transactions.
Mettre à niveau pour débloquer les données premium et exporter vers Excel ![]() .
.
| Titre | Type | Prix moyen de l'action | Actions (en millions) |
ΔActions (%) |
ΔActions (%) |
Valeur ($ en millions) |
Portefeuille (%) |
ΔPortefeuille (%) |
|
|---|---|---|---|---|---|---|---|---|---|
| NVDA / NVIDIA Corporation | 2,11 | -1,74 | 333,90 | 43,23 | 8,9443 | 2,3121 | |||
| MSFT / Microsoft Corporation | 0,51 | -4,31 | 251,38 | 26,79 | 6,7338 | 1,0932 | |||
| AAPL / Apple Inc. | 0,98 | -1,74 | 200,20 | -9,25 | 5,3628 | -0,9131 | |||
| GOOGL / Alphabet Inc. | 1,06 | -1,74 | 187,27 | 11,97 | 5,0164 | 0,2584 | |||
| META / Meta Platforms, Inc. | 0,25 | -1,74 | 181,27 | 25,83 | 4,8558 | 0,7572 | |||
| AMZN / Amazon.com, Inc. | 0,68 | -8,76 | 148,26 | 5,21 | 3,9714 | -0,0375 | |||
| BKNG / Booking Holdings Inc. | 0,02 | -5,57 | 87,76 | 18,67 | 2,3510 | 0,2469 | |||
| C / Citigroup Inc. | 0,97 | -1,74 | 82,47 | 17,81 | 2,2091 | 0,2176 | |||
| CRM / Salesforce, Inc. | 0,28 | 12,19 | 77,52 | 14,00 | 2,0766 | 0,1419 | |||
| QCOM / QUALCOMM Incorporated | 0,44 | -1,74 | 69,95 | 1,87 | 1,8739 | -0,0798 | |||
| MO / Altria Group, Inc. | 1,18 | -7,62 | 69,15 | -9,76 | 1,8524 | -0,3278 | |||
| BLK / BlackRock, Inc. | 0,06 | -1,75 | 67,94 | 8,92 | 1,8199 | 0,0454 | |||
| ANET / Arista Networks Inc | 0,66 | 17,90 | 67,80 | 55,69 | 1,8162 | 0,5773 | |||
| FI / Fiserv, Inc. | 0,39 | 12,69 | 66,92 | -12,02 | 1,7925 | -0,3713 | |||
| SYF / Synchrony Financial | 1,00 | 6,32 | 66,53 | 34,04 | 1,7823 | 0,3701 | |||
| PANW / Palo Alto Networks, Inc. | 0,32 | -14,89 | 65,21 | 2,07 | 1,7467 | -0,0708 | |||
| JCI / Johnson Controls International plc | 0,61 | 64,19 | 1,7195 | 1,7195 | |||||
| MMC / Marsh & McLennan Companies, Inc. | 0,29 | -1,74 | 63,57 | -11,97 | 1,7027 | -0,3515 | |||
| ADP / Automatic Data Processing, Inc. | 0,20 | 7,82 | 62,88 | 8,83 | 1,6844 | 0,0406 | |||
| BMY / Bristol-Myers Squibb Company | 1,34 | 13,98 | 61,88 | -13,49 | 1,6576 | -0,3774 | |||
| V / Visa Inc. | 0,17 | 169,72 | 58,61 | 173,26 | 1,5699 | 0,9598 | |||
| CME / CME Group Inc. | 0,19 | 8,33 | 53,05 | 12,55 | 1,4209 | 0,0801 | |||
| RL / Ralph Lauren Corporation | 0,19 | -1,74 | 52,80 | 22,09 | 1,4143 | 0,1840 | |||
| CF / CF Industries Holdings, Inc. | 0,57 | -1,74 | 52,05 | 15,67 | 1,3944 | 0,1141 | |||
| SNA / Snap-on Incorporated | 0,15 | 31,24 | 47,57 | 21,18 | 1,2742 | 0,1575 | |||
| ADBE / Adobe Inc. | 0,12 | 64,67 | 45,28 | 66,11 | 1,2128 | 0,4374 | |||
| CVX / Chevron Corporation | 0,31 | 8,72 | 44,89 | -6,95 | 1,2025 | -0,1700 | |||
| MDT / Medtronic plc | 0,47 | -1,74 | 40,87 | -4,69 | 1,0948 | -0,1251 | |||
| NTAP / NetApp, Inc. | 0,38 | -20,20 | 40,23 | -3,21 | 1,0777 | -0,1048 | |||
| TPR / Tapestry, Inc. | 0,45 | 8,85 | 39,81 | 35,75 | 1,0664 | 0,2321 | |||
| PHM / PulteGroup, Inc. | 0,36 | -1,74 | 38,12 | 0,80 | 1,0212 | -0,0548 | |||
| VLO / Valero Energy Corporation | 0,28 | -7,85 | 37,30 | -6,21 | 0,9991 | -0,1323 | |||
| TT / Trane Technologies plc | 0,08 | -47,68 | 36,80 | -32,07 | 0,9859 | -0,5555 | |||
| ALL / The Allstate Corporation | 0,18 | 38,08 | 36,16 | 34,24 | 0,9685 | 0,2023 | |||
| BAX / Baxter International Inc. | 1,15 | -1,74 | 34,96 | -13,08 | 0,9364 | -0,2078 | |||
| MCK / McKesson Corporation | 0,05 | 24,21 | 34,77 | 35,24 | 0,9313 | 0,2000 | |||
| CL / Colgate-Palmolive Company | 0,38 | -31,13 | 34,76 | -33,19 | 0,9311 | -0,5490 | |||
| TSLA / Tesla, Inc. | 0,11 | -1,74 | 33,84 | 20,43 | 0,9064 | 0,1071 | |||
| TGT / Target Corporation | 0,33 | 391,98 | 32,81 | 259,04 | 0,8790 | 0,6401 | |||
| PCG / PG&E Corporation | 2,33 | -1,74 | 32,54 | -20,27 | 0,8716 | -0,2895 | |||
| DAL / Delta Air Lines, Inc. | 0,62 | -1,74 | 30,37 | 10,83 | 0,8136 | 0,0340 | |||
| AMT / American Tower Corporation | 0,14 | -43,92 | 30,03 | -43,04 | 0,8045 | -0,6955 | |||
| VTRS / Viatris Inc. | 3,17 | 6,96 | 28,27 | 9,66 | 0,7572 | 0,0238 | |||
| 19766H239 / COLUMBIA SHORT TERM CASH FUND | 26,42 | -59,06 | 26,42 | -59,06 | 0,7077 | -1,1282 | |||
| MAS / Masco Corporation | 0,39 | -26,57 | 24,97 | -32,04 | 0,6688 | -0,3764 | |||
| TAP / Molson Coors Beverage Company | 0,49 | -1,74 | 23,64 | -22,37 | 0,6333 | -0,2331 | |||
| ABBV / AbbVie Inc. | 0,13 | -1,74 | 23,38 | -12,95 | 0,6263 | -0,1378 | |||
| PNR / Pentair plc | 0,22 | 16,29 | 22,90 | 36,47 | 0,6134 | 0,1360 | |||
| CVS / CVS Health Corporation | 0,33 | 22,54 | 0,6038 | 0,6038 | |||||
| CAG / Conagra Brands, Inc. | 1,04 | 21,32 | 0,5711 | 0,5711 | |||||
| VRTX / Vertex Pharmaceuticals Incorporated | 0,05 | -1,74 | 20,77 | -9,77 | 0,5563 | -0,0985 | |||
| HOLX / Hologic, Inc. | 0,32 | -46,65 | 20,73 | -43,72 | 0,5552 | -0,4926 | |||
| EIX / Edison International | 0,37 | -1,74 | 19,25 | -13,95 | 0,5158 | -0,1208 | |||
| XOM / Exxon Mobil Corporation | 0,17 | -1,74 | 18,72 | -10,94 | 0,5014 | -0,0965 | |||
| AVGO / Broadcom Inc. | 0,07 | -1,74 | 18,50 | 61,76 | 0,4956 | 0,1702 | |||
| SBAC / SBA Communications Corporation | 0,08 | -1,74 | 18,33 | 4,88 | 0,4909 | -0,0062 | |||
| NOW / ServiceNow, Inc. | 0,02 | -12,12 | 17,97 | 13,48 | 0,4813 | 0,0309 | |||
| JPM / JPMorgan Chase & Co. | 0,06 | -65,96 | 17,25 | -59,77 | 0,4620 | -0,7575 | |||
| FTNT / Fortinet, Inc. | 0,15 | -1,74 | 15,62 | 7,92 | 0,4184 | 0,0066 | |||
| LMT / Lockheed Martin Corporation | 0,03 | -1,74 | 14,83 | 1,88 | 0,3973 | -0,0169 | |||
| EQIX / Equinix, Inc. | 0,02 | 14,77 | 0,3957 | 0,3957 | |||||
| QRVO / Qorvo, Inc. | 0,17 | -43,17 | 14,68 | -33,36 | 0,3931 | -0,2333 | |||
| AMGN / Amgen Inc. | 0,05 | -1,74 | 13,10 | -11,94 | 0,3508 | -0,0723 | |||
| FOXA / Fox Corporation | 0,21 | 23,41 | 11,70 | 22,19 | 0,3133 | 0,0410 | |||
| IQV / IQVIA Holdings Inc. | 0,07 | -1,74 | 11,66 | -12,17 | 0,3124 | -0,0654 | |||
| UAL / United Airlines Holdings, Inc. | 0,13 | -1,74 | 10,61 | 13,31 | 0,2843 | 0,0178 | |||
| EXC / Exelon Corporation | 0,23 | 9,98 | 0,2673 | 0,2673 | |||||
| EXPE / Expedia Group, Inc. | 0,06 | -1,74 | 9,98 | -1,40 | 0,2672 | -0,0206 | |||
| NEM / Newmont Corporation | 0,16 | 9,37 | 0,2511 | 0,2511 | |||||
| REGN / Regeneron Pharmaceuticals, Inc. | 0,02 | -1,75 | 8,72 | -18,67 | 0,2335 | -0,0714 | |||
| UBER / Uber Technologies, Inc. | 0,09 | 8,34 | 0,2233 | 0,2233 | |||||
| 1EMN / Eastman Chemical Company | 0,11 | 8,32 | 0,2228 | 0,2228 | |||||
| CSCO / Cisco Systems, Inc. | 0,11 | -83,59 | 7,29 | -76,04 | 0,1954 | -0,5555 | |||
| MPC / Marathon Petroleum Corporation | 0,04 | -1,74 | 6,97 | 12,02 | 0,1867 | 0,0097 | |||
| CI / The Cigna Group | 0,02 | -78,83 | 6,85 | -78,73 | 0,1836 | -0,7331 | |||
| AES / The AES Corporation | 0,65 | 6,84 | 0,1831 | 0,1831 | |||||
| BRK.B / Berkshire Hathaway Inc. | 0,01 | -66,95 | 6,25 | -41,19 | 0,1675 | -0,0787 | |||
| VRSN / VeriSign, Inc. | 0,02 | -84,26 | 5,70 | -73,84 | 0,1528 | -0,4895 | |||
| HST / Host Hotels & Resorts, Inc. | 0,35 | -1,74 | 5,33 | 6,21 | 0,1429 | 0,0000 | |||
| STLD / Steel Dynamics, Inc. | 0,04 | -70,59 | 5,24 | -69,91 | 0,1405 | -0,3552 | |||
| KMB / Kimberly-Clark Corporation | 0,04 | -4,26 | 4,83 | -13,22 | 0,1293 | -0,0289 | |||
| BMRN / BioMarin Pharmaceutical Inc. | 0,08 | -1,74 | 4,58 | -23,59 | 0,1226 | -0,0478 | |||
| DE000C4SA6R6 / EURO STOXX 50 Index | 0,83 | 0,0221 | 0,0221 | ||||||
| CAT / Caterpillar Inc. | 0,00 | -100,00 | 0,00 | -100,00 | -0,7496 | ||||
| WAB / Westinghouse Air Brake Technologies Corporation | 0,00 | -100,00 | 0,00 | -100,00 | -0,4019 |