Statistiques de base
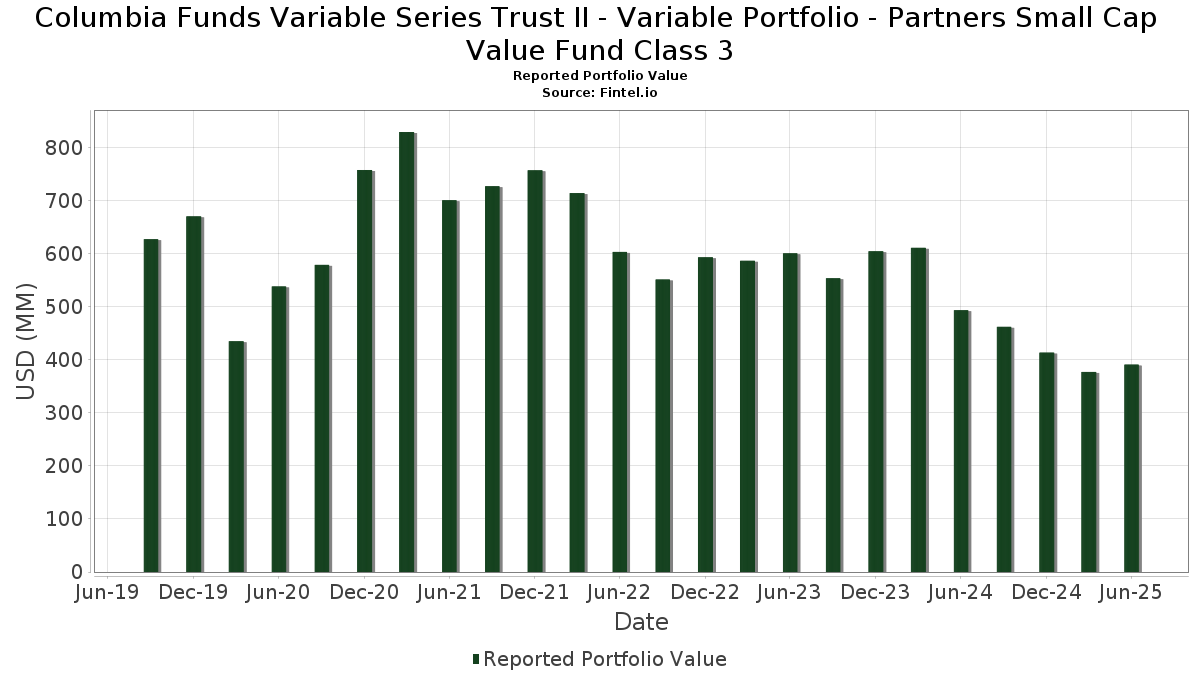
| Valeur du portefeuille | $ 391 213 592 |
| Positions actuelles | 170 |
Dernières positions, performances, ASG (à partir des dépôts 13F, 13D)
Columbia Funds Variable Series Trust II - Variable Portfolio - Partners Small Cap Value Fund Class 3 a déclaré un total de 170 positions dans ses derniers dépôts auprès de la SEC. La valeur la plus récente du portefeuille est calculée à 391 213 592 USD. Les actifs sous gestion réels (ASG) sont cette valeur plus les liquidités (qui ne sont pas divulguées). Les principales positions de Columbia Funds Variable Series Trust II - Variable Portfolio - Partners Small Cap Value Fund Class 3 sont COLUMBIA SHORT TERM CASH FUND (US:19766H239) , Texas Capital Bancshares, Inc. (US:TCBI) , Belden Inc. (US:BDC) , Ameris Bancorp (US:ABCB) , and Seacoast Banking Corporation of Florida (US:SBCF) . Les nouvelles positions de Columbia Funds Variable Series Trust II - Variable Portfolio - Partners Small Cap Value Fund Class 3 incluent Kirby Corporation (US:KEX) , Alaska Air Group, Inc. (US:ALK) , YETI Holdings, Inc. (US:YETI) , GXO Logistics, Inc. (US:GXO) , and Vishay Precision Group, Inc. (US:VPG) .
Meilleures augmentations ce trimestre
Nous utilisons la variation de l'allocation du portefeuille car il s'agit de l'indicateur le plus significatif. Les changements peuvent être dus à des transactions ou à des variations de prix des actions.
| Titre | Actions (en millions) |
Valeur ($ en millions) |
% du portefeuille | ΔPortefeuille % |
|---|---|---|---|---|
| 0,02 | 2,38 | 0,6077 | 0,6077 | |
| 0,05 | 2,24 | 0,5734 | 0,5734 | |
| 0,08 | 4,35 | 1,1100 | 0,5510 | |
| 0,04 | 5,68 | 1,4497 | 0,4367 | |
| 0,02 | 2,19 | 0,5586 | 0,3903 | |
| 0,43 | 4,44 | 1,1339 | 0,3599 | |
| 0,04 | 1,25 | 0,3186 | 0,3186 | |
| 0,08 | 4,06 | 1,0361 | 0,3087 | |
| 0,12 | 3,85 | 0,9822 | 0,2353 | |
| 0,10 | 5,16 | 1,3169 | 0,2249 |
Principales baisses ce trimestre
Nous utilisons la variation de l'allocation du portefeuille car il s'agit de l'indicateur le plus significatif. Les changements peuvent être dus à des transactions ou à des variations de prix des actions.
| Titre | Actions (en millions) |
Valeur ($ en millions) |
% du portefeuille | ΔPortefeuille % |
|---|---|---|---|---|
| 0,02 | 0,55 | 0,1401 | -0,2395 | |
| 0,01 | 1,53 | 0,3920 | -0,2293 | |
| 0,02 | 0,52 | 0,1339 | -0,2097 | |
| 0,05 | 0,49 | 0,1243 | -0,2029 | |
| 0,24 | 2,04 | 0,5203 | -0,1846 | |
| 0,03 | 0,60 | 0,1522 | -0,1787 | |
| 0,12 | 3,43 | 0,8757 | -0,1776 | |
| 0,38 | 3,57 | 0,9107 | -0,1744 | |
| 0,10 | 2,21 | 0,5656 | -0,1744 | |
| 0,06 | 0,86 | 0,2203 | -0,1731 |
Déclarations 13F et dépôts de fonds
Ce formulaire a été déposé le 2025-08-22 pour la période de déclaration 2025-06-30. Cliquez sur l'icône du lien pour voir l'historique complet des transactions.
Mettre à niveau pour débloquer les données premium et exporter vers Excel ![]() .
.
| Titre | Type | Prix moyen de l'action | Actions (en millions) |
ΔActions (%) |
ΔActions (%) |
Valeur ($ en millions) |
Portefeuille (%) |
ΔPortefeuille (%) |
|
|---|---|---|---|---|---|---|---|---|---|
| 19766H239 / COLUMBIA SHORT TERM CASH FUND | 12,13 | 11,74 | 12,13 | 11,74 | 3,0973 | 0,2242 | |||
| TCBI / Texas Capital Bancshares, Inc. | 0,08 | -0,62 | 6,71 | 5,62 | 1,7131 | 0,0321 | |||
| BDC / Belden Inc. | 0,05 | -0,45 | 6,08 | 15,00 | 1,5532 | 0,1531 | |||
| ABCB / Ameris Bancorp | 0,09 | -0,71 | 6,01 | 11,59 | 1,5349 | 0,1092 | |||
| SBCF / Seacoast Banking Corporation of Florida | 0,21 | -0,30 | 5,87 | 7,02 | 1,5001 | 0,0473 | |||
| ICUI / ICU Medical, Inc. | 0,04 | 55,87 | 5,68 | 48,33 | 1,4497 | 0,4367 | |||
| REVG / REV Group, Inc. | 0,11 | -37,75 | 5,28 | -6,26 | 1,3475 | -0,1424 | |||
| MRCY / Mercury Systems, Inc. | 0,10 | 0,00 | 5,16 | 25,00 | 1,3169 | 0,2249 | |||
| VMI / Valmont Industries, Inc. | 0,02 | 0,00 | 5,13 | 14,45 | 1,3094 | 0,1234 | |||
| HWC / Hancock Whitney Corporation | 0,09 | -0,34 | 5,12 | 9,05 | 1,3078 | 0,0649 | |||
| CTRE / CareTrust REIT, Inc. | 0,15 | -0,86 | 4,68 | 6,15 | 1,1959 | 0,0281 | |||
| COLB / Columbia Banking System, Inc. | 0,20 | -0,27 | 4,64 | -6,50 | 1,1840 | -0,1287 | |||
| DBRG / DigitalBridge Group, Inc. | 0,43 | 29,41 | 4,44 | 51,83 | 1,1339 | 0,3599 | |||
| AZZ / AZZ Inc. | 0,05 | 0,00 | 4,40 | 13,01 | 1,1250 | 0,0931 | |||
| SLGN / Silgan Holdings Inc. | 0,08 | 94,19 | 4,35 | 105,83 | 1,1100 | 0,5510 | |||
| NGVT / Ingevity Corporation | 0,10 | 0,00 | 4,27 | 8,82 | 1,0910 | 0,0520 | |||
| PZZA / Papa John's International, Inc. | 0,08 | 23,93 | 4,06 | 47,65 | 1,0361 | 0,3087 | |||
| MP / MP Materials Corp. | 0,12 | 0,00 | 3,85 | 36,30 | 0,9822 | 0,2353 | |||
| VFC / V.F. Corporation | 0,31 | 41,12 | 3,69 | 6,83 | 0,9429 | 0,0281 | |||
| AHCO / AdaptHealth Corp. | 0,38 | 0,00 | 3,57 | -13,01 | 0,9107 | -0,1744 | |||
| OI / O-I Glass, Inc. | 0,24 | 0,00 | 3,56 | 28,51 | 0,9098 | 0,1760 | |||
| QDEL / QuidelOrtho Corporation | 0,12 | 4,56 | 3,43 | -13,83 | 0,8757 | -0,1776 | |||
| GT / The Goodyear Tire & Rubber Company | 0,33 | 0,00 | 3,38 | 12,23 | 0,8630 | 0,0660 | |||
| PRGS / Progress Software Corporation | 0,05 | 0,00 | 3,33 | 23,94 | 0,8517 | 0,1394 | |||
| GPOR / Gulfport Energy Corporation | 0,02 | -1,28 | 3,33 | 7,83 | 0,8510 | 0,0331 | |||
| AGI / Alamos Gold Inc. | 0,12 | 0,00 | 3,11 | -0,67 | 0,7938 | -0,0346 | |||
| TMHC / Taylor Morrison Home Corporation | 0,05 | -1,29 | 3,10 | 0,98 | 0,7908 | -0,0209 | |||
| ALGM / Allegro MicroSystems, Inc. | 0,09 | 0,00 | 3,08 | 36,05 | 0,7877 | 0,1876 | |||
| WLY / John Wiley & Sons, Inc. | 0,07 | -1,29 | 3,04 | -1,14 | 0,7766 | -0,0376 | |||
| AAP / Advance Auto Parts, Inc. | 0,06 | 3,15 | 3,00 | 22,26 | 0,7663 | 0,1168 | |||
| ENS / EnerSys | 0,03 | 14,08 | 2,94 | 6,86 | 0,7520 | 0,0225 | |||
| NBHC / National Bank Holdings Corporation | 0,08 | 0,00 | 2,94 | -1,71 | 0,7510 | -0,0411 | |||
| APOG / Apogee Enterprises, Inc. | 0,07 | 41,13 | 2,92 | 23,69 | 0,7470 | 0,1209 | |||
| PPBI / Pacific Premier Bancorp, Inc. | 0,14 | -0,80 | 2,91 | -1,86 | 0,7424 | -0,0418 | |||
| ONB / Old National Bancorp | 0,13 | -1,29 | 2,87 | -0,59 | 0,7320 | -0,0312 | |||
| ESRT / Empire State Realty Trust, Inc. | 0,35 | -0,89 | 2,86 | 2,55 | 0,7297 | -0,0079 | |||
| LFUS / Littelfuse, Inc. | 0,01 | 0,00 | 2,85 | 15,26 | 0,7276 | 0,0732 | |||
| TXNM / TXNM Energy, Inc. | 0,05 | 21,01 | 2,76 | 27,45 | 0,7045 | 0,1315 | |||
| WSBC / WesBanco, Inc. | 0,08 | 0,00 | 2,67 | 2,18 | 0,6831 | -0,0099 | |||
| SIGI / Selective Insurance Group, Inc. | 0,03 | 49,26 | 2,64 | 41,26 | 0,6753 | 0,1799 | |||
| CADE / Cadence Bank | 0,08 | 0,00 | 2,63 | 5,32 | 0,6728 | 0,0108 | |||
| SYNA / Synaptics Incorporated | 0,04 | 0,00 | 2,63 | 1,74 | 0,6719 | -0,0127 | |||
| SXT / Sensient Technologies Corporation | 0,03 | 0,00 | 2,55 | 32,38 | 0,6508 | 0,1412 | |||
| ESE / ESCO Technologies Inc. | 0,01 | -0,49 | 2,54 | 20,00 | 0,6485 | 0,0883 | |||
| EXTR / Extreme Networks, Inc. | 0,14 | -1,29 | 2,51 | 33,96 | 0,6400 | 0,1447 | |||
| ABM / ABM Industries Incorporated | 0,05 | -1,29 | 2,49 | -1,62 | 0,6373 | -0,0340 | |||
| KRG / Kite Realty Group Trust | 0,11 | -1,29 | 2,49 | -0,04 | 0,6353 | -0,0236 | |||
| EFSC / Enterprise Financial Services Corp | 0,05 | -1,28 | 2,48 | 1,22 | 0,6344 | -0,0153 | |||
| SANM / Sanmina Corporation | 0,03 | -1,29 | 2,47 | 26,78 | 0,6314 | 0,1151 | |||
| EBC / Eastern Bankshares, Inc. | 0,16 | -1,29 | 2,47 | -8,12 | 0,6306 | -0,0806 | |||
| FCPT / Four Corners Property Trust, Inc. | 0,09 | -1,29 | 2,43 | -7,43 | 0,6202 | -0,0744 | |||
| RNST / Renasant Corporation | 0,07 | -1,20 | 2,42 | 4,63 | 0,6173 | 0,0058 | |||
| KEX / Kirby Corporation | 0,02 | 2,38 | 0,6077 | 0,6077 | |||||
| TSEM / Tower Semiconductor Ltd. | 0,05 | -1,11 | 2,37 | 20,23 | 0,6057 | 0,0834 | |||
| MMS / Maximus, Inc. | 0,03 | -1,09 | 2,36 | 1,85 | 0,6034 | -0,0108 | |||
| TPH / Tri Pointe Homes, Inc. | 0,07 | -1,29 | 2,36 | -1,21 | 0,6031 | -0,0296 | |||
| KAR / OPENLANE, Inc. | 0,10 | -1,29 | 2,36 | 25,19 | 0,6019 | 0,1035 | |||
| ANIP / ANI Pharmaceuticals, Inc. | 0,04 | -0,47 | 2,35 | -3,01 | 0,6012 | -0,0412 | |||
| AVT / Avnet, Inc. | 0,04 | -0,81 | 2,35 | 9,45 | 0,6008 | 0,0320 | |||
| LNTH / Lantheus Holdings, Inc. | 0,03 | 14,70 | 2,34 | -3,78 | 0,5978 | -0,0463 | |||
| CSGS / CSG Systems International, Inc. | 0,04 | -0,67 | 2,34 | 7,30 | 0,5970 | 0,0202 | |||
| BANC / Banc of California, Inc. | 0,17 | -1,29 | 2,33 | -2,26 | 0,5961 | -0,0361 | |||
| TGLS / Tecnoglass Inc. | 0,03 | -1,09 | 2,32 | 6,97 | 0,5919 | 0,0182 | |||
| HURN / Huron Consulting Group Inc. | 0,02 | -1,27 | 2,30 | -5,35 | 0,5883 | -0,0558 | |||
| CBU / Community Financial System, Inc. | 0,04 | 0,00 | 2,29 | 0,00 | 0,5860 | -0,0213 | |||
| HAE / Haemonetics Corporation | 0,03 | 5,37 | 2,29 | 23,69 | 0,5843 | 0,0947 | |||
| FBNC / First Bancorp | 0,05 | -1,28 | 2,29 | 8,39 | 0,5842 | 0,0257 | |||
| CBRL / Cracker Barrel Old Country Store, Inc. | 0,04 | -0,50 | 2,26 | 56,57 | 0,5786 | 0,1955 | |||
| KFY / Korn Ferry | 0,03 | -1,30 | 2,25 | 6,73 | 0,5753 | 0,0165 | |||
| ALK / Alaska Air Group, Inc. | 0,05 | 2,24 | 0,5734 | 0,5734 | |||||
| AUB / Atlantic Union Bankshares Corporation | 0,07 | -0,67 | 2,24 | -0,22 | 0,5714 | -0,0222 | |||
| MUR / Murphy Oil Corporation | 0,10 | 0,00 | 2,21 | -20,76 | 0,5656 | -0,1744 | |||
| SSB / SouthState Corporation | 0,02 | 0,00 | 2,21 | -0,85 | 0,5646 | -0,0256 | |||
| STEL / Stellar Bancorp, Inc. | 0,08 | -1,29 | 2,20 | -0,14 | 0,5616 | -0,0214 | |||
| IDA / IDACORP, Inc. | 0,02 | 246,24 | 2,19 | 244,25 | 0,5586 | 0,3903 | |||
| ESI / Element Solutions Inc | 0,10 | 7,15 | 2,18 | 7,35 | 0,5557 | 0,0191 | |||
| UMH / UMH Properties, Inc. | 0,13 | -1,29 | 2,17 | -11,39 | 0,5544 | -0,0940 | |||
| VSH / Vishay Intertechnology, Inc. | 0,14 | -0,85 | 2,16 | -1,01 | 0,5530 | -0,0258 | |||
| JBI / Janus International Group, Inc. | 0,27 | -0,47 | 2,16 | 12,50 | 0,5520 | 0,0435 | |||
| CMC / Commercial Metals Company | 0,04 | -1,30 | 2,16 | 4,96 | 0,5515 | 0,0067 | |||
| LXP / LXP Industrial Trust | 0,26 | -1,29 | 2,15 | -5,74 | 0,5493 | -0,0547 | |||
| STAG / STAG Industrial, Inc. | 0,06 | 18,61 | 2,15 | 19,13 | 0,5489 | 0,0714 | |||
| THR / Thermon Group Holdings, Inc. | 0,08 | -0,49 | 2,15 | 0,33 | 0,5482 | -0,0182 | |||
| DIOD / Diodes Incorporated | 0,04 | -0,81 | 2,14 | 21,50 | 0,5458 | 0,0803 | |||
| PWP / Perella Weinberg Partners | 0,11 | 19,81 | 2,13 | 26,43 | 0,5440 | 0,0981 | |||
| KN / Knowles Corporation | 0,12 | -0,81 | 2,13 | 14,99 | 0,5429 | 0,0535 | |||
| PNFP / Pinnacle Financial Partners, Inc. | 0,02 | -1,28 | 2,12 | 2,76 | 0,5423 | -0,0046 | |||
| WNS / WNS (Holdings) Limited | 0,03 | -19,40 | 2,12 | -17,12 | 0,5417 | -0,1356 | |||
| ATMU / Atmus Filtration Technologies Inc. | 0,06 | -0,47 | 2,12 | -1,30 | 0,5413 | -0,0272 | |||
| AL / Air Lease Corporation | 0,04 | -31,33 | 2,10 | -16,83 | 0,5365 | -0,1323 | |||
| AIN / Albany International Corp. | 0,03 | -0,52 | 2,09 | 1,06 | 0,5347 | -0,0137 | |||
| GBCI / Glacier Bancorp, Inc. | 0,05 | 0,00 | 2,09 | -2,61 | 0,5336 | -0,0341 | |||
| TNET / TriNet Group, Inc. | 0,03 | -0,64 | 2,09 | -8,31 | 0,5330 | -0,0694 | |||
| RUSHA / Rush Enterprises, Inc. | 0,04 | -1,18 | 2,09 | -4,71 | 0,5329 | -0,0467 | |||
| WAFD / WaFd, Inc | 0,07 | 16,15 | 2,08 | 19,00 | 0,5311 | 0,0685 | |||
| BRC / Brady Corporation | 0,03 | -1,28 | 2,06 | -5,02 | 0,5274 | -0,0481 | |||
| GVA / Granite Construction Incorporated | 0,02 | -1,28 | 2,06 | 22,43 | 0,5270 | 0,0809 | |||
| FRME / First Merchants Corporation | 0,05 | -1,29 | 2,04 | -6,51 | 0,5212 | -0,0567 | |||
| CRGY / Crescent Energy Company | 0,24 | 0,00 | 2,04 | -23,48 | 0,5203 | -0,1846 | |||
| SILA / Sila Realty Trust, Inc. | 0,08 | -0,47 | 2,00 | -11,79 | 0,5102 | -0,0894 | |||
| ELME / Elme Communities | 0,13 | -1,29 | 1,99 | -9,80 | 0,5079 | -0,0757 | |||
| AMBA / Ambarella, Inc. | 0,03 | 16,32 | 1,98 | 52,66 | 0,5068 | 0,1627 | |||
| SHOO / Steven Madden, Ltd. | 0,08 | -0,80 | 1,94 | -10,70 | 0,4947 | -0,0795 | |||
| ECVT / Ecovyst Inc. | 0,24 | -1,29 | 1,94 | 31,01 | 0,4945 | 0,1033 | |||
| ADTN / ADTRAN Holdings, Inc. | 0,21 | -0,87 | 1,91 | 1,97 | 0,4889 | -0,0081 | |||
| MTG / MGIC Investment Corporation | 0,07 | -0,65 | 1,90 | 11,68 | 0,4861 | 0,0347 | |||
| UCB / United Community Banks, Inc. | 0,06 | 0,00 | 1,90 | 5,93 | 0,4842 | 0,0103 | |||
| CENTA / Central Garden & Pet Company | 0,06 | 17,66 | 1,89 | 12,47 | 0,4840 | 0,0380 | |||
| KLIC / Kulicke and Soffa Industries, Inc. | 0,05 | -0,81 | 1,88 | 4,04 | 0,4809 | 0,0019 | |||
| NX / Quanex Building Products Corporation | 0,10 | 0,00 | 1,88 | 1,67 | 0,4808 | -0,0094 | |||
| AAMI / Acadian Asset Management Inc. | 0,05 | -33,19 | 1,85 | -8,97 | 0,4719 | -0,0653 | |||
| LZB / La-Z-Boy Incorporated | 0,05 | -0,66 | 1,84 | -5,53 | 0,4711 | -0,0458 | |||
| NWE / NorthWestern Energy Group, Inc. | 0,04 | -1,29 | 1,83 | -12,47 | 0,4662 | -0,0860 | |||
| OGE / OGE Energy Corp. | 0,04 | 0,00 | 1,82 | -3,44 | 0,4658 | -0,0342 | |||
| CPRI / Capri Holdings Limited | 0,10 | 0,00 | 1,82 | -10,28 | 0,4638 | -0,0721 | |||
| HUBG / Hub Group, Inc. | 0,05 | -1,29 | 1,80 | -11,24 | 0,4603 | -0,0771 | |||
| VRNT / Verint Systems Inc. | 0,09 | -1,29 | 1,79 | 8,76 | 0,4569 | 0,0215 | |||
| MTDR / Matador Resources Company | 0,04 | -1,29 | 1,70 | -7,81 | 0,4342 | -0,0539 | |||
| AWI / Armstrong World Industries, Inc. | 0,01 | -34,50 | 1,69 | -24,50 | 0,4309 | -0,1605 | |||
| GEF / Greif, Inc. | 0,02 | -30,31 | 1,59 | -17,62 | 0,4072 | -0,1052 | |||
| PBF / PBF Energy Inc. | 0,07 | -0,66 | 1,57 | 12,81 | 0,4004 | 0,0324 | |||
| XPRO / Expro Group Holdings N.V. | 0,18 | -1,19 | 1,57 | -14,61 | 0,4002 | -0,0856 | |||
| SR / Spire Inc. | 0,02 | -0,47 | 1,54 | -7,14 | 0,3922 | -0,0457 | |||
| MATX / Matson, Inc. | 0,01 | -75,44 | 1,53 | -66,13 | 0,3920 | -0,2293 | |||
| OLED / Universal Display Corporation | 0,01 | 0,00 | 1,52 | 10,79 | 0,3884 | 0,0249 | |||
| NEO / NeoGenomics, Inc. | 0,21 | 4,50 | 1,52 | -19,50 | 0,3881 | -0,1116 | |||
| VIAV / Viavi Solutions Inc. | 0,15 | 0,00 | 1,50 | -10,00 | 0,3840 | -0,0583 | |||
| AIR / AAR Corp. | 0,02 | 0,00 | 1,46 | 22,90 | 0,3731 | 0,0583 | |||
| PEB / Pebblebrook Hotel Trust | 0,14 | -1,29 | 1,40 | -2,64 | 0,3583 | -0,0232 | |||
| INVX / Innovex International, Inc. | 0,09 | -1,29 | 1,38 | -14,17 | 0,3514 | -0,0729 | |||
| GLPG / Galapagos NV - Depositary Receipt (Common Stock) | 0,05 | -18,83 | 1,36 | -9,57 | 0,3475 | -0,0508 | |||
| SHO / Sunstone Hotel Investors, Inc. | 0,15 | -1,29 | 1,34 | -8,94 | 0,3435 | -0,0475 | |||
| EPC / Edgewell Personal Care Company | 0,06 | -1,09 | 1,34 | -25,84 | 0,3425 | -0,1360 | |||
| RMBS / Rambus Inc. | 0,02 | 0,00 | 1,30 | 23,71 | 0,3318 | 0,0537 | |||
| MRTN / Marten Transport, Ltd. | 0,10 | -1,29 | 1,26 | -6,52 | 0,3224 | -0,0352 | |||
| ANGO / AngioDynamics, Inc. | 0,13 | 0,00 | 1,26 | 5,63 | 0,3216 | 0,0061 | |||
| YETI / YETI Holdings, Inc. | 0,04 | 1,25 | 0,3186 | 0,3186 | |||||
| ARCB / ArcBest Corporation | 0,02 | 0,00 | 1,23 | 9,11 | 0,3153 | 0,0158 | |||
| TRNO / Terreno Realty Corporation | 0,02 | 0,00 | 1,23 | -11,31 | 0,3146 | -0,0531 | |||
| NJR / New Jersey Resources Corporation | 0,03 | 0,00 | 1,22 | -8,63 | 0,3110 | -0,0419 | |||
| THRM / Gentherm Incorporated | 0,04 | 0,00 | 1,20 | 5,84 | 0,3058 | 0,0062 | |||
| GDEN / Golden Entertainment, Inc. | 0,04 | -0,65 | 1,19 | 10,78 | 0,3047 | 0,0196 | |||
| TITN / Titan Machinery Inc. | 0,06 | -1,29 | 1,19 | 14,77 | 0,3040 | 0,0294 | |||
| LASR / nLIGHT, Inc. | 0,06 | -51,41 | 1,09 | 23,09 | 0,2793 | 0,0441 | |||
| MNRO / Monro, Inc. | 0,07 | -1,29 | 1,09 | 1,77 | 0,2784 | -0,0053 | |||
| FL / Foot Locker, Inc. | 0,04 | -51,03 | 1,06 | -14,88 | 0,2703 | -0,0590 | |||
| WERN / Werner Enterprises, Inc. | 0,04 | -20,41 | 1,06 | -25,69 | 0,2699 | -0,1065 | |||
| LOCO / El Pollo Loco Holdings, Inc. | 0,09 | -1,29 | 1,00 | 5,46 | 0,2566 | 0,0045 | |||
| GERN / Geron Corporation | 0,70 | 0,00 | 0,98 | -11,39 | 0,2505 | -0,0423 | |||
| CGNT / Cognyte Software Ltd. | 0,10 | -41,82 | 0,97 | -31,03 | 0,2475 | -0,1247 | |||
| OXM / Oxford Industries, Inc. | 0,02 | -1,28 | 0,96 | -32,32 | 0,2457 | -0,1303 | |||
| FIVN / Five9, Inc. | 0,04 | 0,00 | 0,93 | -2,52 | 0,2373 | -0,0149 | |||
| WGO / Winnebago Industries, Inc. | 0,03 | -1,29 | 0,93 | -16,92 | 0,2372 | -0,0588 | |||
| ICHR / Ichor Holdings, Ltd. | 0,05 | 0,00 | 0,93 | -13,13 | 0,2367 | -0,0457 | |||
| BCRX / BioCryst Pharmaceuticals, Inc. | 0,10 | 0,00 | 0,87 | 19,45 | 0,2228 | 0,0295 | |||
| HP / Helmerich & Payne, Inc. | 0,06 | 0,00 | 0,86 | -41,95 | 0,2203 | -0,1731 | |||
| CMCO / Columbus McKinnon Corporation | 0,05 | 0,00 | 0,83 | -9,76 | 0,2126 | -0,0317 | |||
| COTY / Coty Inc. | 0,18 | 0,00 | 0,82 | -15,05 | 0,2107 | -0,0462 | |||
| EPAC / Enerpac Tool Group Corp. | 0,02 | 0,00 | 0,81 | -9,60 | 0,2071 | -0,0303 | |||
| ASTE / Astec Industries, Inc. | 0,02 | 0,00 | 0,79 | 20,96 | 0,2007 | 0,0288 | |||
| GXO / GXO Logistics, Inc. | 0,02 | 0,77 | 0,1975 | 0,1975 | |||||
| VAL / Valaris Limited | 0,02 | 0,00 | 0,77 | 7,24 | 0,1969 | 0,0066 | |||
| MD / Pediatrix Medical Group, Inc. | 0,05 | -15,22 | 0,75 | -16,01 | 0,1917 | -0,0450 | |||
| THS / TreeHouse Foods, Inc. | 0,03 | -33,48 | 0,60 | -52,36 | 0,1522 | -0,1787 | |||
| SM / SM Energy Company | 0,02 | -53,63 | 0,55 | -61,76 | 0,1401 | -0,2395 | |||
| RYI / Ryerson Holding Corporation | 0,02 | -57,02 | 0,52 | -59,60 | 0,1339 | -0,2097 | |||
| OEC / Orion S.A. | 0,05 | -51,45 | 0,49 | -60,65 | 0,1243 | -0,2029 | |||
| PEBO / Peoples Bancorp Inc. | 0,02 | 0,00 | 0,49 | 2,97 | 0,1243 | -0,0008 | |||
| VPG / Vishay Precision Group, Inc. | 0,02 | 0,46 | 0,1173 | 0,1173 | |||||
| KDNY / Chinook Therapeutics Inc | 0,00 | 0,00 | 0,00 | 0,00 | 0,0006 | -0,0000 | |||
| NEOG / Neogen Corporation | 0,00 | -100,00 | 0,00 | -100,00 | -0,1349 |