Statistiques de base
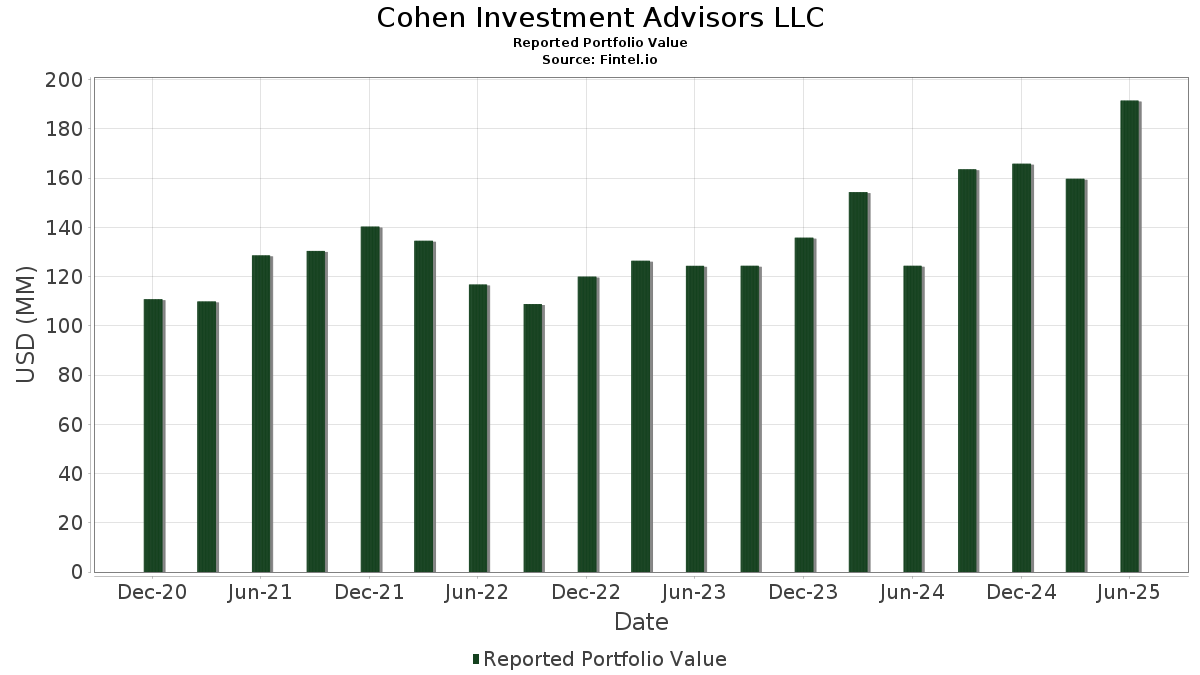
| Valeur du portefeuille | $ 191 500 051 |
| Positions actuelles | 80 |
Dernières positions, performances, ASG (à partir des dépôts 13F, 13D)
Cohen Investment Advisors LLC a déclaré un total de 80 positions dans ses derniers dépôts auprès de la SEC. La valeur la plus récente du portefeuille est calculée à 191 500 051 USD. Les actifs sous gestion réels (ASG) sont cette valeur plus les liquidités (qui ne sont pas divulguées). Les principales positions de Cohen Investment Advisors LLC sont Microsoft Corporation (US:MSFT) , Apple Inc. (US:AAPL) , Eli Lilly and Company (US:LLY) , Amazon.com, Inc. (US:AMZN) , and Meta Platforms, Inc. (US:META) . Les nouvelles positions de Cohen Investment Advisors LLC incluent CrowdStrike Holdings, Inc. (US:CRWD) , Palantir Technologies Inc. (US:PLTR) , .
Meilleures augmentations ce trimestre
Nous utilisons la variation de l'allocation du portefeuille car il s'agit de l'indicateur le plus significatif. Les changements peuvent être dus à des transactions ou à des variations de prix des actions.
| Titre | Actions (en millions) |
Valeur ($ en millions) |
% du portefeuille | ΔPortefeuille % |
|---|---|---|---|---|
| 0,03 | 4,50 | 2,3473 | 1,2682 | |
| 0,02 | 9,01 | 4,7024 | 0,7938 | |
| 0,01 | 7,66 | 3,9980 | 0,6021 | |
| 0,01 | 6,04 | 3,1525 | 0,5028 | |
| 0,01 | 5,32 | 2,7779 | 0,4115 | |
| 0,00 | 4,75 | 2,4819 | 0,3887 | |
| 0,08 | 3,40 | 1,7761 | 0,3451 | |
| 0,00 | 0,59 | 0,3072 | 0,3072 | |
| 0,03 | 3,12 | 1,6268 | 0,2825 | |
| 0,02 | 6,56 | 3,4232 | 0,2583 |
Principales baisses ce trimestre
Nous utilisons la variation de l'allocation du portefeuille car il s'agit de l'indicateur le plus significatif. Les changements peuvent être dus à des transactions ou à des variations de prix des actions.
| Titre | Actions (en millions) |
Valeur ($ en millions) |
% du portefeuille | ΔPortefeuille % |
|---|---|---|---|---|
| 0,04 | 8,95 | 4,6737 | -1,0952 | |
| 0,01 | 8,47 | 4,4232 | -0,7095 | |
| 0,03 | 3,72 | 1,9424 | -0,3428 | |
| 0,02 | 3,49 | 1,8232 | -0,3077 | |
| 0,01 | 3,18 | 1,6592 | -0,3053 | |
| 0,01 | 2,70 | 1,4080 | -0,3005 | |
| 0,01 | 3,46 | 1,8044 | -0,2858 | |
| 0,02 | 3,51 | 1,8328 | -0,2834 | |
| 0,01 | 3,62 | 1,8911 | -0,2269 | |
| 0,01 | 4,80 | 2,5052 | -0,2088 |
Déclarations 13F et dépôts de fonds
Ce formulaire a été déposé le 2025-07-23 pour la période de déclaration 2025-06-30. Cliquez sur l'icône du lien pour voir l'historique complet des transactions.
Mettre à niveau pour débloquer les données premium et exporter vers Excel ![]() .
.
| Titre | Type | Prix moyen de l'action | Actions (en millions) |
ΔActions (%) |
ΔActions (%) |
Valeur ($ en millions) |
Portefeuille (%) |
ΔPortefeuille (%) |
|
|---|---|---|---|---|---|---|---|---|---|
| MSFT / Microsoft Corporation | 0,02 | 0,89 | 9,01 | 33,70 | 4,7024 | 0,7938 | |||
| AAPL / Apple Inc. | 0,04 | -2,53 | 8,95 | -9,97 | 4,6737 | -1,0952 | |||
| LLY / Eli Lilly and Company | 0,01 | 1,46 | 8,47 | -4,24 | 4,4232 | -0,7095 | |||
| AMZN / Amazon.com, Inc. | 0,03 | 2,49 | 7,66 | 18,18 | 3,9992 | 0,2391 | |||
| META / Meta Platforms, Inc. | 0,01 | 2,16 | 7,66 | 30,83 | 3,9980 | 0,6021 | |||
| JPM / JPMorgan Chase & Co. | 0,02 | 1,70 | 6,56 | 20,19 | 3,4232 | 0,2583 | |||
| GSCE / GS Connect S&P GSCI Enhanced Commodity Total Return ETN | 0,01 | 2,05 | 6,04 | 32,22 | 3,1525 | 0,5028 | |||
| GOOGL / Alphabet Inc. | 0,03 | 3,86 | 5,44 | 18,37 | 2,8397 | 0,1736 | |||
| INTU / Intuit Inc. | 0,01 | 1,69 | 5,32 | 30,43 | 2,7779 | 0,4115 | |||
| V / Visa Inc. | 0,01 | 1,24 | 4,80 | 2,57 | 2,5052 | -0,2088 | |||
| NOW / ServiceNow, Inc. | 0,00 | 2,03 | 4,75 | 31,74 | 2,4819 | 0,3887 | |||
| NVDA / NVIDIA Corporation | 0,03 | 65,81 | 4,50 | 141,80 | 2,3473 | 1,2682 | |||
| RTX / RTX Corporation | 0,03 | 2,43 | 4,42 | 12,90 | 2,3086 | 0,0368 | |||
| BX / Blackstone Inc. | 0,03 | 3,83 | 4,35 | 11,11 | 2,2724 | -0,0003 | |||
| KMI / Kinder Morgan, Inc. | 0,15 | 1,80 | 4,30 | 4,93 | 2,2460 | -0,1330 | |||
| BAC / Bank of America Corporation | 0,09 | 3,60 | 4,17 | 17,51 | 2,1766 | 0,1179 | |||
| WFC / Wells Fargo & Company | 0,05 | 2,93 | 4,05 | 14,89 | 2,1160 | 0,0692 | |||
| CSCO / Cisco Systems, Inc. | 0,06 | 3,95 | 3,92 | 16,87 | 2,0448 | 0,1006 | |||
| HD / The Home Depot, Inc. | 0,01 | 3,26 | 3,79 | 3,30 | 1,9799 | -0,1499 | |||
| XOM / Exxon Mobil Corporation | 0,03 | 4,20 | 3,72 | -5,56 | 1,9424 | -0,3428 | |||
| JNJ / Johnson & Johnson | 0,02 | 11,14 | 3,68 | 2,36 | 1,9237 | -0,1644 | |||
| CB / Chubb Limited | 0,01 | 3,42 | 3,62 | -0,79 | 1,8911 | -0,2269 | |||
| PG / The Procter & Gamble Company | 0,02 | 2,94 | 3,51 | -3,76 | 1,8328 | -0,2834 | |||
| CVX / Chevron Corporation | 0,02 | 11,07 | 3,49 | -4,93 | 1,8232 | -0,3077 | |||
| MCD / McDonald's Corporation | 0,01 | 2,56 | 3,46 | -4,08 | 1,8044 | -0,2858 | |||
| DKNG / DraftKings Inc. | 0,08 | 6,79 | 3,40 | 37,92 | 1,7761 | 0,3451 | |||
| CRM / Salesforce, Inc. | 0,01 | 4,36 | 3,32 | 6,06 | 1,7354 | -0,0831 | |||
| AMGN / Amgen Inc. | 0,01 | 4,72 | 3,18 | -6,14 | 1,6592 | -0,3053 | |||
| DIS / The Walt Disney Company | 0,03 | 7,03 | 3,12 | 34,50 | 1,6268 | 0,2825 | |||
| KO / The Coca-Cola Company | 0,04 | 3,86 | 2,91 | 2,58 | 1,5185 | -0,1261 | |||
| VZ / Verizon Communications Inc. | 0,07 | 3,64 | 2,90 | -1,13 | 1,5119 | -0,1874 | |||
| BHP / BHP Group Limited - Depositary Receipt (Common Stock) | 0,06 | 6,33 | 2,87 | 5,36 | 1,4984 | -0,0821 | |||
| NEE / NextEra Energy, Inc. | 0,04 | 9,84 | 2,76 | 7,60 | 1,4418 | -0,0476 | |||
| BA / The Boeing Company | 0,01 | 5,17 | 2,74 | 29,22 | 1,4322 | 0,2004 | |||
| SBUX / Starbucks Corporation | 0,03 | 8,09 | 2,70 | 0,97 | 1,4098 | -0,1417 | |||
| TMO / Thermo Fisher Scientific Inc. | 0,01 | 12,39 | 2,70 | -8,42 | 1,4080 | -0,3005 | |||
| O / Realty Income Corporation | 0,05 | 5,85 | 2,69 | 5,12 | 1,4052 | -0,0803 | |||
| UPS / United Parcel Service, Inc. | 0,03 | 21,65 | 2,65 | 11,65 | 1,3861 | 0,0065 | |||
| PFE / Pfizer Inc. | 0,10 | 16,93 | 2,51 | 11,86 | 1,3100 | 0,0086 | |||
| VEA / Vanguard Tax-Managed Funds - Vanguard FTSE Developed Markets ETF | 0,02 | 2,93 | 1,39 | 15,46 | 0,7257 | 0,0272 | |||
| VUG / Vanguard Index Funds - Vanguard Growth ETF | 0,00 | 2,63 | 1,34 | 21,36 | 0,6973 | 0,0587 | |||
| VTV / Vanguard Index Funds - Vanguard Value ETF | 0,01 | 4,15 | 1,07 | 6,61 | 0,5563 | -0,0238 | |||
| VB / Vanguard Index Funds - Vanguard Small-Cap ETF | 0,00 | 4,88 | 0,98 | 12,04 | 0,5105 | 0,0044 | |||
| IBM / International Business Machines Corporation | 0,00 | -5,79 | 0,83 | 11,64 | 0,4310 | 0,0022 | |||
| PM / Philip Morris International Inc. | 0,00 | -5,45 | 0,75 | 8,44 | 0,3894 | -0,0094 | |||
| VWO / Vanguard International Equity Index Funds - Vanguard FTSE Emerging Markets ETF | 0,01 | 4,13 | 0,74 | 13,87 | 0,3862 | 0,0091 | |||
| C / Citigroup Inc. | 0,01 | -5,59 | 0,72 | 13,15 | 0,3778 | 0,0070 | |||
| TXN / Texas Instruments Incorporated | 0,00 | 0,00 | 0,59 | 15,69 | 0,3081 | 0,0118 | |||
| CRWD / CrowdStrike Holdings, Inc. | 0,00 | 0,59 | 0,3072 | 0,3072 | |||||
| ETR / Entergy Corporation | 0,01 | -6,96 | 0,55 | -9,52 | 0,2879 | -0,0657 | |||
| GOOGL / Alphabet Inc. | 0,00 | -2,86 | 0,54 | 10,29 | 0,2804 | -0,0021 | |||
| LMT / Lockheed Martin Corporation | 0,00 | -4,26 | 0,53 | -0,75 | 0,2774 | -0,0331 | |||
| NOC / Northrop Grumman Corporation | 0,00 | -5,83 | 0,51 | -7,97 | 0,2655 | -0,0553 | |||
| AZN / AstraZeneca PLC - Depositary Receipt (Common Stock) | 0,01 | -3,99 | 0,49 | -8,77 | 0,2556 | -0,0555 | |||
| WMB / The Williams Companies, Inc. | 0,01 | -7,22 | 0,48 | -2,42 | 0,2528 | -0,0353 | |||
| AEP / American Electric Power Company, Inc. | 0,00 | -6,33 | 0,48 | -11,05 | 0,2527 | -0,0630 | |||
| HYG / iShares Trust - iShares iBoxx $ High Yield Corporate Bond ETF | 0,01 | 0,85 | 0,48 | 3,22 | 0,2513 | -0,0196 | |||
| SO / The Southern Company | 0,01 | -6,66 | 0,47 | -6,80 | 0,2435 | -0,0467 | |||
| TRP / TC Energy Corporation | 0,01 | -6,83 | 0,44 | -3,69 | 0,2323 | -0,0358 | |||
| UL / Unilever PLC - Depositary Receipt (Common Stock) | 0,01 | -6,43 | 0,44 | -3,96 | 0,2284 | -0,0356 | |||
| NVS / Novartis AG - Depositary Receipt (Common Stock) | 0,00 | -6,61 | 0,44 | 1,16 | 0,2277 | -0,0219 | |||
| CME / CME Group Inc. | 0,00 | -8,41 | 0,43 | -4,91 | 0,2227 | -0,0373 | |||
| TTE / TotalEnergies SE - Depositary Receipt (Common Stock) | 0,01 | -5,20 | 0,42 | -10,06 | 0,2196 | -0,0516 | |||
| T / AT&T Inc. | 0,01 | -5,62 | 0,42 | -3,46 | 0,2190 | -0,0330 | |||
| EMB / iShares Trust - iShares J.P. Morgan USD Emerging Markets Bond ETF | 0,00 | 0,18 | 0,41 | 2,50 | 0,2142 | -0,0182 | |||
| MO / Altria Group, Inc. | 0,01 | -8,23 | 0,41 | -10,33 | 0,2134 | -0,0511 | |||
| TSLA / Tesla, Inc. | 0,00 | -13,80 | 0,40 | 5,60 | 0,2072 | -0,0107 | |||
| MRK / Merck & Co., Inc. | 0,00 | 6,24 | 0,39 | -6,22 | 0,2047 | -0,0381 | |||
| BNS / The Bank of Nova Scotia | 0,01 | -7,69 | 0,39 | 7,50 | 0,2026 | -0,0067 | |||
| BMY / Bristol-Myers Squibb Company | 0,01 | -5,58 | 0,38 | -28,41 | 0,2004 | -0,1103 | |||
| SNY / Sanofi - Depositary Receipt (Common Stock) | 0,01 | -5,76 | 0,38 | -18,00 | 0,1977 | -0,0699 | |||
| VOD / Vodafone Group Public Limited Company - Depositary Receipt (Common Stock) | 0,03 | -6,50 | 0,36 | 6,27 | 0,1861 | -0,0083 | |||
| F / Ford Motor Company | 0,03 | -6,85 | 0,35 | 0,87 | 0,1819 | -0,0187 | |||
| DEO / Diageo plc - Depositary Receipt (Common Stock) | 0,00 | -12,70 | 0,34 | -15,92 | 0,1766 | -0,0570 | |||
| RIO / Rio Tinto Group - Depositary Receipt (Common Stock) | 0,00 | -7,89 | 0,29 | -10,49 | 0,1517 | -0,0368 | |||
| PLTR / Palantir Technologies Inc. | 0,00 | 0,27 | 0,1424 | 0,1424 | |||||
| KHC / The Kraft Heinz Company | 0,01 | -1,22 | 0,27 | -16,14 | 0,1385 | -0,0451 | |||
| VTI / Vanguard Index Funds - Vanguard Total Stock Market ETF | 0,00 | 6,27 | 0,26 | 17,35 | 0,1346 | 0,0073 | |||
| VXUS / Vanguard STAR Funds - Vanguard Total International Stock ETF | 0,00 | 2,06 | 0,25 | 13,36 | 0,1290 | 0,0028 | |||
| PEP / PepsiCo, Inc. | 0,00 | 0,00 | 0,21 | -12,02 | 0,1074 | -0,0281 | |||
| INTC / Intel Corporation | 0,00 | -100,00 | 0,00 | -100,00 | -0,0030 |