Statistiques de base
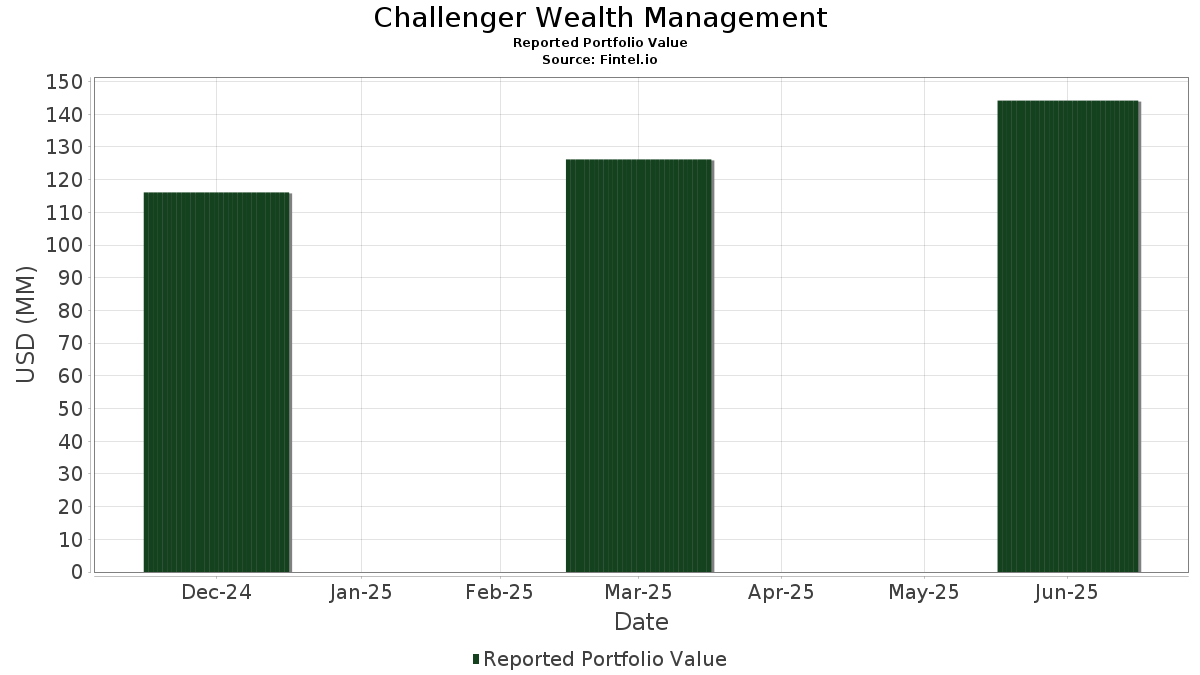
| Valeur du portefeuille | $ 144 195 890 |
| Positions actuelles | 109 |
Dernières positions, performances, ASG (à partir des dépôts 13F, 13D)
Challenger Wealth Management a déclaré un total de 109 positions dans ses derniers dépôts auprès de la SEC. La valeur la plus récente du portefeuille est calculée à 144 195 890 USD. Les actifs sous gestion réels (ASG) sont cette valeur plus les liquidités (qui ne sont pas divulguées). Les principales positions de Challenger Wealth Management sont Capital Group Dividend Value ETF (US:CGDV) , Capital Group Growth ETF (US:CGGR) , Capital Group Core Equity ETF (US:CGUS) , Ares Capital Corporation (US:ARCC) , and Apple Inc. (US:AAPL) . Les nouvelles positions de Challenger Wealth Management incluent General Electric Company (US:GE) , Royal Caribbean Cruises Ltd. (US:RCL) , Applied Materials, Inc. (US:AMAT) , Freeport-McMoRan Inc. (US:FCX) , and TC Energy Corporation (CA:TRP) .
Meilleures augmentations ce trimestre
Nous utilisons la variation de l'allocation du portefeuille car il s'agit de l'indicateur le plus significatif. Les changements peuvent être dus à des transactions ou à des variations de prix des actions.
| Titre | Actions (en millions) |
Valeur ($ en millions) |
% du portefeuille | ΔPortefeuille % |
|---|---|---|---|---|
| 0,43 | 17,63 | 12,2271 | 1,6395 | |
| 0,02 | 3,83 | 2,6564 | 1,2341 | |
| 0,01 | 2,28 | 1,5809 | 1,1161 | |
| 0,02 | 4,07 | 2,8217 | 0,6980 | |
| 0,48 | 19,06 | 13,2214 | 0,4330 | |
| 0,01 | 4,67 | 3,2353 | 0,3855 | |
| 0,01 | 1,30 | 0,9003 | 0,3397 | |
| 0,27 | 10,07 | 6,9816 | 0,2895 | |
| 0,00 | 0,39 | 0,2725 | 0,2725 | |
| 0,00 | 1,61 | 1,1142 | 0,2617 |
Principales baisses ce trimestre
Nous utilisons la variation de l'allocation du portefeuille car il s'agit de l'indicateur le plus significatif. Les changements peuvent être dus à des transactions ou à des variations de prix des actions.
| Titre | Actions (en millions) |
Valeur ($ en millions) |
% du portefeuille | ΔPortefeuille % |
|---|---|---|---|---|
| 0,02 | 4,80 | 3,3302 | -0,6075 | |
| 0,02 | 3,08 | 2,1335 | -0,5960 | |
| 0,00 | 0,29 | 0,2038 | -0,4250 | |
| 0,25 | 5,48 | 3,8024 | -0,3756 | |
| 0,01 | 2,19 | 1,5190 | -0,3466 | |
| 0,03 | 3,40 | 2,3552 | -0,3463 | |
| 0,11 | 3,65 | 2,5338 | -0,3218 | |
| 0,00 | 0,46 | 0,3217 | -0,3210 | |
| 0,01 | 1,66 | 1,1540 | -0,2125 | |
| 0,01 | 1,31 | 0,9104 | -0,1792 |
Déclarations 13F et dépôts de fonds
Ce formulaire a été déposé le 2025-08-14 pour la période de déclaration 2025-06-30. Cliquez sur l'icône du lien pour voir l'historique complet des transactions.
Mettre à niveau pour débloquer les données premium et exporter vers Excel ![]() .
.
| Titre | Type | Prix moyen de l'action | Actions (en millions) |
ΔActions (%) |
ΔActions (%) |
Valeur ($ en millions) |
Portefeuille (%) |
ΔPortefeuille (%) |
|
|---|---|---|---|---|---|---|---|---|---|
| CGDV / Capital Group Dividend Value ETF | 0,48 | 6,61 | 19,06 | 18,12 | 13,2214 | 0,4330 | |||
| CGGR / Capital Group Growth ETF | 0,43 | 11,18 | 17,63 | 31,96 | 12,2271 | 1,6395 | |||
| CGUS / Capital Group Core Equity ETF | 0,27 | 7,81 | 10,07 | 19,21 | 6,9816 | 0,2895 | |||
| ARCC / Ares Capital Corporation | 0,25 | 4,93 | 5,48 | 3,98 | 3,8024 | -0,3756 | |||
| AAPL / Apple Inc. | 0,02 | 4,62 | 4,80 | -3,38 | 3,3302 | -0,6075 | |||
| MSFT / Microsoft Corporation | 0,01 | -2,11 | 4,67 | 29,73 | 3,2353 | 0,3855 | |||
| TSLA / Tesla, Inc. | 0,01 | 0,69 | 4,46 | 23,43 | 3,0910 | 0,2294 | |||
| AMZN / Amazon.com, Inc. | 0,02 | 31,65 | 4,07 | 51,79 | 2,8217 | 0,6980 | |||
| NVDA / NVIDIA Corporation | 0,02 | 46,39 | 3,83 | 113,37 | 2,6564 | 1,2341 | |||
| CGBL / Capital Group Core Balanced ETF | 0,11 | -6,08 | 3,65 | 1,39 | 2,5338 | -0,3218 | |||
| XOM / Exxon Mobil Corporation | 0,03 | 9,90 | 3,40 | -0,38 | 2,3552 | -0,3463 | |||
| CVX / Chevron Corporation | 0,02 | 4,34 | 3,08 | -10,69 | 2,1335 | -0,5960 | |||
| COST / Costco Wholesale Corporation | 0,00 | 7,65 | 2,70 | 12,68 | 1,8739 | -0,0266 | |||
| V / Visa Inc. | 0,01 | 6,12 | 2,33 | 7,51 | 1,6176 | -0,1013 | |||
| AVGO / Broadcom Inc. | 0,01 | 136,02 | 2,28 | 288,91 | 1,5809 | 1,1161 | |||
| GOOGL / Alphabet Inc. | 0,01 | 7,50 | 2,20 | 22,49 | 1,5226 | 0,1025 | |||
| PG / The Procter & Gamble Company | 0,01 | -0,48 | 2,19 | -6,97 | 1,5190 | -0,3466 | |||
| ADP / Automatic Data Processing, Inc. | 0,01 | 12,89 | 1,82 | 13,98 | 1,2610 | -0,0035 | |||
| TMUS / T-Mobile US, Inc. | 0,01 | 8,01 | 1,66 | -3,54 | 1,1540 | -0,2125 | |||
| TT / Trane Technologies plc | 0,00 | 15,03 | 1,61 | 49,40 | 1,1142 | 0,2617 | |||
| MA / Mastercard Incorporated | 0,00 | -0,33 | 1,53 | 2,20 | 1,0613 | -0,1253 | |||
| HD / The Home Depot, Inc. | 0,00 | 1,29 | 1,47 | 1,31 | 1,0165 | -0,1297 | |||
| LMT / Lockheed Martin Corporation | 0,00 | 0,26 | 1,45 | 3,87 | 1,0048 | -0,0999 | |||
| DVY / iShares Trust - iShares Select Dividend ETF | 0,01 | -3,47 | 1,31 | -4,51 | 0,9104 | -0,1792 | |||
| TSM / Taiwan Semiconductor Manufacturing Company Limited - Depositary Receipt (Common Stock) | 0,01 | 34,49 | 1,30 | 83,59 | 0,9003 | 0,3397 | |||
| JPM / JPMorgan Chase & Co. | 0,00 | -0,20 | 1,29 | 18,01 | 0,8956 | 0,0281 | |||
| TJX / The TJX Companies, Inc. | 0,01 | 1,23 | 1,28 | 2,65 | 0,8866 | -0,1004 | |||
| DUK / Duke Energy Corporation | 0,01 | 0,45 | 1,17 | -2,83 | 0,8091 | -0,1423 | |||
| CTAS / Cintas Corporation | 0,00 | 3,07 | 1,11 | 11,75 | 0,7723 | -0,0172 | |||
| BRK.B / Berkshire Hathaway Inc. | 0,00 | -1,05 | 0,92 | -9,74 | 0,6364 | -0,1692 | |||
| META / Meta Platforms, Inc. | 0,00 | 2,18 | 0,90 | 30,86 | 0,6240 | 0,0793 | |||
| WMT / Walmart Inc. | 0,01 | -2,34 | 0,85 | 8,85 | 0,5889 | -0,0297 | |||
| HIG / The Hartford Insurance Group, Inc. | 0,01 | 0,56 | 0,84 | 3,08 | 0,5810 | -0,0628 | |||
| HCA / HCA Healthcare, Inc. | 0,00 | 0,24 | 0,80 | 11,31 | 0,5527 | -0,0154 | |||
| MPC / Marathon Petroleum Corporation | 0,00 | -5,80 | 0,77 | 7,53 | 0,5347 | -0,0342 | |||
| NOC / Northrop Grumman Corporation | 0,00 | 4,91 | 0,72 | 2,44 | 0,4964 | -0,0574 | |||
| OKE / ONEOK, Inc. | 0,01 | 0,71 | 0,67 | -17,12 | 0,4669 | -0,1770 | |||
| KO / The Coca-Cola Company | 0,01 | -0,11 | 0,67 | -1,32 | 0,4658 | -0,0735 | |||
| PWR / Quanta Services, Inc. | 0,00 | -2,28 | 0,66 | 45,39 | 0,4605 | 0,0986 | |||
| ASML / ASML Holding N.V. - Depositary Receipt (Common Stock) | 0,00 | -29,67 | 0,65 | -15,01 | 0,4518 | -0,1551 | |||
| CAT / Caterpillar Inc. | 0,00 | 0,44 | 0,62 | 18,22 | 0,4326 | 0,0145 | |||
| MET / MetLife, Inc. | 0,01 | -5,78 | 0,58 | -5,69 | 0,4027 | -0,0849 | |||
| ADBE / Adobe Inc. | 0,00 | -14,03 | 0,57 | -13,22 | 0,3963 | -0,1258 | |||
| CB / Chubb Limited | 0,00 | 5,63 | 0,55 | 1,28 | 0,3848 | -0,0490 | |||
| IBM / International Business Machines Corporation | 0,00 | 0,33 | 0,53 | 18,93 | 0,3707 | 0,0147 | |||
| WMB / The Williams Companies, Inc. | 0,01 | -1,49 | 0,52 | 3,59 | 0,3600 | -0,0373 | |||
| DE / Deere & Company | 0,00 | 0,00 | 0,51 | 8,32 | 0,3526 | -0,0193 | |||
| IVV / iShares Trust - iShares Core S&P 500 ETF | 0,00 | -10,06 | 0,49 | -0,61 | 0,3390 | -0,0505 | |||
| PH / Parker-Hannifin Corporation | 0,00 | -0,44 | 0,48 | 14,15 | 0,3307 | 0,0001 | |||
| UNH / UnitedHealth Group Incorporated | 0,00 | -4,00 | 0,46 | -42,91 | 0,3217 | -0,3210 | |||
| ING / ING Groep N.V. - Depositary Receipt (Common Stock) | 0,02 | 0,00 | 0,46 | 11,68 | 0,3185 | -0,0075 | |||
| PAYX / Paychex, Inc. | 0,00 | 0,45 | 0,46 | -5,19 | 0,3170 | -0,0654 | |||
| NET / Cloudflare, Inc. | 0,00 | 0,78 | 0,45 | 74,90 | 0,3148 | 0,1094 | |||
| MO / Altria Group, Inc. | 0,01 | 0,23 | 0,45 | -2,16 | 0,3144 | -0,0525 | |||
| DASH / DoorDash, Inc. | 0,00 | 0,74 | 0,43 | 36,05 | 0,3014 | 0,0480 | |||
| CNQ / Canadian Natural Resources Limited | 0,01 | -3,89 | 0,43 | -1,83 | 0,2982 | -0,0495 | |||
| COF / Capital One Financial Corporation | 0,00 | -0,50 | 0,43 | 18,06 | 0,2951 | 0,0095 | |||
| RTX / RTX Corporation | 0,00 | 1,90 | 0,41 | 12,47 | 0,2820 | -0,0048 | |||
| PHYS / Sprott Physical Gold Trust | 0,02 | 0,00 | 0,39 | 5,35 | 0,2738 | -0,0231 | |||
| GE / General Electric Company | 0,00 | 0,39 | 0,2725 | 0,2725 | |||||
| CEG / Constellation Energy Corporation | 0,00 | 0,33 | 0,39 | 61,00 | 0,2695 | 0,0778 | |||
| FLEX / Flex Ltd. | 0,01 | 0,00 | 0,37 | 50,81 | 0,2596 | 0,0631 | |||
| AJG / Arthur J. Gallagher & Co. | 0,00 | -8,06 | 0,37 | -14,81 | 0,2556 | -0,0871 | |||
| MCD / McDonald's Corporation | 0,00 | -10,41 | 0,36 | -16,32 | 0,2529 | -0,0920 | |||
| SONY / Sony Group Corporation - Depositary Receipt (Common Stock) | 0,01 | 0,00 | 0,35 | 2,63 | 0,2437 | -0,0279 | |||
| ROP / Roper Technologies, Inc. | 0,00 | -4,12 | 0,34 | -8,06 | 0,2378 | -0,0571 | |||
| CARR / Carrier Global Corporation | 0,00 | 0,74 | 0,34 | 16,49 | 0,2352 | 0,0041 | |||
| APD / Air Products and Chemicals, Inc. | 0,00 | 50,00 | 0,34 | 43,83 | 0,2347 | 0,0478 | |||
| MU / Micron Technology, Inc. | 0,00 | 0,65 | 0,32 | 43,11 | 0,2237 | 0,0447 | |||
| AIG / American International Group, Inc. | 0,00 | 0,00 | 0,32 | -1,56 | 0,2196 | -0,0353 | |||
| VZ / Verizon Communications Inc. | 0,01 | -3,22 | 0,31 | -7,72 | 0,2163 | -0,0514 | |||
| NFLX / Netflix, Inc. | 0,00 | 2,73 | 0,30 | 47,32 | 0,2099 | 0,0473 | |||
| TMO / Thermo Fisher Scientific Inc. | 0,00 | 3,09 | 0,30 | -15,82 | 0,2067 | -0,0743 | |||
| PGR / The Progressive Corporation | 0,00 | 0,82 | 0,30 | -5,14 | 0,2052 | -0,0414 | |||
| ACN / Accenture plc | 0,00 | -61,34 | 0,29 | -63,05 | 0,2038 | -0,4250 | |||
| XPO / XPO, Inc. | 0,00 | 0,26 | 0,29 | 17,67 | 0,2037 | 0,0059 | |||
| GM / General Motors Company | 0,01 | 0,32 | 0,29 | 5,05 | 0,2020 | -0,0179 | |||
| CMG / Chipotle Mexican Grill, Inc. | 0,01 | -11,84 | 0,28 | -1,41 | 0,1948 | -0,0310 | |||
| UNM / Unum Group | 0,00 | 0,09 | 0,28 | -0,71 | 0,1947 | -0,0295 | |||
| AFRM / Affirm Holdings, Inc. | 0,00 | 0,28 | 0,1928 | 0,1928 | |||||
| KMB / Kimberly-Clark Corporation | 0,00 | -0,97 | 0,28 | -10,36 | 0,1925 | -0,0526 | |||
| IP / International Paper Company | 0,01 | -0,03 | 0,27 | -12,46 | 0,1905 | -0,0576 | |||
| SHOP / Shopify Inc. | 0,00 | 0,27 | 0,1861 | 0,1861 | |||||
| HON / Honeywell International Inc. | 0,00 | 0,00 | 0,27 | 10,29 | 0,1861 | -0,0071 | |||
| URI / United Rentals, Inc. | 0,00 | 0,00 | 0,26 | 20,09 | 0,1829 | 0,0091 | |||
| EPD / Enterprise Products Partners L.P. - Limited Partnership | 0,01 | 0,27 | 0,26 | -9,09 | 0,1810 | -0,0460 | |||
| RCL / Royal Caribbean Cruises Ltd. | 0,00 | 0,26 | 0,1783 | 0,1783 | |||||
| AMAT / Applied Materials, Inc. | 0,00 | 0,25 | 0,1719 | 0,1719 | |||||
| CHTR / Charter Communications, Inc. | 0,00 | 0,67 | 0,25 | 11,31 | 0,1712 | -0,0040 | |||
| AVA / Avista Corporation | 0,01 | 0,00 | 0,25 | -9,56 | 0,1711 | -0,0446 | |||
| WFC / Wells Fargo & Company | 0,00 | 0,81 | 0,24 | 12,26 | 0,1655 | -0,0026 | |||
| GOOG / Alphabet Inc. | 0,00 | 3,97 | 0,24 | 18,00 | 0,1642 | 0,0052 | |||
| T / AT&T Inc. | 0,01 | -2,70 | 0,23 | -0,43 | 0,1612 | -0,0238 | |||
| CVE / Cenovus Energy Inc. | 0,02 | 0,48 | 0,23 | -1,69 | 0,1611 | -0,0263 | |||
| WELL / Welltower Inc. | 0,00 | 0,47 | 0,23 | 0,88 | 0,1588 | -0,0212 | |||
| FDX / FedEx Corporation | 0,00 | 0,00 | 0,23 | -6,58 | 0,1576 | -0,0355 | |||
| FCX / Freeport-McMoRan Inc. | 0,01 | 0,23 | 0,1572 | 0,1572 | |||||
| TRP / TC Energy Corporation | 0,00 | 0,22 | 0,1556 | 0,1556 | |||||
| TFII / TFI International Inc. | 0,00 | 0,22 | 0,1555 | 0,1555 | |||||
| LIN / Linde plc | 0,00 | -34,59 | 0,22 | -34,04 | 0,1519 | -0,1116 | |||
| AIZ / Assurant, Inc. | 0,00 | 0,00 | 0,22 | -5,65 | 0,1507 | -0,0322 | |||
| ODFL / Old Dominion Freight Line, Inc. | 0,00 | 0,53 | 0,22 | -1,38 | 0,1495 | -0,0238 | |||
| BA / The Boeing Company | 0,00 | 0,21 | 0,1484 | 0,1484 | |||||
| BURL / Burlington Stores, Inc. | 0,00 | 0,44 | 0,21 | -1,87 | 0,1458 | -0,0241 | |||
| IR / Ingersoll Rand Inc. | 0,00 | 0,68 | 0,21 | 4,50 | 0,1452 | -0,0133 | |||
| COP / ConocoPhillips | 0,00 | 0,09 | 0,21 | -14,52 | 0,1434 | -0,0482 | |||
| NOW / ServiceNow, Inc. | 0,00 | 0,21 | 0,1426 | 0,1426 | |||||
| ANET / Arista Networks Inc | 0,00 | 0,21 | 0,1425 | 0,1425 | |||||
| XEL / Xcel Energy Inc. | 0,00 | -25,07 | 0,20 | -27,92 | 0,1417 | -0,0829 | |||
| EPAM / EPAM Systems, Inc. | 0,00 | -100,00 | 0,00 | 0,0000 | |||||
| CRM / Salesforce, Inc. | 0,00 | -100,00 | 0,00 | 0,0000 | |||||
| UBER / Uber Technologies, Inc. | 0,00 | -100,00 | 0,00 | 0,0000 | |||||
| FI / Fiserv, Inc. | 0,00 | -100,00 | 0,00 | 0,0000 | |||||
| PYPL / PayPal Holdings, Inc. | 0,00 | -100,00 | 0,00 | 0,0000 | |||||
| ETR / Entergy Corporation | 0,00 | -100,00 | 0,00 | 0,0000 | |||||
| PEP / PepsiCo, Inc. | 0,00 | -100,00 | 0,00 | 0,0000 | |||||
| BKR / Baker Hughes Company | 0,00 | -100,00 | 0,00 | 0,0000 | |||||
| NXPI / NXP Semiconductors N.V. | 0,00 | -100,00 | 0,00 | 0,0000 | |||||
| SAIA / Saia, Inc. | 0,00 | -100,00 | 0,00 | 0,0000 | |||||
| FITB / Fifth Third Bancorp | 0,00 | -100,00 | 0,00 | 0,0000 |