Statistiques de base
| Valeur du portefeuille | $ 1 734 007 000 |
| Positions actuelles | 49 |
Dernières positions, performances, ASG (à partir des dépôts 13F, 13D)
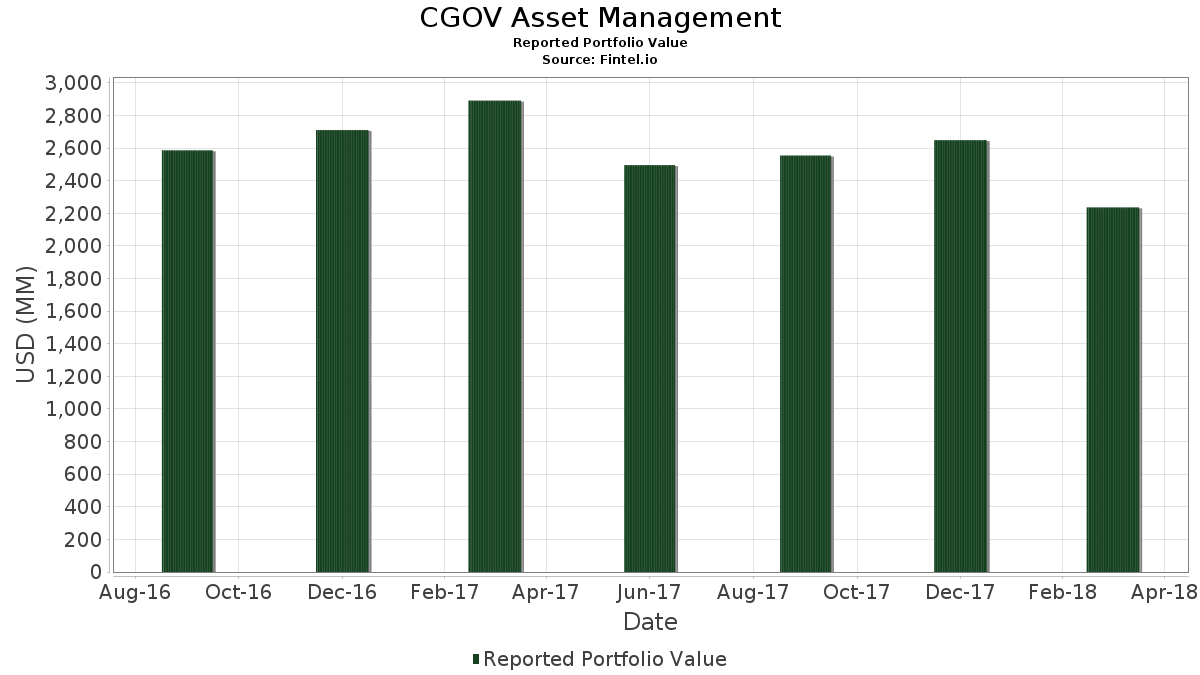
CGOV Asset Management a déclaré un total de 49 positions dans ses derniers dépôts auprès de la SEC. La valeur la plus récente du portefeuille est calculée à 1 734 007 000 USD. Les actifs sous gestion réels (ASG) sont cette valeur plus les liquidités (qui ne sont pas divulguées). Les principales positions de CGOV Asset Management sont The Toronto-Dominion Bank (US:TD) , Nutrien Ltd. (US:NTR) , Suncor Energy Inc. (US:SU) , Magna International Inc. (US:MGA) , and Enbridge Inc. (US:ENB) . Les nouvelles positions de CGOV Asset Management incluent Nutrien Ltd. (US:NTR) , Johnson & Johnson (US:JNJ) , .
Meilleures augmentations ce trimestre
Nous utilisons la variation de l'allocation du portefeuille car il s'agit de l'indicateur le plus significatif. Les changements peuvent être dus à des transactions ou à des variations de prix des actions.
| Titre | Actions (en millions) |
Valeur ($ en millions) |
% du portefeuille | ΔPortefeuille % |
|---|---|---|---|---|
| 3,11 | 176,25 | 10,1643 | 10,1643 | |
| 3,04 | 143,44 | 8,2722 | 8,2722 | |
| 2,20 | 123,75 | 7,1366 | 7,1366 | |
| 1,44 | 105,02 | 6,0563 | 6,0563 | |
| 1,63 | 100,32 | 5,7854 | 5,7854 | |
| 3,07 | 96,48 | 5,5642 | 5,5642 | |
| 4,48 | 83,41 | 4,8100 | 4,8100 | |
| 0,66 | 75,81 | 4,3720 | 4,3720 | |
| 0,62 | 74,45 | 4,2935 | 4,2935 | |
| 1,20 | 69,60 | 4,0136 | 4,0136 |
Principales baisses ce trimestre
Nous utilisons la variation de l'allocation du portefeuille car il s'agit de l'indicateur le plus significatif. Les changements peuvent être dus à des transactions ou à des variations de prix des actions.
| Titre | Actions (en millions) |
Valeur ($ en millions) |
% du portefeuille | ΔPortefeuille % |
|---|---|---|---|---|
| 0,00 | 0,00 | -7,8593 | ||
| 3,36 | 105,60 | 6,0900 | -0,4476 | |
| 0,28 | 49,34 | 2,8457 | -0,3361 | |
| 3,99 | 137,53 | 7,9315 | -0,2288 |
Déclarations 13F et dépôts de fonds
Ce formulaire a été déposé le 2018-04-10 pour la période de déclaration 2018-03-31. Cliquez sur l'icône du lien pour voir l'historique complet des transactions.
Mettre à niveau pour débloquer les données premium et exporter vers Excel ![]() .
.
| Titre | Type | Prix moyen de l'action | Actions (en millions) |
ΔActions (%) |
ΔActions (%) |
Valeur ($ en millions) |
Portefeuille (%) |
ΔPortefeuille (%) |
|
|---|---|---|---|---|---|---|---|---|---|
| TD / The Toronto-Dominion Bank | 3,11 | -5,79 | 176,25 | -27,47 | 10,1643 | 10,1643 | |||
| NTR / Nutrien Ltd. | 3,04 | 143,44 | 8,2722 | 8,2722 | |||||
| SU / Suncor Energy Inc. | 3,99 | -14,91 | 137,53 | -36,38 | 7,9315 | -0,2288 | |||
| MGA / Magna International Inc. | 2,20 | -10,27 | 123,75 | -29,11 | 7,1366 | 7,1366 | |||
| ENB / Enbridge Inc. | 3,36 | -4,62 | 105,60 | -39,03 | 6,0900 | -0,4476 | |||
| CNI / Canadian National Railway Company | 1,44 | 7,73 | 105,02 | -24,10 | 6,0563 | 6,0563 | |||
| BNS / The Bank of Nova Scotia | 1,63 | -1,28 | 100,32 | -25,10 | 5,7854 | 5,7854 | |||
| RBA / RB Global, Inc. | 3,07 | -38,66 | 96,48 | -48,80 | 5,5642 | 5,5642 | |||
| CAE / CAE Inc. | 4,48 | -4,20 | 83,41 | -23,70 | 4,8100 | 4,8100 | |||
| CBOE / Cboe Global Markets, Inc. | 0,66 | -7,86 | 75,81 | -32,58 | 4,3720 | 4,3720 | |||
| V / Visa Inc. | 0,62 | -12,33 | 74,45 | -26,52 | 4,2935 | 4,2935 | |||
| NVS / Novartis AG - Depositary Receipt (Common Stock) | 0,87 | -2,54 | 70,74 | -25,03 | 4,0798 | 0,5182 | |||
| SBUX / Starbucks Corporation | 1,20 | 5,08 | 69,60 | -15,38 | 4,0136 | 4,0136 | |||
| CVS / CVS Health Corporation | 1,07 | -1,12 | 66,28 | -32,22 | 3,8226 | 0,1313 | |||
| FMX / Fomento Económico Mexicano, S.A.B. de C.V. - Depositary Receipt (Common Stock) | 0,67 | -0,18 | 61,68 | -22,35 | 3,5573 | 0,5587 | |||
| ECL / Ecolab Inc. | 0,37 | -7,13 | 50,23 | -24,21 | 2,8970 | 0,3952 | |||
| CP / Canadian Pacific Kansas City Limited | 0,28 | -23,70 | 49,34 | -41,46 | 2,8457 | -0,3361 | |||
| TU / TELUS Corporation | 1,29 | -10,18 | 45,29 | -33,82 | 2,6116 | 2,6116 | |||
| UL / Unilever PLC - Depositary Receipt (Common Stock) | 0,76 | 0,70 | 42,16 | -19,23 | 2,4317 | 2,4317 | |||
| CSCO / Cisco Systems, Inc. | 0,40 | -42,35 | 17,00 | -48,42 | 0,9802 | 0,9802 | |||
| ZTS / Zoetis Inc. | 0,06 | -52,68 | 5,31 | -56,18 | 0,3062 | 0,3062 | |||
| FNV / Franco-Nevada Corporation | 0,05 | 20,18 | 3,73 | -17,89 | 0,2149 | 0,2149 | |||
| RY / Royal Bank of Canada | 0,04 | 8,79 | 3,46 | -18,20 | 0,1993 | 0,0398 | |||
| UNP / Union Pacific Corporation | 0,02 | -3,02 | 2,80 | -22,33 | 0,1616 | 0,1616 | |||
| SLB / Schlumberger Limited | 0,04 | -7,56 | 2,58 | -29,00 | 0,1485 | 0,0116 | |||
| BG / Bunge Global SA | 0,03 | 10,46 | 2,56 | -2,74 | 0,1474 | 0,1474 | |||
| LECO / Lincoln Electric Holdings, Inc. | 0,02 | -50,31 | 1,99 | -61,02 | 0,1148 | 0,1148 | |||
| DEO / Diageo plc - Depositary Receipt (Common Stock) | 0,01 | 10,33 | 1,91 | -18,29 | 0,1103 | 0,0219 | |||
| GOOG / Alphabet Inc. | 0,00 | 8,39 | 1,33 | -14,61 | 0,0769 | 0,0769 | |||
| CME / CME Group Inc. | 0,01 | 7,69 | 1,13 | -4,71 | 0,0653 | 0,0204 | |||
| DIS / The Walt Disney Company | 0,01 | 16,88 | 1,11 | -12,78 | 0,0641 | 0,0641 | |||
| CM / Canadian Imperial Bank of Commerce | 0,01 | -3,83 | 1,11 | -30,79 | 0,0639 | 0,0639 | |||
| THRM / Gentherm Incorporated | 0,03 | -16,65 | 1,00 | -28,76 | 0,0578 | 0,0578 | |||
| AAPL / Apple Inc. | 0,01 | 31,96 | 0,98 | 4,48 | 0,0565 | 0,0211 | |||
| WST / West Pharmaceutical Services, Inc. | 0,01 | 27,35 | 0,96 | -8,95 | 0,0551 | 0,0551 | |||
| MSGS / Madison Square Garden Sports Corp. | 0,00 | -12,79 | 0,92 | -18,77 | 0,0532 | 0,0532 | |||
| MPC / Marathon Petroleum Corporation | 0,01 | -8,33 | 0,80 | -18,87 | 0,0464 | 0,0464 | |||
| RSG / Republic Services, Inc. | 0,01 | 15,00 | 0,76 | -9,93 | 0,0439 | 0,0439 | |||
| MDLZ / Mondelez International, Inc. | 0,01 | -5,66 | 0,63 | -26,53 | 0,0361 | 0,0361 | |||
| BRK.B / Berkshire Hathaway Inc. | 0,00 | -9,23 | 0,59 | -27,05 | 0,0339 | 0,0339 | |||
| VT / Vanguard International Equity Index Funds - Vanguard Total World Stock ETF | 0,01 | -99,44 | 0,58 | -99,56 | 0,0332 | 0,0332 | |||
| ABT / Abbott Laboratories | 0,01 | -86,02 | 0,53 | -88,28 | 0,0307 | 0,0307 | |||
| SJRWF / Shaw Communications Inc. - Class A | 0,03 | 0,00 | 0,48 | -32,91 | 0,0277 | 0,0277 | |||
| CMP / Compass Minerals International, Inc. | 0,01 | 7,14 | 0,45 | -28,59 | 0,0261 | 0,0261 | |||
| BMO / Bank of Montreal | 0,01 | 0,00 | 0,44 | -24,91 | 0,0254 | 0,0254 | |||
| ORCL / Oracle Corporation | 0,01 | -53,20 | 0,43 | -63,78 | 0,0251 | 0,0251 | |||
| FCFS / FirstCash Holdings, Inc. | 0,01 | 0,00 | 0,41 | -3,99 | 0,0236 | 0,0236 | |||
| TRP / TC Energy Corporation | 0,01 | 50,15 | 0,34 | 1,50 | 0,0195 | 0,0195 | |||
| JNJ / Johnson & Johnson | 0,00 | 0,29 | 0,0170 | 0,0170 | |||||
| AGU / Agrium Inc. | 0,00 | -100,00 | 0,00 | -100,00 | -7,8593 | ||||
| PPL / Pembina Pipeline Corporation | 0,00 | -100,00 | 0,00 | -100,00 | 0,0000 | ||||
| BCE / BCE Inc. | 0,00 | -100,00 | 0,00 | -100,00 | 0,0000 |