Statistiques de base
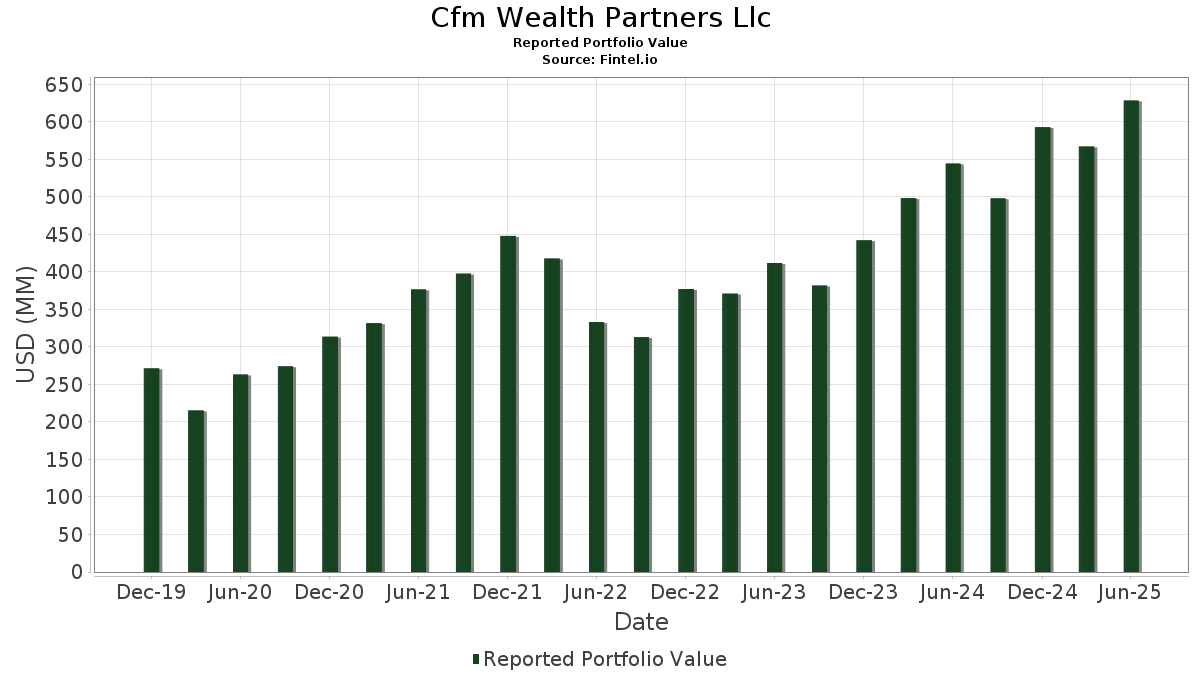
| Valeur du portefeuille | $ 628 337 824 |
| Positions actuelles | 141 |
Dernières positions, performances, ASG (à partir des dépôts 13F, 13D)
Cfm Wealth Partners Llc a déclaré un total de 141 positions dans ses derniers dépôts auprès de la SEC. La valeur la plus récente du portefeuille est calculée à 628 337 824 USD. Les actifs sous gestion réels (ASG) sont cette valeur plus les liquidités (qui ne sont pas divulguées). Les principales positions de Cfm Wealth Partners Llc sont NVIDIA Corporation (US:NVDA) , Apple Inc. (US:AAPL) , Microsoft Corporation (US:MSFT) , Amazon.com, Inc. (US:AMZN) , and Alphabet Inc. (US:GOOGL) . Les nouvelles positions de Cfm Wealth Partners Llc incluent Palantir Technologies Inc. (US:PLTR) , .
Meilleures augmentations ce trimestre
Nous utilisons la variation de l'allocation du portefeuille car il s'agit de l'indicateur le plus significatif. Les changements peuvent être dus à des transactions ou à des variations de prix des actions.
| Titre | Actions (en millions) |
Valeur ($ en millions) |
% du portefeuille | ΔPortefeuille % |
|---|---|---|---|---|
| 0,57 | 89,97 | 14,3185 | 3,3356 | |
| 0,05 | 25,09 | 3,9931 | 0,6699 | |
| 0,03 | 19,69 | 3,1334 | 0,5468 | |
| 0,01 | 8,80 | 1,4000 | 0,5315 | |
| 0,01 | 5,87 | 0,9338 | 0,3345 | |
| 0,01 | 5,80 | 0,9226 | 0,2572 | |
| 0,11 | 23,74 | 3,7781 | 0,2437 | |
| 0,01 | 2,00 | 0,3184 | 0,2101 | |
| 0,07 | 14,20 | 2,2607 | 0,1816 | |
| 0,13 | 23,69 | 3,7698 | 0,1517 |
Principales baisses ce trimestre
Nous utilisons la variation de l'allocation du portefeuille car il s'agit de l'indicateur le plus significatif. Les changements peuvent être dus à des transactions ou à des variations de prix des actions.
| Titre | Actions (en millions) |
Valeur ($ en millions) |
% du portefeuille | ΔPortefeuille % |
|---|---|---|---|---|
| 0,29 | 59,51 | 9,4716 | -2,0663 | |
| 0,13 | 13,50 | 2,1492 | -0,5180 | |
| 0,01 | 8,82 | 1,4031 | -0,4483 | |
| 0,14 | 12,40 | 1,9732 | -0,2909 | |
| 0,19 | 5,83 | 0,9276 | -0,2448 | |
| 0,26 | 0,68 | 0,1088 | -0,2045 | |
| 0,02 | 3,07 | 0,4892 | -0,1861 | |
| 0,05 | 16,13 | 2,5677 | -0,1822 | |
| 0,02 | 5,71 | 0,9081 | -0,1597 | |
| 0,02 | 4,27 | 0,6799 | -0,1551 |
Déclarations 13F et dépôts de fonds
Ce formulaire a été déposé le 2025-07-23 pour la période de déclaration 2025-06-30. Cliquez sur l'icône du lien pour voir l'historique complet des transactions.
Mettre à niveau pour débloquer les données premium et exporter vers Excel ![]() .
.
| Titre | Type | Prix moyen de l'action | Actions (en millions) |
ΔActions (%) |
ΔActions (%) |
Valeur ($ en millions) |
Portefeuille (%) |
ΔPortefeuille (%) |
|
|---|---|---|---|---|---|---|---|---|---|
| NVDA / NVIDIA Corporation | 0,57 | -0,90 | 89,97 | 44,46 | 14,3185 | 3,3356 | |||
| AAPL / Apple Inc. | 0,29 | -1,52 | 59,51 | -9,04 | 9,4716 | -2,0663 | |||
| MSFT / Microsoft Corporation | 0,05 | 0,48 | 25,09 | 33,15 | 3,9931 | 0,6699 | |||
| AMZN / Amazon.com, Inc. | 0,11 | 2,72 | 23,74 | 18,45 | 3,7781 | 0,2437 | |||
| GOOGL / Alphabet Inc. | 0,13 | 1,31 | 23,69 | 15,45 | 3,7698 | 0,1517 | |||
| META / Meta Platforms, Inc. | 0,03 | 4,82 | 19,69 | 34,23 | 3,1334 | 0,5468 | |||
| PM / Philip Morris International Inc. | 0,09 | 0,00 | 16,32 | 14,74 | 2,5980 | 0,0891 | |||
| V / Visa Inc. | 0,05 | 2,12 | 16,13 | 3,46 | 2,5677 | -0,1822 | |||
| PANW / Palo Alto Networks, Inc. | 0,07 | 0,47 | 14,20 | 20,49 | 2,2607 | 0,1816 | |||
| WMB / The Williams Companies, Inc. | 0,22 | 0,00 | 13,94 | 5,10 | 2,2193 | -0,1204 | |||
| XOM / Exxon Mobil Corporation | 0,13 | -1,49 | 13,50 | -10,71 | 2,1492 | -0,5180 | |||
| ORLY / O'Reilly Automotive, Inc. | 0,14 | 1 434,94 | 12,40 | -3,43 | 1,9732 | -0,2909 | |||
| COST / Costco Wholesale Corporation | 0,01 | 2,21 | 12,03 | 6,99 | 1,9143 | -0,0683 | |||
| CRM / Salesforce, Inc. | 0,04 | 1,63 | 11,78 | 3,28 | 1,8740 | -0,1367 | |||
| SPY / SPDR S&P 500 ETF | 0,02 | -1,17 | 10,47 | 9,16 | 1,6666 | -0,0251 | |||
| QQQ / Invesco QQQ Trust, Series 1 | 0,02 | 4,12 | 9,92 | 22,49 | 1,5783 | 0,1505 | |||
| JPM / JPMorgan Chase & Co. | 0,03 | 0,63 | 9,58 | 18,94 | 1,5244 | 0,1041 | |||
| LLY / Eli Lilly and Company | 0,01 | -11,03 | 8,82 | -16,02 | 1,4031 | -0,4483 | |||
| NFLX / Netflix, Inc. | 0,01 | 24,39 | 8,80 | 78,64 | 1,4000 | 0,5315 | |||
| MA / Mastercard Incorporated | 0,02 | 0,94 | 8,73 | 3,47 | 1,3894 | -0,0983 | |||
| IWF / iShares Trust - iShares Russell 1000 Growth ETF | 0,02 | 5,68 | 8,49 | 24,25 | 1,3520 | 0,1464 | |||
| GOOG / Alphabet Inc. | 0,05 | 0,00 | 8,11 | 13,55 | 1,2915 | 0,0312 | |||
| HD / The Home Depot, Inc. | 0,02 | 2,77 | 7,21 | 2,82 | 1,1480 | -0,0892 | |||
| IWD / iShares Trust - iShares Russell 1000 Value ETF | 0,04 | 2,77 | 7,14 | 6,08 | 1,1363 | -0,0505 | |||
| AMD / Advanced Micro Devices, Inc. | 0,05 | -7,80 | 6,43 | 27,36 | 1,0233 | 0,1329 | |||
| IWR / iShares Trust - iShares Russell Mid-Cap ETF | 0,07 | 1,33 | 6,41 | 9,55 | 1,0206 | -0,0117 | |||
| SHW / The Sherwin-Williams Company | 0,02 | 3,84 | 6,13 | 2,11 | 0,9759 | -0,0831 | |||
| CRWD / CrowdStrike Holdings, Inc. | 0,01 | 19,51 | 5,87 | 72,66 | 0,9338 | 0,3345 | |||
| EPD / Enterprise Products Partners L.P. - Limited Partnership | 0,19 | -3,49 | 5,83 | -12,33 | 0,9276 | -0,2448 | |||
| FFIN / First Financial Bankshares, Inc. | 0,16 | -2,73 | 5,82 | -2,56 | 0,9263 | -0,1272 | |||
| NOW / ServiceNow, Inc. | 0,01 | 18,97 | 5,80 | 53,64 | 0,9226 | 0,2572 | |||
| MCD / McDonald's Corporation | 0,02 | 0,75 | 5,71 | -5,75 | 0,9081 | -0,1597 | |||
| BRK.A / Berkshire Hathaway Inc. | 0,01 | 4,67 | 5,63 | -4,53 | 0,8958 | -0,1439 | |||
| USMV / iShares Trust - iShares MSCI USA Min Vol Factor ETF | 0,06 | 6,02 | 5,37 | 6,25 | 0,8547 | -0,0366 | |||
| CMG / Chipotle Mexican Grill, Inc. | 0,09 | -2,38 | 5,18 | 9,17 | 0,8247 | -0,0123 | |||
| WMT / Walmart Inc. | 0,05 | 3,83 | 5,11 | 15,62 | 0,8140 | 0,0341 | |||
| KO / The Coca-Cola Company | 0,07 | 1,23 | 4,88 | 0,00 | 0,7769 | -0,0839 | |||
| MO / Altria Group, Inc. | 0,08 | -0,97 | 4,83 | -3,26 | 0,7692 | -0,1119 | |||
| TJX / The TJX Companies, Inc. | 0,04 | 0,95 | 4,72 | 2,34 | 0,7519 | -0,0621 | |||
| VOO / Vanguard Index Funds - Vanguard S&P 500 ETF | 0,01 | 0,82 | 4,67 | 11,43 | 0,7432 | 0,0042 | |||
| ABBV / AbbVie Inc. | 0,02 | 1,84 | 4,27 | -9,80 | 0,6799 | -0,1551 | |||
| KKR / KKR & Co. Inc. | 0,03 | 10,37 | 4,14 | 27,02 | 0,6593 | 0,0841 | |||
| ET / Energy Transfer LP - Limited Partnership | 0,19 | -2,22 | 3,42 | -4,65 | 0,5449 | -0,0883 | |||
| QUAL / iShares Trust - iShares MSCI USA Quality Factor ETF | 0,02 | 11,65 | 3,28 | 19,46 | 0,5227 | 0,0378 | |||
| MDLZ / Mondelez International, Inc. | 0,05 | 0,00 | 3,18 | -0,59 | 0,5054 | -0,0580 | |||
| CVX / Chevron Corporation | 0,02 | -6,23 | 3,07 | -19,74 | 0,4892 | -0,1861 | |||
| RY / Royal Bank of Canada | 0,02 | 0,00 | 2,82 | 16,71 | 0,4481 | 0,0226 | |||
| AMAT / Applied Materials, Inc. | 0,01 | -1,20 | 2,69 | 24,66 | 0,4288 | 0,0476 | |||
| SPSM / SPDR Series Trust - SPDR Portfolio S&P 600 Small Cap ETF | 0,06 | -0,76 | 2,69 | 3,71 | 0,4278 | -0,0292 | |||
| IWB / iShares Trust - iShares Russell 1000 ETF | 0,01 | -0,54 | 2,43 | 10,08 | 0,3861 | -0,0025 | |||
| GSCE / GS Connect S&P GSCI Enhanced Commodity Total Return ETN | 0,00 | 2,04 | 2,38 | 32,20 | 0,3784 | 0,0612 | |||
| MPLX / MPLX LP - Limited Partnership | 0,04 | 0,00 | 2,21 | -3,75 | 0,3515 | -0,0532 | |||
| TSLA / Tesla, Inc. | 0,01 | -5,56 | 2,21 | 15,74 | 0,3512 | 0,0150 | |||
| USAC / USA Compression Partners, LP - Limited Partnership | 0,08 | 0,00 | 2,04 | -9,87 | 0,3242 | -0,0745 | |||
| ESGD / iShares Trust - iShares ESG Aware MSCI EAFE ETF | 0,02 | -8,28 | 2,02 | 0,20 | 0,3208 | -0,0341 | |||
| ASO / Academy Sports and Outdoors, Inc. | 0,04 | -8,70 | 2,00 | -10,34 | 0,3191 | -0,0751 | |||
| AVGO / Broadcom Inc. | 0,01 | 97,85 | 2,00 | 225,73 | 0,3184 | 0,2101 | |||
| SBLK / Star Bulk Carriers Corp. | 0,11 | 0,00 | 1,94 | 10,84 | 0,3091 | 0,0002 | |||
| CAT / Caterpillar Inc. | 0,00 | 0,00 | 1,88 | 17,69 | 0,2998 | 0,0176 | |||
| WES / Western Midstream Partners, LP - Limited Partnership | 0,04 | 0,00 | 1,74 | -5,49 | 0,2768 | -0,0478 | |||
| PWR / Quanta Services, Inc. | 0,00 | 0,00 | 1,71 | 48,78 | 0,2719 | 0,0693 | |||
| GJR / Strats Trust For Procter & Gambel Security - Preferred Security | 0,01 | 4,48 | 1,68 | -2,33 | 0,2669 | -0,0359 | |||
| HESM / Hess Midstream LP | 0,04 | 0,00 | 1,63 | -8,95 | 0,2590 | -0,0562 | |||
| MS / Morgan Stanley | 0,01 | 7,96 | 1,62 | 30,38 | 0,2576 | 0,0386 | |||
| FTAI / FTAI Aviation Ltd. | 0,01 | -2,24 | 1,47 | 1,31 | 0,2342 | -0,0220 | |||
| OKE / ONEOK, Inc. | 0,02 | -0,92 | 1,47 | -18,46 | 0,2341 | -0,0841 | |||
| SPG / Simon Property Group, Inc. | 0,01 | 11,23 | 1,40 | 7,61 | 0,2229 | -0,0065 | |||
| EQT / EQT Corporation | 0,02 | -0,38 | 1,29 | 8,71 | 0,2047 | -0,0039 | |||
| IVW / iShares Trust - iShares S&P 500 Growth ETF | 0,01 | -1,86 | 1,28 | 16,41 | 0,2032 | 0,0097 | |||
| PSX / Phillips 66 | 0,01 | 0,08 | 1,27 | -3,36 | 0,2015 | -0,0294 | |||
| EBGEF / Enbridge Inc. - Preferred Stock | 0,03 | 0,00 | 1,19 | 2,32 | 0,1894 | -0,0158 | |||
| TRGP / Targa Resources Corp. | 0,01 | 0,00 | 1,17 | -13,17 | 0,1859 | -0,0513 | |||
| EFA / iShares Trust - iShares MSCI EAFE ETF | 0,01 | 19,62 | 1,15 | 30,87 | 0,1829 | 0,0280 | |||
| TXN / Texas Instruments Incorporated | 0,01 | 0,00 | 1,14 | 15,56 | 0,1809 | 0,0074 | |||
| UNP / Union Pacific Corporation | 0,00 | 0,00 | 1,13 | -2,66 | 0,1804 | -0,0249 | |||
| ODFL / Old Dominion Freight Line, Inc. | 0,01 | 0,00 | 1,10 | -1,88 | 0,1744 | -0,0226 | |||
| COP / ConocoPhillips | 0,01 | -0,75 | 0,94 | -15,20 | 0,1491 | -0,0457 | |||
| SBUX / Starbucks Corporation | 0,01 | -14,87 | 0,89 | -20,50 | 0,1414 | -0,0556 | |||
| AMGN / Amgen Inc. | 0,00 | -2,93 | 0,86 | -13,03 | 0,1371 | -0,0375 | |||
| MRK / Merck & Co., Inc. | 0,01 | -26,66 | 0,83 | -35,34 | 0,1318 | -0,0940 | |||
| HCA / HCA Healthcare, Inc. | 0,00 | 0,00 | 0,74 | 10,79 | 0,1177 | 0,0001 | |||
| IVV / iShares Trust - iShares Core S&P 500 ETF | 0,00 | -2,85 | 0,72 | 7,45 | 0,1148 | -0,0036 | |||
| ABT / Abbott Laboratories | 0,01 | 0,00 | 0,70 | 2,64 | 0,1114 | -0,0090 | |||
| LUNG / Pulmonx Corporation | 0,26 | 0,00 | 0,68 | -61,54 | 0,1088 | -0,2045 | |||
| VZ / Verizon Communications Inc. | 0,02 | -6,64 | 0,68 | -10,99 | 0,1084 | -0,0265 | |||
| QCOM / QUALCOMM Incorporated | 0,00 | -39,57 | 0,64 | -37,32 | 0,1019 | -0,0783 | |||
| PEP / PepsiCo, Inc. | 0,00 | -1,38 | 0,61 | -13,09 | 0,0973 | -0,0268 | |||
| NAD / Nuveen Quality Municipal Income Fund | 0,05 | 0,00 | 0,58 | -2,04 | 0,0916 | -0,0120 | |||
| IYH / iShares Trust - iShares U.S. Healthcare ETF | 0,01 | 0,00 | 0,57 | -7,19 | 0,0904 | -0,0176 | |||
| PB / Prosperity Bancshares, Inc. | 0,01 | 0,00 | 0,57 | -1,57 | 0,0902 | -0,0114 | |||
| IBM / International Business Machines Corporation | 0,00 | 0,00 | 0,57 | 18,45 | 0,0901 | 0,0059 | |||
| KMI / Kinder Morgan, Inc. | 0,02 | 0,00 | 0,56 | 2,95 | 0,0889 | -0,0067 | |||
| CSCO / Cisco Systems, Inc. | 0,01 | 0,00 | 0,55 | 12,35 | 0,0870 | 0,0013 | |||
| IJH / iShares Trust - iShares Core S&P Mid-Cap ETF | 0,01 | 0,28 | 0,50 | 6,57 | 0,0801 | -0,0032 | |||
| IYF / iShares Trust - iShares U.S. Financials ETF | 0,00 | 0,00 | 0,50 | 7,10 | 0,0794 | -0,0027 | |||
| LOW / Lowe's Companies, Inc. | 0,00 | 0,00 | 0,50 | -4,81 | 0,0788 | -0,0130 | |||
| IYR / iShares Trust - iShares U.S. Real Estate ETF | 0,01 | 3,17 | 0,49 | 2,09 | 0,0780 | -0,0066 | |||
| LMT / Lockheed Martin Corporation | 0,00 | 0,00 | 0,45 | 3,65 | 0,0723 | -0,0050 | |||
| CRGY / Crescent Energy Company | 0,05 | 0,00 | 0,45 | -23,52 | 0,0720 | -0,0323 | |||
| ADP / Automatic Data Processing, Inc. | 0,00 | 0,00 | 0,45 | 0,89 | 0,0719 | -0,0070 | |||
| IJR / iShares Trust - iShares Core S&P Small-Cap ETF | 0,00 | -3,35 | 0,39 | 0,78 | 0,0622 | -0,0060 | |||
| T / AT&T Inc. | 0,01 | -2,08 | 0,39 | 0,26 | 0,0619 | -0,0066 | |||
| JNJ / Johnson & Johnson | 0,00 | -2,27 | 0,39 | -10,00 | 0,0617 | -0,0142 | |||
| PH / Parker-Hannifin Corporation | 0,00 | 0,00 | 0,38 | 14,85 | 0,0604 | 0,0022 | |||
| DELL / Dell Technologies Inc. | 0,00 | -0,61 | 0,38 | 33,69 | 0,0601 | 0,0103 | |||
| IGSB / iShares Trust - iShares 1-5 Year Investment Grade Corporate Bond ETF | 0,01 | 0,00 | 0,37 | 0,82 | 0,0591 | -0,0059 | |||
| BLK / BlackRock, Inc. | 0,00 | -2,23 | 0,37 | 8,55 | 0,0586 | -0,0013 | |||
| BAC / Bank of America Corporation | 0,01 | 0,00 | 0,36 | 13,21 | 0,0574 | 0,0013 | |||
| DVY / iShares Trust - iShares Select Dividend ETF | 0,00 | 0,00 | 0,36 | -1,11 | 0,0569 | -0,0069 | |||
| HDV / iShares Trust - iShares Core High Dividend ETF | 0,00 | 2,07 | 0,35 | -1,12 | 0,0562 | -0,0069 | |||
| PAA / Plains All American Pipeline, L.P. - Limited Partnership | 0,02 | 0,00 | 0,35 | -8,40 | 0,0555 | -0,0116 | |||
| DIS / The Walt Disney Company | 0,00 | 11,65 | 0,34 | 40,25 | 0,0539 | 0,0113 | |||
| PFE / Pfizer Inc. | 0,01 | -38,93 | 0,34 | -41,59 | 0,0537 | -0,0482 | |||
| LRCX / Lam Research Corporation | 0,00 | -40,42 | 0,33 | -20,33 | 0,0531 | -0,0206 | |||
| C / Citigroup Inc. | 0,00 | 0,00 | 0,33 | 19,71 | 0,0523 | 0,0040 | |||
| TGT / Target Corporation | 0,00 | 6,44 | 0,33 | 0,62 | 0,0519 | -0,0053 | |||
| APO / Apollo Global Management, Inc. | 0,00 | 0,09 | 0,31 | 3,64 | 0,0499 | -0,0034 | |||
| TSM / Taiwan Semiconductor Manufacturing Company Limited - Depositary Receipt (Common Stock) | 0,00 | 0,30 | 0,0471 | 0,0471 | |||||
| IYJ / iShares Trust - iShares U.S. Industrials ETF | 0,00 | 0,00 | 0,28 | 9,41 | 0,0445 | -0,0006 | |||
| ALLY / Ally Financial Inc. | 0,01 | 0,01 | 0,26 | 6,91 | 0,0420 | -0,0016 | |||
| ESGE / iShares, Inc. - iShares ESG Aware MSCI EM ETF | 0,01 | -11,48 | 0,26 | -0,76 | 0,0416 | -0,0049 | |||
| INTC / Intel Corporation | 0,01 | -4,30 | 0,26 | -5,82 | 0,0413 | -0,0072 | |||
| IWM / iShares Trust - iShares Russell 2000 ETF | 0,00 | 0,00 | 0,26 | 7,95 | 0,0412 | -0,0010 | |||
| FLOT / iShares Trust - iShares Floating Rate Bond ETF | 0,00 | 0,00 | 0,25 | 0,00 | 0,0394 | -0,0043 | |||
| NKE / NIKE, Inc. | 0,00 | -6,97 | 0,25 | 4,24 | 0,0392 | -0,0025 | |||
| FEZ / SPDR Index Shares Funds - SPDR EURO STOXX 50 ETF | 0,00 | -11,91 | 0,24 | -3,25 | 0,0379 | -0,0055 | |||
| GE / General Electric Company | 0,00 | -18,00 | 0,23 | 5,41 | 0,0373 | -0,0019 | |||
| PLTR / Palantir Technologies Inc. | 0,00 | 0,23 | 0,0372 | 0,0372 | |||||
| ORCL / Oracle Corporation | 0,00 | 0,23 | 0,0372 | 0,0372 | |||||
| WEC / WEC Energy Group, Inc. | 0,00 | -2,14 | 0,23 | -6,56 | 0,0364 | -0,0067 | |||
| ACN / Accenture plc | 0,00 | 0,00 | 0,22 | -4,31 | 0,0354 | -0,0056 | |||
| FTNT / Fortinet, Inc. | 0,00 | -8,58 | 0,22 | 0,45 | 0,0353 | -0,0037 | |||
| VTI / Vanguard Index Funds - Vanguard Total Stock Market ETF | 0,00 | 0,22 | 0,0350 | 0,0350 | |||||
| NOBL / ProShares Trust - ProShares S&P 500 Dividend Aristocrats ETF | 0,00 | 0,00 | 0,22 | -1,37 | 0,0345 | -0,0043 | |||
| CSX / CSX Corporation | 0,01 | -6,98 | 0,22 | 3,35 | 0,0344 | -0,0026 | |||
| WM / Waste Management, Inc. | 0,00 | 0,00 | 0,21 | -0,93 | 0,0341 | -0,0041 | |||
| SHEL / Shell plc - Depositary Receipt (Common Stock) | 0,00 | -10,31 | 0,21 | -13,82 | 0,0338 | -0,0097 | |||
| EMR / Emerson Electric Co. | 0,00 | -18,18 | 0,21 | -0,95 | 0,0334 | -0,0038 | |||
| ACWV / iShares, Inc. - iShares MSCI Global Min Vol Factor ETF | 0,00 | -18,98 | 0,20 | 1,00 | 0,0322 | -0,0277 | |||
| FANG / Diamondback Energy, Inc. | 0,00 | -75,84 | 0,20 | -79,23 | 0,0318 | -0,1381 | |||
| FIP / FTAI Infrastructure Inc. | 0,01 | -2,34 | 0,08 | 33,93 | 0,0120 | 0,0020 | |||
| HON / Honeywell International Inc. | 0,00 | -100,00 | 0,00 | 0,0000 | |||||
| BMY / Bristol-Myers Squibb Company | 0,00 | -100,00 | 0,00 | 0,0000 | |||||
| UNH / UnitedHealth Group Incorporated | 0,00 | -100,00 | 0,00 | 0,0000 |