Statistiques de base
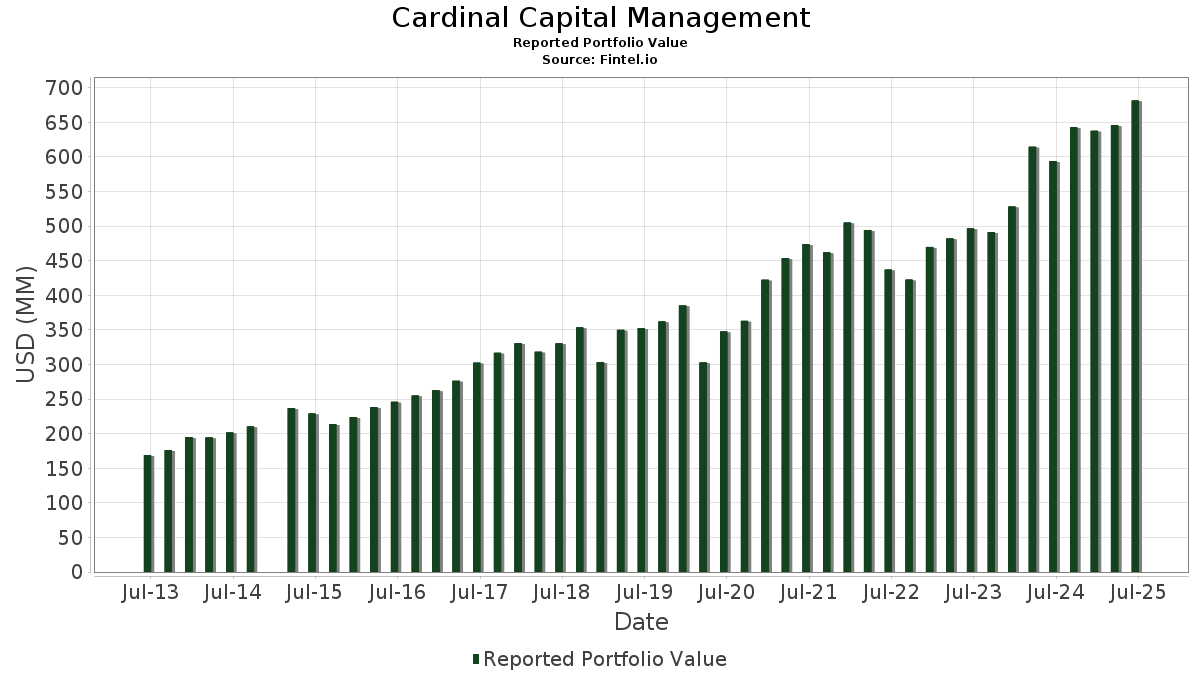
| Valeur du portefeuille | $ 681 390 360 |
| Positions actuelles | 128 |
Dernières positions, performances, ASG (à partir des dépôts 13F, 13D)
Cardinal Capital Management a déclaré un total de 128 positions dans ses derniers dépôts auprès de la SEC. La valeur la plus récente du portefeuille est calculée à 681 390 360 USD. Les actifs sous gestion réels (ASG) sont cette valeur plus les liquidités (qui ne sont pas divulguées). Les principales positions de Cardinal Capital Management sont Microsoft Corporation (US:MSFT) , Eli Lilly and Company (US:LLY) , Costco Wholesale Corporation (US:COST) , Apple Inc. (US:AAPL) , and Johnson & Johnson (US:JNJ) .
Meilleures augmentations ce trimestre
Nous utilisons la variation de l'allocation du portefeuille car il s'agit de l'indicateur le plus significatif. Les changements peuvent être dus à des transactions ou à des variations de prix des actions.
| Titre | Actions (en millions) |
Valeur ($ en millions) |
% du portefeuille | ΔPortefeuille % |
|---|---|---|---|---|
| 0,05 | 25,39 | 3,7262 | 0,7627 | |
| 0,06 | 17,34 | 2,5447 | 0,4399 | |
| 0,03 | 6,73 | 0,9872 | 0,3558 | |
| 0,01 | 5,81 | 0,8528 | 0,2641 | |
| 0,09 | 11,86 | 1,7406 | 0,2624 | |
| 0,04 | 13,06 | 1,9161 | 0,2248 | |
| 0,01 | 7,65 | 1,1231 | 0,2068 | |
| 0,10 | 7,22 | 1,0595 | 0,1977 | |
| 0,07 | 11,96 | 1,7546 | 0,1446 | |
| 0,09 | 5,60 | 0,8222 | 0,1436 |
Principales baisses ce trimestre
Nous utilisons la variation de l'allocation du portefeuille car il s'agit de l'indicateur le plus significatif. Les changements peuvent être dus à des transactions ou à des variations de prix des actions.
| Titre | Actions (en millions) |
Valeur ($ en millions) |
% du portefeuille | ΔPortefeuille % |
|---|---|---|---|---|
| 0,03 | 21,82 | 3,2026 | -0,3664 | |
| 0,12 | 17,86 | 2,6215 | -0,2843 | |
| 0,03 | 5,40 | 0,7923 | -0,2729 | |
| 0,11 | 12,36 | 1,8138 | -0,2666 | |
| 0,09 | 18,00 | 2,6418 | -0,2395 | |
| 0,10 | 4,68 | 0,6866 | -0,2358 | |
| 0,09 | 8,01 | 1,1755 | -0,2291 | |
| 0,01 | 3,50 | 0,5134 | -0,1822 | |
| 0,01 | 0,12 | 0,0172 | -0,1631 | |
| 0,13 | 6,81 | 0,9997 | -0,1599 |
Déclarations 13F et dépôts de fonds
Ce formulaire a été déposé le 2025-07-15 pour la période de déclaration 2025-06-30. Cliquez sur l'icône du lien pour voir l'historique complet des transactions.
Mettre à niveau pour débloquer les données premium et exporter vers Excel ![]() .
.
| Titre | Type | Prix moyen de l'action | Actions (en millions) |
ΔActions (%) |
ΔActions (%) |
Valeur ($ en millions) |
Portefeuille (%) |
ΔPortefeuille (%) |
|
|---|---|---|---|---|---|---|---|---|---|
| MSFT / Microsoft Corporation | 0,05 | 0,13 | 25,39 | 32,68 | 3,7262 | 0,7627 | |||
| LLY / Eli Lilly and Company | 0,03 | 0,32 | 21,82 | -5,31 | 3,2026 | -0,3664 | |||
| COST / Costco Wholesale Corporation | 0,02 | -1,68 | 20,87 | 2,91 | 3,0630 | -0,0776 | |||
| AAPL / Apple Inc. | 0,09 | 4,75 | 18,00 | -3,25 | 2,6418 | -0,2395 | |||
| JNJ / Johnson & Johnson | 0,12 | 3,36 | 17,86 | -4,80 | 2,6215 | -0,2843 | |||
| JPM / JPMorgan Chase & Co. | 0,06 | 7,95 | 17,34 | 27,58 | 2,5447 | 0,4399 | |||
| WMT / Walmart Inc. | 0,16 | -0,55 | 15,50 | 10,48 | 2,2746 | 0,1021 | |||
| DE / Deere & Company | 0,03 | 1,40 | 14,33 | 9,83 | 2,1025 | 0,0825 | |||
| ADP / Automatic Data Processing, Inc. | 0,04 | 1,16 | 13,31 | 2,10 | 1,9534 | -0,0654 | |||
| IBM / International Business Machines Corporation | 0,04 | 0,84 | 13,06 | 19,55 | 1,9161 | 0,2248 | |||
| BK / The Bank of New York Mellon Corporation | 0,14 | 0,82 | 12,88 | 9,52 | 1,8903 | 0,0690 | |||
| XOM / Exxon Mobil Corporation | 0,11 | 1,50 | 12,36 | -8,00 | 1,8138 | -0,2666 | |||
| GOOGL / Alphabet Inc. | 0,07 | 0,91 | 11,96 | 15,01 | 1,7546 | 0,1446 | |||
| EMR / Emerson Electric Co. | 0,09 | 2,18 | 11,86 | 24,25 | 1,7406 | 0,2624 | |||
| ECL / Ecolab Inc. | 0,04 | 1,74 | 11,56 | 8,11 | 1,6962 | 0,0406 | |||
| CSCO / Cisco Systems, Inc. | 0,16 | 1,61 | 10,88 | 14,24 | 1,5962 | 0,1217 | |||
| QCOM / QUALCOMM Incorporated | 0,07 | 2,53 | 10,84 | 6,29 | 1,5914 | 0,0116 | |||
| LOW / Lowe's Companies, Inc. | 0,05 | 2,35 | 10,66 | -2,63 | 1,5641 | -0,1310 | |||
| ITW / Illinois Tool Works Inc. | 0,04 | 2,33 | 10,62 | 2,02 | 1,5590 | -0,0536 | |||
| LH / Labcorp Holdings Inc. | 0,04 | 3,13 | 9,93 | 16,33 | 1,4577 | 0,1354 | |||
| PG / The Procter & Gamble Company | 0,06 | 2,04 | 9,03 | -4,62 | 1,3254 | -0,1408 | |||
| TFC / Truist Financial Corporation | 0,21 | 3,27 | 8,83 | 7,88 | 1,2954 | 0,0284 | |||
| A / Agilent Technologies, Inc. | 0,07 | 4,60 | 8,68 | 5,52 | 1,2740 | 0,0000 | |||
| NFG / National Fuel Gas Company | 0,10 | 3,03 | 8,42 | 10,21 | 1,2359 | 0,0524 | |||
| SAP / SAP SE - Depositary Receipt (Common Stock) | 0,03 | -0,28 | 8,28 | 12,96 | 1,2151 | 0,0801 | |||
| SBUX / Starbucks Corporation | 0,09 | 5,94 | 8,23 | -1,05 | 1,2078 | -0,0801 | |||
| MMM / 3M Company | 0,05 | 4,08 | 8,13 | 7,90 | 1,1926 | 0,0262 | |||
| COP / ConocoPhillips | 0,09 | 3,34 | 8,01 | -11,70 | 1,1755 | -0,2291 | |||
| IDXX / IDEXX Laboratories, Inc. | 0,01 | 1,27 | 7,65 | 29,34 | 1,1231 | 0,2068 | |||
| MKC / McCormick & Company, Incorporated | 0,10 | 3,78 | 7,60 | -4,42 | 1,1148 | -0,1158 | |||
| MRK / Merck & Co., Inc. | 0,09 | 5,63 | 7,42 | -6,73 | 1,0882 | -0,1431 | |||
| HAS / Hasbro, Inc. | 0,10 | 8,06 | 7,22 | 29,74 | 1,0595 | 0,1977 | |||
| MDT / Medtronic plc | 0,08 | 5,50 | 7,09 | 2,37 | 1,0411 | -0,0320 | |||
| CMI / Cummins Inc. | 0,02 | 2,28 | 7,04 | 6,86 | 1,0333 | 0,0130 | |||
| GIS / General Mills, Inc. | 0,13 | 4,99 | 6,81 | -9,03 | 0,9997 | -0,1599 | |||
| AGX / Argan, Inc. | 0,03 | -1,85 | 6,73 | 64,97 | 0,9872 | 0,3558 | |||
| TROW / T. Rowe Price Group, Inc. | 0,07 | 7,21 | 6,70 | 12,62 | 0,9835 | 0,0619 | |||
| KEYS / Keysight Technologies, Inc. | 0,04 | 1,93 | 6,50 | 11,53 | 0,9543 | 0,0513 | |||
| NVS / Novartis AG - Depositary Receipt (Common Stock) | 0,05 | 2,21 | 5,93 | 7,27 | 0,8704 | 0,0142 | |||
| STT / State Street Corporation | 0,06 | 1,75 | 5,89 | 20,85 | 0,8645 | 0,1097 | |||
| KO / The Coca-Cola Company | 0,08 | 1,07 | 5,86 | -0,15 | 0,8604 | -0,0488 | |||
| CW / Curtiss-Wright Corporation | 0,01 | -0,72 | 5,81 | 52,88 | 0,8528 | 0,2641 | |||
| USLM / United States Lime & Minerals, Inc. | 0,06 | -1,28 | 5,74 | 11,46 | 0,8421 | 0,0450 | |||
| ODC / Oil-Dri Corporation of America | 0,09 | -0,48 | 5,60 | 27,84 | 0,8222 | 0,1436 | |||
| FFIV / F5, Inc. | 0,02 | 0,68 | 5,45 | 11,28 | 0,7992 | 0,0414 | |||
| BMI / Badger Meter, Inc. | 0,02 | -0,41 | 5,44 | 28,22 | 0,7982 | 0,1413 | |||
| BDX / Becton, Dickinson and Company | 0,03 | 4,37 | 5,40 | -21,52 | 0,7923 | -0,2729 | |||
| RY / Royal Bank of Canada | 0,04 | 1,59 | 5,17 | 18,57 | 0,7592 | 0,0835 | |||
| RJF / Raymond James Financial, Inc. | 0,03 | 0,70 | 4,98 | 11,17 | 0,7302 | 0,0371 | |||
| VEEV / Veeva Systems Inc. | 0,02 | 2,44 | 4,73 | 27,37 | 0,6946 | 0,1191 | |||
| BMY / Bristol-Myers Squibb Company | 0,10 | 3,50 | 4,68 | -21,46 | 0,6866 | -0,2358 | |||
| REGN / Regeneron Pharmaceuticals, Inc. | 0,01 | 3,48 | 4,37 | -14,34 | 0,6407 | -0,1486 | |||
| PEP / PepsiCo, Inc. | 0,03 | 2,51 | 4,36 | -9,74 | 0,6395 | -0,1080 | |||
| MORN / Morningstar, Inc. | 0,01 | 12,31 | 4,35 | 17,60 | 0,6383 | 0,0655 | |||
| DXCM / DexCom, Inc. | 0,05 | 3,74 | 4,13 | 32,63 | 0,6056 | 0,1237 | |||
| BCPC / Balchem Corporation | 0,03 | 0,14 | 4,12 | -3,96 | 0,6046 | -0,0597 | |||
| TM / Toyota Motor Corporation - Depositary Receipt (Common Stock) | 0,02 | 2,68 | 4,09 | 0,20 | 0,6005 | -0,0319 | |||
| FDX / FedEx Corporation | 0,02 | 4,20 | 4,04 | -2,77 | 0,5923 | -0,0505 | |||
| SHEL / Shell plc - Depositary Receipt (Common Stock) | 0,06 | 1,49 | 4,00 | -2,49 | 0,5866 | -0,0482 | |||
| TDY / Teledyne Technologies Incorporated | 0,01 | 0,42 | 3,89 | 3,38 | 0,5708 | -0,0119 | |||
| CACI / CACI International Inc | 0,01 | -1,19 | 3,88 | 28,38 | 0,5691 | 0,1013 | |||
| ESLT / Elbit Systems Ltd. | 0,01 | -33,61 | 3,50 | -22,11 | 0,5134 | -0,1822 | |||
| SNA / Snap-on Incorporated | 0,01 | 1,12 | 3,47 | -6,61 | 0,5099 | -0,0663 | |||
| SNY / Sanofi - Depositary Receipt (Common Stock) | 0,07 | 2,95 | 3,43 | -10,30 | 0,5037 | -0,0890 | |||
| NVO / Novo Nordisk A/S - Depositary Receipt (Common Stock) | 0,05 | 2,40 | 3,42 | 0,15 | 0,5022 | -0,0269 | |||
| UTHR / United Therapeutics Corporation | 0,01 | 1,51 | 3,41 | -5,38 | 0,5008 | -0,0577 | |||
| MASI / Masimo Corporation | 0,02 | 1,86 | 3,40 | 2,84 | 0,4996 | -0,0130 | |||
| TD / The Toronto-Dominion Bank | 0,05 | 1,46 | 3,37 | 24,32 | 0,4945 | 0,0748 | |||
| LSTR / Landstar System, Inc. | 0,02 | 2,00 | 3,37 | -5,58 | 0,4944 | -0,0582 | |||
| PSX / Phillips 66 | 0,03 | 4,65 | 3,33 | 1,12 | 0,4890 | -0,0213 | |||
| BNS / The Bank of Nova Scotia | 0,06 | 4,64 | 3,32 | 21,97 | 0,4873 | 0,0656 | |||
| DLB / Dolby Laboratories, Inc. | 0,04 | 1,76 | 3,27 | -5,89 | 0,4804 | -0,0583 | |||
| IDCC / InterDigital, Inc. | 0,01 | -0,03 | 3,26 | 8,45 | 0,4783 | 0,0128 | |||
| HBAN / Huntington Bancshares Incorporated | 0,19 | 1,20 | 3,14 | 12,86 | 0,4612 | 0,0300 | |||
| JKHY / Jack Henry & Associates, Inc. | 0,02 | 0,16 | 3,09 | -1,18 | 0,4538 | -0,0307 | |||
| SR / Spire Inc. | 0,04 | 1,89 | 3,00 | -4,88 | 0,4408 | -0,0483 | |||
| WBS / Webster Financial Corporation | 0,05 | 2,64 | 2,90 | 8,71 | 0,4250 | 0,0125 | |||
| SYNA / Synaptics Incorporated | 0,04 | 5,62 | 2,84 | 7,41 | 0,4169 | 0,0074 | |||
| TTE / TotalEnergies SE - Depositary Receipt (Common Stock) | 0,04 | 2,14 | 2,74 | -2,84 | 0,4022 | -0,0346 | |||
| GOOG / Alphabet Inc. | 0,01 | 0,89 | 2,62 | 14,54 | 0,3850 | 0,0303 | |||
| GGG / Graco Inc. | 0,03 | -0,88 | 2,59 | 2,01 | 0,3804 | -0,0130 | |||
| BSAC / Banco Santander-Chile - Depositary Receipt (Common Stock) | 0,10 | 0,88 | 2,52 | 11,60 | 0,3700 | 0,0201 | |||
| UL / Unilever PLC - Depositary Receipt (Common Stock) | 0,04 | 2,33 | 2,50 | 5,09 | 0,3670 | -0,0014 | |||
| PAHC / Phibro Animal Health Corporation | 0,10 | 28,83 | 2,47 | 54,06 | 0,3622 | 0,1141 | |||
| UPS / United Parcel Service, Inc. | 0,02 | 2,25 | 2,44 | -6,15 | 0,3583 | -0,0446 | |||
| CRUS / Cirrus Logic, Inc. | 0,02 | 0,04 | 2,44 | 4,63 | 0,3581 | -0,0030 | |||
| LNN / Lindsay Corporation | 0,02 | -1,04 | 2,39 | 12,84 | 0,3510 | 0,0227 | |||
| GSK / GSK plc - Depositary Receipt (Common Stock) | 0,06 | 2,72 | 2,34 | 1,88 | 0,3428 | -0,0122 | |||
| DD / DuPont de Nemours, Inc. | 0,03 | 6,29 | 2,33 | -2,35 | 0,3417 | -0,0276 | |||
| CFR / Cullen/Frost Bankers, Inc. | 0,02 | 0,46 | 2,29 | 3,15 | 0,3362 | -0,0078 | |||
| OZK / Bank OZK | 0,05 | -0,94 | 2,27 | 7,29 | 0,3327 | 0,0055 | |||
| UNB / Union Bankshares, Inc. | 0,08 | 2,14 | 2,25 | -13,60 | 0,3302 | -0,0731 | |||
| FNB / F.N.B. Corporation | 0,14 | 1,19 | 2,05 | 9,68 | 0,3009 | 0,0114 | |||
| CTVA / Corteva, Inc. | 0,03 | 1,94 | 2,01 | 20,76 | 0,2946 | 0,0371 | |||
| KE / Kimball Electronics, Inc. | 0,10 | 1,66 | 1,93 | 18,81 | 0,2838 | 0,0318 | |||
| VC / Visteon Corporation | 0,02 | 0,70 | 1,87 | 21,03 | 0,2738 | 0,0351 | |||
| CHKP / Check Point Software Technologies Ltd. | 0,01 | 0,79 | 1,84 | -2,18 | 0,2699 | -0,0212 | |||
| NXPI / NXP Semiconductors N.V. | 0,01 | 1,58 | 1,82 | 16,70 | 0,2677 | 0,0256 | |||
| SAM / The Boston Beer Company, Inc. | 0,01 | 21,54 | 1,82 | -2,88 | 0,2669 | -0,0231 | |||
| PLPC / Preformed Line Products Company | 0,01 | 2,46 | 1,82 | 16,85 | 0,2668 | 0,0259 | |||
| WLY / John Wiley & Sons, Inc. | 0,04 | 1,90 | 1,74 | 2,06 | 0,2547 | -0,0086 | |||
| WOR / Worthington Enterprises, Inc. | 0,03 | 2,03 | 1,73 | 29,59 | 0,2540 | 0,0472 | |||
| LZB / La-Z-Boy Incorporated | 0,05 | 1,70 | 1,71 | -3,29 | 0,2506 | -0,0228 | |||
| ALC / Alcon Inc. | 0,02 | 6,67 | 1,70 | -0,82 | 0,2494 | -0,0159 | |||
| HUBG / Hub Group, Inc. | 0,05 | 1,87 | 1,65 | -8,37 | 0,2428 | -0,0368 | |||
| CRL / Charles River Laboratories International, Inc. | 0,01 | 1,37 | 1,65 | 2,17 | 0,2421 | -0,0079 | |||
| RHI / Robert Half Inc. | 0,04 | 3,20 | 1,64 | -22,35 | 0,2402 | -0,0862 | |||
| OLED / Universal Display Corporation | 0,01 | 3,05 | 1,61 | 14,10 | 0,2364 | 0,0178 | |||
| HAE / Haemonetics Corporation | 0,02 | 3,30 | 1,53 | 21,29 | 0,2241 | 0,0291 | |||
| IT / Gartner, Inc. | 0,00 | 1,40 | 1,52 | -2,37 | 0,2235 | -0,0180 | |||
| JAZZ / Jazz Pharmaceuticals plc | 0,01 | 5,61 | 1,49 | -9,73 | 0,2180 | -0,0368 | |||
| GNTX / Gentex Corporation | 0,07 | -6,49 | 1,46 | -11,76 | 0,2138 | -0,0418 | |||
| ALRM / Alarm.com Holdings, Inc. | 0,03 | 2,69 | 1,45 | 4,38 | 0,2135 | -0,0023 | |||
| MIDD / The Middleby Corporation | 0,01 | 2,40 | 1,45 | -3,01 | 0,2129 | -0,0187 | |||
| SEE / Sealed Air Corporation | 0,05 | 3,00 | 1,45 | 10,61 | 0,2128 | 0,0097 | |||
| IIIN / Insteel Industries, Inc. | 0,04 | 2,81 | 1,45 | 45,48 | 0,2127 | 0,0584 | |||
| MHK / Mohawk Industries, Inc. | 0,01 | 1,71 | 1,44 | -6,62 | 0,2112 | -0,0274 | |||
| UTMD / Utah Medical Products, Inc. | 0,02 | 4,17 | 1,30 | 5,76 | 0,1913 | 0,0005 | |||
| OFLX / Omega Flex, Inc. | 0,04 | 44,97 | 1,27 | 36,33 | 0,1868 | 0,0423 | |||
| TMP / Tompkins Financial Corporation | 0,02 | 4,45 | 1,21 | 4,03 | 0,1780 | -0,0025 | |||
| NVEC / NVE Corporation | 0,02 | 4,67 | 1,15 | 20,84 | 0,1694 | 0,0215 | |||
| HSIC / Henry Schein, Inc. | 0,02 | 2,68 | 1,11 | 9,58 | 0,1628 | 0,0059 | |||
| IGSB / iShares Trust - iShares 1-5 Year Investment Grade Corporate Bond ETF | 0,02 | 0,00 | 0,81 | 0,75 | 0,1188 | -0,0056 | |||
| WS / Worthington Steel, Inc. | 0,02 | 2,67 | 0,49 | 20,88 | 0,0722 | 0,0092 | |||
| HLN / Haleon plc - Depositary Receipt (Common Stock) | 0,05 | 1,13 | 0,49 | 2,10 | 0,0715 | -0,0025 | |||
| SPY / SPDR S&P 500 ETF | 0,00 | 1,10 | 0,34 | 11,76 | 0,0503 | 0,0028 | |||
| INTC / Intel Corporation | 0,01 | 0,05 | 0,26 | -1,14 | 0,0384 | -0,0027 | |||
| AMCR / Amcor plc | 0,01 | -89,36 | 0,12 | -89,95 | 0,0172 | -0,1631 | |||
| DOW / Dow Inc. | 0,00 | -100,00 | 0,00 | 0,0000 | |||||
| BA / The Boeing Company | 0,00 | -100,00 | 0,00 | 0,0000 | |||||
| HLIO / Helios Technologies, Inc. | 0,00 | -100,00 | 0,00 | 0,0000 | |||||
| PFE / Pfizer Inc. | 0,00 | -100,00 | 0,00 | 0,0000 |