Statistiques de base
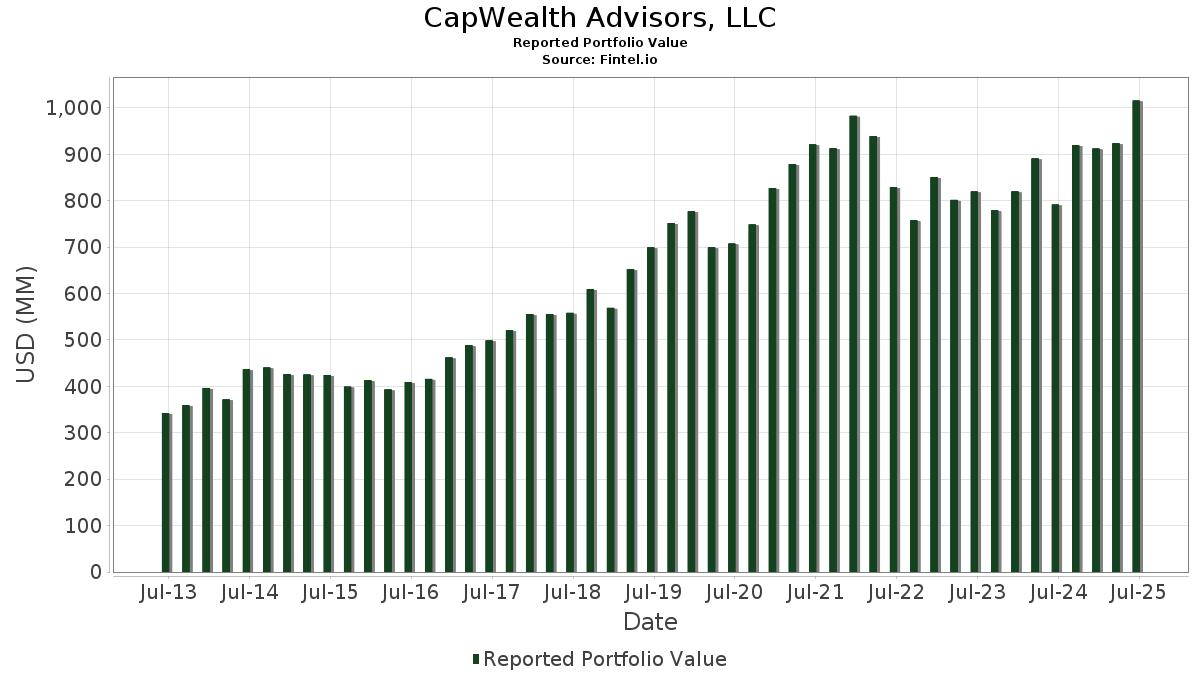
| Valeur du portefeuille | $ 1 015 750 658 |
| Positions actuelles | 103 |
Dernières positions, performances, ASG (à partir des dépôts 13F, 13D)
CapWealth Advisors, LLC a déclaré un total de 103 positions dans ses derniers dépôts auprès de la SEC. La valeur la plus récente du portefeuille est calculée à 1 015 750 658 USD. Les actifs sous gestion réels (ASG) sont cette valeur plus les liquidités (qui ne sont pas divulguées). Les principales positions de CapWealth Advisors, LLC sont Palantir Technologies Inc. (US:PLTR) , The Williams Companies, Inc. (US:WMB) , Microsoft Corporation (US:MSFT) , Berkshire Hathaway Inc. (US:BRK.B) , and International Business Machines Corporation (US:IBM) . Les nouvelles positions de CapWealth Advisors, LLC incluent Constellation Energy Corporation (US:CEG) , DocuSign, Inc. (US:DOCU) , SPDR S&P 500 ETF (US:SPY) , Invesco Exchange-Traded Self-Indexed Fund Trust - Invesco BulletShares 2025 Corporate Bond ETF (US:BSCP) , and .
Meilleures augmentations ce trimestre
Nous utilisons la variation de l'allocation du portefeuille car il s'agit de l'indicateur le plus significatif. Les changements peuvent être dus à des transactions ou à des variations de prix des actions.
| Titre | Actions (en millions) |
Valeur ($ en millions) |
% du portefeuille | ΔPortefeuille % |
|---|---|---|---|---|
| 0,05 | 17,57 | 1,7294 | 1,7294 | |
| 0,41 | 55,87 | 5,5000 | 1,6881 | |
| 0,26 | 18,14 | 1,7860 | 1,3398 | |
| 0,08 | 17,80 | 1,7528 | 1,2294 | |
| 0,05 | 25,40 | 2,5004 | 0,8985 | |
| 0,20 | 19,89 | 1,9581 | 0,8197 | |
| 0,09 | 46,11 | 4,5399 | 0,7603 | |
| 0,08 | 6,06 | 0,5968 | 0,5968 | |
| 0,12 | 12,86 | 1,2659 | 0,5505 | |
| 0,11 | 25,32 | 2,4926 | 0,4734 |
Principales baisses ce trimestre
Nous utilisons la variation de l'allocation du portefeuille car il s'agit de l'indicateur le plus significatif. Les changements peuvent être dus à des transactions ou à des variations de prix des actions.
| Titre | Actions (en millions) |
Valeur ($ en millions) |
% du portefeuille | ΔPortefeuille % |
|---|---|---|---|---|
| 0,08 | 40,42 | 3,9792 | -1,6647 | |
| 0,17 | 24,90 | 2,4511 | -1,2502 | |
| 0,81 | 21,51 | 2,1179 | -1,0980 | |
| 0,14 | 21,22 | 2,0892 | -0,5338 | |
| 0,33 | 22,54 | 2,2195 | -0,4349 | |
| 0,20 | 28,69 | 2,8240 | -0,3358 | |
| 0,11 | 14,99 | 1,4754 | -0,3325 | |
| 0,08 | 15,72 | 1,5474 | -0,3284 | |
| 0,25 | 28,04 | 2,7607 | -0,3238 | |
| 0,79 | 49,91 | 4,9136 | -0,2820 |
Déclarations 13F et dépôts de fonds
Ce formulaire a été déposé le 2025-07-29 pour la période de déclaration 2025-06-30. Cliquez sur l'icône du lien pour voir l'historique complet des transactions.
Mettre à niveau pour débloquer les données premium et exporter vers Excel ![]() .
.
| Titre | Type | Prix moyen de l'action | Actions (en millions) |
ΔActions (%) |
ΔActions (%) |
Valeur ($ en millions) |
Portefeuille (%) |
ΔPortefeuille (%) |
|
|---|---|---|---|---|---|---|---|---|---|
| PLTR / Palantir Technologies Inc. | 0,41 | -1,75 | 55,87 | 58,68 | 5,5000 | 1,6881 | |||
| WMB / The Williams Companies, Inc. | 0,79 | -1,04 | 49,91 | 4,01 | 4,9136 | -0,2820 | |||
| MSFT / Microsoft Corporation | 0,09 | -0,30 | 46,11 | 32,10 | 4,5399 | 0,7603 | |||
| BRK.B / Berkshire Hathaway Inc. | 0,08 | -14,99 | 40,42 | -22,46 | 3,9792 | -1,6647 | |||
| IBM / International Business Machines Corporation | 0,13 | -1,86 | 38,27 | 16,34 | 3,7674 | 0,2058 | |||
| CVX / Chevron Corporation | 0,20 | 14,84 | 28,69 | -1,71 | 2,8240 | -0,3358 | |||
| GILD / Gilead Sciences, Inc. | 0,25 | -0,52 | 28,04 | -1,57 | 2,7607 | -0,3238 | |||
| GE / General Electric Company | 0,10 | -0,72 | 26,69 | 27,68 | 2,6279 | 0,3642 | |||
| NFLX / Netflix, Inc. | 0,02 | -27,81 | 26,53 | 3,66 | 2,6123 | -0,1592 | |||
| BAC / Bank of America Corporation | 0,55 | -0,20 | 26,16 | 13,17 | 2,5752 | 0,0725 | |||
| MRK / Merck & Co., Inc. | 0,33 | 41,31 | 25,77 | 24,62 | 2,5369 | 0,2981 | |||
| GEV / GE Vernova Inc. | 0,05 | -0,96 | 25,40 | 71,67 | 2,5004 | 0,8985 | |||
| TSM / Taiwan Semiconductor Manufacturing Company Limited - Depositary Receipt (Common Stock) | 0,11 | -0,50 | 25,32 | 35,77 | 2,4926 | 0,4734 | |||
| GLW / Corning Incorporated | 0,48 | 2,13 | 25,01 | 17,32 | 2,4621 | 0,1540 | |||
| RTX / RTX Corporation | 0,17 | -33,93 | 24,90 | -27,17 | 2,4511 | -1,2502 | |||
| DUK / Duke Energy Corporation | 0,21 | 7,84 | 24,60 | 4,33 | 2,4216 | -0,1311 | |||
| CVS / CVS Health Corporation | 0,33 | -9,68 | 22,54 | -8,04 | 2,2195 | -0,4349 | |||
| DOW / Dow Inc. | 0,81 | -4,48 | 21,51 | -27,57 | 2,1179 | -1,0980 | |||
| JNJ / Johnson & Johnson | 0,14 | -4,90 | 21,22 | -12,40 | 2,0892 | -0,5338 | |||
| DHI / D.R. Horton, Inc. | 0,16 | -0,14 | 20,71 | 1,26 | 2,0386 | -0,1755 | |||
| UPS / United Parcel Service, Inc. | 0,20 | 106,13 | 19,89 | 89,17 | 1,9581 | 0,8197 | |||
| AMZN / Amazon.com, Inc. | 0,09 | 0,98 | 19,75 | 16,44 | 1,9447 | 0,1079 | |||
| EQIX / Equinix, Inc. | 0,02 | 1,08 | 19,42 | -1,38 | 1,9116 | -0,2203 | |||
| LUMN / Lumen Technologies, Inc. | 4,39 | 8,52 | 19,23 | 21,25 | 1,8934 | 0,1760 | |||
| NEE / NextEra Energy, Inc. | 0,26 | 349,51 | 18,14 | 340,21 | 1,7860 | 1,3398 | |||
| ORCL / Oracle Corporation | 0,08 | 135,51 | 17,80 | 268,31 | 1,7528 | 1,2294 | |||
| CEG / Constellation Energy Corporation | 0,05 | 17,57 | 1,7294 | 1,7294 | |||||
| VZ / Verizon Communications Inc. | 0,40 | 3,59 | 17,17 | -1,19 | 1,6909 | -0,1911 | |||
| AAPL / Apple Inc. | 0,08 | -1,78 | 15,72 | -9,28 | 1,5474 | -0,3284 | |||
| PEP / PepsiCo, Inc. | 0,11 | 1,92 | 14,99 | -10,25 | 1,4754 | -0,3325 | |||
| HON / Honeywell International Inc. | 0,06 | 2,05 | 14,76 | 12,24 | 1,4526 | 0,0292 | |||
| SONY / Sony Group Corporation - Depositary Receipt (Common Stock) | 0,57 | 1,27 | 14,75 | 3,82 | 1,4518 | -0,0861 | |||
| KO / The Coca-Cola Company | 0,19 | 0,65 | 13,23 | -0,57 | 1,3023 | -0,1383 | |||
| FTNT / Fortinet, Inc. | 0,12 | 77,20 | 12,86 | 94,64 | 1,2659 | 0,5505 | |||
| BIL / SPDR Series Trust - SPDR Bloomberg 1-3 Month T-Bill ETF | 0,14 | 32,80 | 12,50 | 32,80 | 1,2306 | 0,2114 | |||
| SYK / Stryker Corporation | 0,03 | 0,37 | 12,29 | 6,68 | 1,2095 | -0,0375 | |||
| HSY / The Hershey Company | 0,07 | 1,33 | 11,12 | -1,69 | 1,0944 | -0,1299 | |||
| COST / Costco Wholesale Corporation | 0,01 | -5,30 | 10,84 | -0,88 | 1,0667 | -0,1169 | |||
| AMGN / Amgen Inc. | 0,04 | 4,98 | 10,29 | -5,92 | 1,0134 | -0,1713 | |||
| HD / The Home Depot, Inc. | 0,03 | -0,76 | 9,62 | -0,72 | 0,9475 | -0,1021 | |||
| GOOGL / Alphabet Inc. | 0,05 | -8,50 | 9,21 | 4,27 | 0,9063 | -0,0496 | |||
| TSCO / Tractor Supply Company | 0,17 | -2,57 | 9,03 | -6,69 | 0,8888 | -0,1588 | |||
| CARR / Carrier Global Corporation | 0,11 | 2,14 | 7,90 | 17,92 | 0,7782 | 0,0524 | |||
| GNRC / Generac Holdings Inc. | 0,05 | 2,82 | 7,58 | 16,27 | 0,7467 | 0,0404 | |||
| MCHI / iShares Trust - iShares MSCI China ETF | 0,13 | 1,14 | 6,99 | 2,45 | 0,6883 | -0,0507 | |||
| RSP / Invesco Exchange-Traded Fund Trust - Invesco S&P 500 Equal Weight ETF | 0,04 | 4,87 | 6,63 | 10,03 | 0,6522 | 0,0003 | |||
| SCHD / Schwab Strategic Trust - Schwab U.S. Dividend Equity ETF | 0,25 | 1,39 | 6,59 | -3,91 | 0,6484 | -0,0937 | |||
| DOCU / DocuSign, Inc. | 0,08 | 6,06 | 0,5968 | 0,5968 | |||||
| WSM / Williams-Sonoma, Inc. | 0,03 | -0,09 | 4,95 | 3,24 | 0,4870 | -0,0318 | |||
| FXI / iShares Trust - iShares China Large-Cap ETF | 0,13 | 2,77 | 4,68 | 5,41 | 0,4603 | -0,0200 | |||
| IVV / iShares Trust - iShares Core S&P 500 ETF | 0,00 | -0,12 | 2,67 | 10,36 | 0,2633 | 0,0009 | |||
| CGGR / Capital Group Growth ETF | 0,06 | -2,68 | 2,59 | 15,50 | 0,2546 | 0,0122 | |||
| PNFP / Pinnacle Financial Partners, Inc. | 0,02 | 112,21 | 2,28 | 121,03 | 0,2246 | 0,1128 | |||
| XOM / Exxon Mobil Corporation | 0,02 | 5,20 | 2,25 | -4,63 | 0,2211 | -0,0339 | |||
| SPY / SPDR S&P 500 ETF | 0,00 | 20,09 | 2,22 | 32,64 | 0,2185 | 0,0373 | |||
| LUMN / Lumen Technologies, Inc. | Call | 0,50 | 0,00 | 2,19 | 11,73 | 0,2156 | 0,0034 | ||
| HCA / HCA Healthcare, Inc. | 0,00 | -6,54 | 1,85 | 3,64 | 0,1821 | -0,0112 | |||
| BRK.A / Berkshire Hathaway Inc. | 0,00 | 0,00 | 1,46 | -8,71 | 0,1435 | -0,0294 | |||
| SO / The Southern Company | 0,02 | 0,00 | 1,45 | -0,07 | 0,1429 | -0,0145 | |||
| DUSA / Davis Fundamental ETF Trust - Davis Select U.S. Equity ETF | 0,03 | -8,70 | 1,40 | -0,14 | 0,1380 | -0,0140 | |||
| META / Meta Platforms, Inc. | 0,00 | -0,49 | 1,35 | 27,44 | 0,1327 | 0,0182 | |||
| VRSN / VeriSign, Inc. | 0,00 | 0,00 | 1,25 | 13,74 | 0,1231 | 0,0041 | |||
| VOO / Vanguard Index Funds - Vanguard S&P 500 ETF | 0,00 | -0,99 | 1,25 | 9,39 | 0,1229 | -0,0006 | |||
| NVDA / NVIDIA Corporation | 0,01 | -10,47 | 1,11 | 30,51 | 0,1092 | 0,0172 | |||
| JPM / JPMorgan Chase & Co. | 0,00 | 1,31 | 0,85 | 19,69 | 0,0838 | 0,0068 | |||
| CGDV / Capital Group Dividend Value ETF | 0,02 | -1,02 | 0,85 | 9,74 | 0,0832 | -0,0002 | |||
| MCD / McDonald's Corporation | 0,00 | -14,06 | 0,81 | -19,60 | 0,0800 | -0,0295 | |||
| WMT / Walmart Inc. | 0,01 | -0,93 | 0,74 | 10,31 | 0,0727 | 0,0002 | |||
| VOOG / Vanguard Admiral Funds - Vanguard S&P 500 Growth ETF | 0,00 | 0,00 | 0,66 | 18,53 | 0,0649 | 0,0047 | |||
| DVY / iShares Trust - iShares Select Dividend ETF | 0,00 | -2,61 | 0,63 | -3,68 | 0,0619 | -0,0088 | |||
| AVGO / Broadcom Inc. | 0,00 | -13,40 | 0,61 | 42,89 | 0,0604 | 0,0138 | |||
| OXY / Occidental Petroleum Corporation | 0,01 | 216,43 | 0,60 | 169,37 | 0,0590 | 0,0349 | |||
| T / AT&T Inc. | 0,02 | 0,92 | 0,45 | 3,23 | 0,0442 | -0,0029 | |||
| LOW / Lowe's Companies, Inc. | 0,00 | 0,00 | 0,44 | -4,94 | 0,0437 | -0,0068 | |||
| QUAL / iShares Trust - iShares MSCI USA Quality Factor ETF | 0,00 | 6,52 | 0,44 | 14,21 | 0,0435 | 0,0015 | |||
| IJH / iShares Trust - iShares Core S&P Mid-Cap ETF | 0,01 | 0,00 | 0,44 | 6,33 | 0,0431 | -0,0015 | |||
| SPY / SPDR S&P 500 ETF | Put | 0,00 | 0,43 | 0,0426 | 0,0426 | ||||
| FHN / First Horizon Corporation | 0,02 | 0,00 | 0,40 | 9,04 | 0,0392 | -0,0003 | |||
| FBK / FB Financial Corporation | 0,01 | 0,00 | 0,39 | -2,26 | 0,0384 | -0,0048 | |||
| RF / Regions Financial Corporation | 0,02 | 0,00 | 0,37 | 8,19 | 0,0365 | -0,0006 | |||
| CGXU / Capital Group International Focus Equity ETF | 0,01 | 0,00 | 0,34 | 10,78 | 0,0334 | 0,0003 | |||
| VOOV / Vanguard Admiral Funds - Vanguard S&P 500 Value ETF | 0,00 | 0,00 | 0,34 | 2,43 | 0,0332 | -0,0024 | |||
| COPX / Global X Funds - Global X Copper Miners ETF | 0,01 | 0,00 | 0,34 | 15,02 | 0,0332 | 0,0015 | |||
| MSGS / Madison Square Garden Sports Corp. | 0,00 | 0,00 | 0,33 | 7,40 | 0,0329 | -0,0008 | |||
| V / Visa Inc. | 0,00 | -0,22 | 0,32 | 1,25 | 0,0318 | -0,0028 | |||
| FITB / Fifth Third Bancorp | 0,01 | -3,19 | 0,32 | 1,60 | 0,0312 | -0,0026 | |||
| ET / Energy Transfer LP - Limited Partnership | 0,02 | 1,75 | 0,32 | -0,94 | 0,0311 | -0,0034 | |||
| LLY / Eli Lilly and Company | 0,00 | -14,94 | 0,31 | -19,69 | 0,0302 | -0,0112 | |||
| EHC / Encompass Health Corporation | 0,00 | -2,74 | 0,28 | 17,92 | 0,0279 | 0,0018 | |||
| CGUS / Capital Group Core Equity ETF | 0,01 | -14,48 | 0,28 | -5,46 | 0,0274 | -0,0045 | |||
| MDY / SPDR S&P MidCap 400 ETF Trust | 0,00 | 0,00 | 0,27 | 5,98 | 0,0263 | -0,0009 | |||
| MOAT / VanEck ETF Trust - VanEck Morningstar Wide Moat ETF | 0,00 | 0,00 | 0,26 | 6,53 | 0,0257 | -0,0008 | |||
| BSCP / Invesco Exchange-Traded Self-Indexed Fund Trust - Invesco BulletShares 2025 Corporate Bond ETF | 0,01 | 0,26 | 0,0255 | 0,0255 | |||||
| UNH / UnitedHealth Group Incorporated | 0,00 | 0,12 | 0,26 | -40,51 | 0,0254 | -0,0214 | |||
| PG / The Procter & Gamble Company | 0,00 | -0,43 | 0,26 | -6,91 | 0,0253 | -0,0046 | |||
| NHI / National Health Investors, Inc. | 0,00 | 33,42 | 0,26 | 26,73 | 0,0252 | 0,0033 | |||
| MU / Micron Technology, Inc. | 0,00 | 0,25 | 0,0243 | 0,0243 | |||||
| MTN / Vail Resorts, Inc. | 0,00 | 0,00 | 0,22 | -1,83 | 0,0212 | -0,0025 | |||
| CSCO / Cisco Systems, Inc. | 0,00 | 0,21 | 0,0210 | 0,0210 | |||||
| PRF / Invesco Exchange-Traded Fund Trust - Invesco RAFI US 1000 ETF | 0,01 | 0,00 | 0,21 | 4,46 | 0,0208 | -0,0011 | |||
| MO / Altria Group, Inc. | 0,00 | 0,00 | 0,21 | -2,35 | 0,0205 | -0,0026 | |||
| CLX / The Clorox Company | 0,00 | -2,83 | 0,21 | -20,77 | 0,0203 | -0,0079 | |||
| NXE / NexGen Energy Ltd. | 0,01 | -33,33 | 0,10 | 3,19 | 0,0096 | -0,0006 | |||
| MMM / 3M Company | 0,00 | -100,00 | 0,00 | 0,0000 | |||||
| SNA / Snap-on Incorporated | 0,00 | -100,00 | 0,00 | 0,0000 | |||||
| DVN / Devon Energy Corporation | 0,00 | -100,00 | 0,00 | 0,0000 |