Statistiques de base
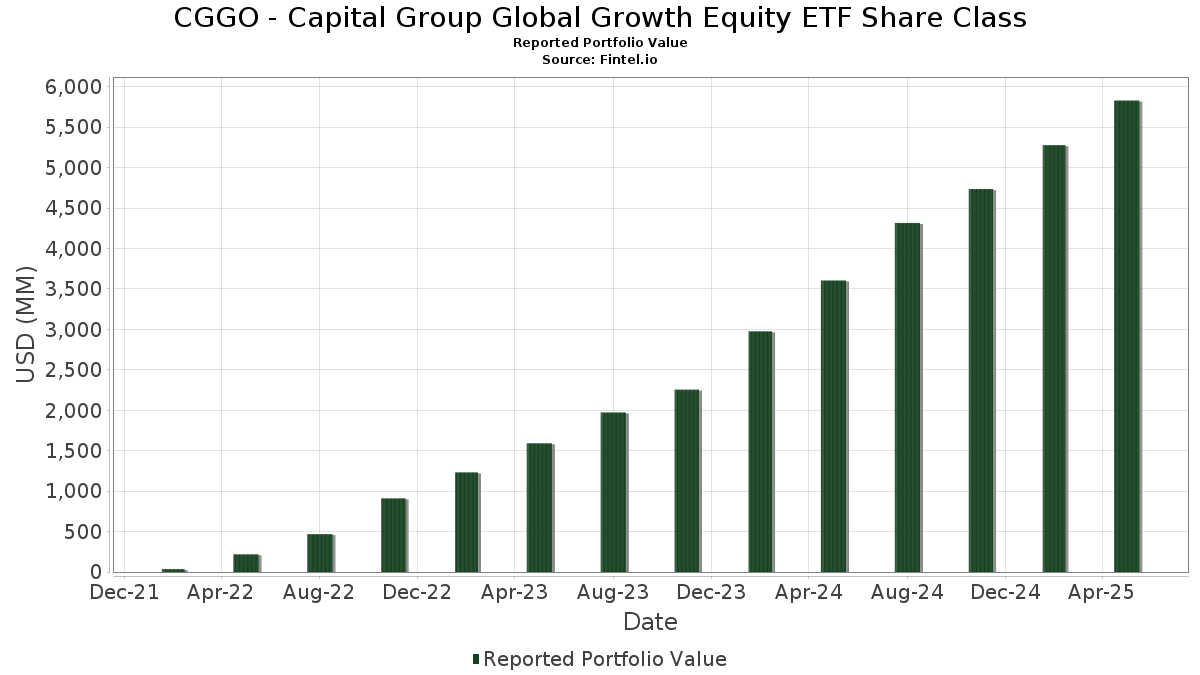
| Valeur du portefeuille | $ 5 829 011 712 |
| Positions actuelles | 96 |
Dernières positions, performances, ASG (à partir des dépôts 13F, 13D)
CGGO - Capital Group Global Growth Equity ETF Share Class a déclaré un total de 96 positions dans ses derniers dépôts auprès de la SEC. La valeur la plus récente du portefeuille est calculée à 5 829 011 712 USD. Les actifs sous gestion réels (ASG) sont cette valeur plus les liquidités (qui ne sont pas divulguées). Les principales positions de CGGO - Capital Group Global Growth Equity ETF Share Class sont Microsoft Corporation (US:MSFT) , Taiwan Semiconductor Manufacturing Company Limited - Depositary Receipt (Common Stock) (US:TSM) , NVIDIA Corporation (US:NVDA) , Broadcom Inc. (US:AVGO) , and ASML Holding N.V. (NL:ASML) . Les nouvelles positions de CGGO - Capital Group Global Growth Equity ETF Share Class incluent BAE Systems plc (GB:BA.) , Cloudflare, Inc. (US:NET) , Siemens Aktiengesellschaft (PL:SIE) , Costco Wholesale Corporation (US:COST) , and Spotify Technology S.A. (US:SPOT) .
Meilleures augmentations ce trimestre
Nous utilisons la variation de l'allocation du portefeuille car il s'agit de l'indicateur le plus significatif. Les changements peuvent être dus à des transactions ou à des variations de prix des actions.
| Titre | Actions (en millions) |
Valeur ($ en millions) |
% du portefeuille | ΔPortefeuille % |
|---|---|---|---|---|
| 49,89 | 0,8579 | 0,8579 | ||
| 1,94 | 49,82 | 0,8567 | 0,8567 | |
| 0,77 | 355,77 | 6,1181 | 0,7455 | |
| 41,57 | 0,7148 | 0,7148 | ||
| 0,24 | 40,37 | 0,6943 | 0,6943 | |
| 0,16 | 38,95 | 0,6699 | 0,6699 | |
| 4,86 | 72,89 | 1,2534 | 0,6233 | |
| 0,03 | 35,75 | 0,6148 | 0,6148 | |
| 0,67 | 33,61 | 0,5780 | 0,5780 | |
| 0,04 | 28,83 | 0,4958 | 0,4958 |
Principales baisses ce trimestre
Nous utilisons la variation de l'allocation du portefeuille car il s'agit de l'indicateur le plus significatif. Les changements peuvent être dus à des transactions ou à des variations de prix des actions.
| Titre | Actions (en millions) |
Valeur ($ en millions) |
% du portefeuille | ΔPortefeuille % |
|---|---|---|---|---|
| 0,04 | 3,53 | 0,0607 | -2,3764 | |
| 0,11 | 60,41 | 1,0388 | -1,0584 | |
| 0,18 | 36,24 | 0,6233 | -0,8807 | |
| 0,08 | 24,30 | 0,4179 | -0,8245 | |
| 0,10 | 40,52 | 0,6967 | -0,6695 | |
| 0,86 | 59,56 | 1,0243 | -0,6487 | |
| 0,45 | 72,97 | 1,2548 | -0,6260 | |
| 0,15 | 112,33 | 1,9317 | -0,5214 | |
| 0,18 | 83,51 | 1,4361 | -0,4911 | |
| 0,51 | 150,02 | 2,5798 | -0,4807 |
Déclarations 13F et dépôts de fonds
Ce formulaire a été déposé le 2025-07-16 pour la période de déclaration 2025-05-31. Cliquez sur l'icône du lien pour voir l'historique complet des transactions.
Mettre à niveau pour débloquer les données premium et exporter vers Excel ![]() .
.
| Titre | Type | Prix moyen de l'action | Actions (en millions) |
ΔActions (%) |
ΔActions (%) |
Valeur ($ en millions) |
Portefeuille (%) |
ΔPortefeuille (%) |
|
|---|---|---|---|---|---|---|---|---|---|
| MSFT / Microsoft Corporation | 0,77 | 8,72 | 355,77 | 26,07 | 6,1181 | 0,7455 | |||
| TSM / Taiwan Semiconductor Manufacturing Company Limited - Depositary Receipt (Common Stock) | 1,68 | 13,42 | 324,70 | 21,46 | 5,5837 | 0,4939 | |||
| NVDA / NVIDIA Corporation | 1,76 | 11,17 | 237,39 | 20,26 | 4,0823 | 0,3241 | |||
| AVGO / Broadcom Inc. | 0,68 | 10,33 | 165,60 | 33,92 | 2,8477 | 0,4936 | |||
| ASML / ASML Holding N.V. | 0,21 | 10,28 | 155,21 | 16,32 | 2,6692 | 0,1286 | |||
| SAFRY / Safran SA - Depositary Receipt (Common Stock) | 0,51 | -18,43 | 150,02 | -6,68 | 2,5798 | -0,4807 | |||
| GOOGL / Alphabet Inc. | 0,75 | 8,75 | 128,23 | 9,68 | 2,2051 | -0,0208 | |||
| IGQ5 / 3i Group plc | 2,29 | 10,21 | 125,54 | 21,48 | 2,1589 | 0,1913 | |||
| META / Meta Platforms, Inc. | 0,19 | 8,78 | 120,44 | 5,41 | 2,0712 | -0,1042 | |||
| LLY / Eli Lilly and Company | 0,15 | 8,80 | 112,33 | -12,82 | 1,9317 | -0,5214 | |||
| FIX / Comfort Systems USA, Inc. | 0,21 | 10,01 | 100,08 | 44,81 | 1,7210 | 0,4052 | |||
| V / Visa Inc. | 0,24 | 12,64 | 88,18 | 13,41 | 1,5163 | 0,0361 | |||
| PRX / Prosus N.V. | 1,71 | 1,48 | 87,98 | 19,57 | 1,5129 | 0,1121 | |||
| AMZN / Amazon.com, Inc. | 0,42 | 8,76 | 85,23 | 5,04 | 1,4656 | -0,0792 | |||
| LIN / Linde plc | 0,18 | -17,59 | 83,51 | -17,50 | 1,4361 | -0,4911 | |||
| VRTX / Vertex Pharmaceuticals Incorporated | 0,19 | 8,32 | 82,78 | -0,20 | 1,4235 | -0,1556 | |||
| CS / AXA SA | 1,70 | -21,77 | 79,92 | -5,06 | 1,3743 | -0,2283 | |||
| AON / Aon plc | 0,21 | 7,44 | 77,18 | -2,29 | 1,3273 | -0,1766 | |||
| BKNG / Booking Holdings Inc. | 0,01 | 5,05 | 76,79 | 15,58 | 1,3205 | 0,0557 | |||
| CMG / Chipotle Mexican Grill, Inc. | 1,53 | 4,69 | 76,64 | -2,86 | 1,3180 | -0,1841 | |||
| FI / Fiserv, Inc. | 0,45 | 6,94 | 72,97 | -26,14 | 1,2548 | -0,6260 | |||
| BBVA / Banco Bilbao Vizcaya Argentaria, S.A. - Depositary Receipt (Common Stock) | 4,86 | 95,33 | 72,89 | 120,22 | 1,2534 | 0,6233 | |||
| CNQ / Canadian Natural Resources Limited | 2,40 | -11,90 | 72,78 | -5,26 | 1,2516 | -0,2111 | |||
| SAP / SAP SE - Depositary Receipt (Common Stock) | 0,23 | 49,66 | 70,38 | 64,18 | 1,2103 | 0,3942 | |||
| C / Citigroup Inc. | 0,93 | 45,81 | 70,20 | 37,36 | 1,2072 | 0,2342 | |||
| SCGLY / Société Générale Société anonyme - Depositary Receipt (Common Stock) | 1,25 | 9,89 | 68,14 | 46,43 | 1,1717 | 0,2858 | |||
| SNPS / Synopsys, Inc. | 0,15 | 9,53 | 67,55 | 11,14 | 1,1617 | 0,0045 | |||
| RNO / Renault SA | 1,27 | 20,15 | 65,68 | 19,74 | 1,1295 | 0,0852 | |||
| MELI / MercadoLibre, Inc. | 0,03 | 26,11 | 65,49 | 52,35 | 1,1262 | 0,3078 | |||
| PRU / Prudential plc | 5,63 | 11,96 | 64,03 | 39,28 | 1,1012 | 0,2258 | |||
| TDG / TransDigm Group Incorporated | 0,04 | 8,87 | 62,43 | 16,93 | 1,0736 | 0,0571 | |||
| BN / Brookfield Corporation | 1,08 | 64,15 | 62,33 | 63,53 | 1,0718 | 0,3462 | |||
| MC / LVMH Moët Hennessy - Louis Vuitton, Société Européenne | 0,11 | -27,20 | 60,41 | -45,16 | 1,0388 | -1,0584 | |||
| NVO / Novo Nordisk A/S - Depositary Receipt (Common Stock) | 0,86 | -12,00 | 59,56 | -32,22 | 1,0243 | -0,6487 | |||
| RYAAY / Ryanair Holdings plc - Depositary Receipt (Common Stock) | 1,02 | 8,74 | 56,98 | 24,59 | 0,9799 | 0,1091 | |||
| 05935 / Samsung Electronics Co Ltd | 1,70 | 8,75 | 56,91 | 18,92 | 0,9787 | 0,0676 | |||
| SHOP / Shopify Inc. | 0,53 | 19,43 | 56,84 | 14,33 | 0,9775 | 0,0309 | |||
| NEC1 / NEC Corporation | 2,01 | 515,96 | 52,79 | 68,61 | 0,9078 | 0,3117 | |||
| CFRUY / Compagnie Financière Richemont SA - Depositary Receipt (Common Stock) | 0,27 | 113,08 | 51,53 | 152,61 | 0,8862 | -0,3950 | |||
| TCOM / Trip.com Group Limited - Depositary Receipt (Common Stock) | 0,82 | 8,73 | 51,35 | 20,19 | 0,8831 | 0,0696 | |||
| CPRT / Copart, Inc. | 0,99 | 8,76 | 50,96 | 2,17 | 0,8763 | -0,0733 | |||
| Province of Ontario Canada / STIV (US68323JTJ42) | 49,89 | 0,8579 | 0,8579 | ||||||
| BA. / BAE Systems plc | 1,94 | 49,82 | 0,8567 | 0,8567 | |||||
| AIR / Airbus SE | 0,27 | -8,16 | 49,49 | -1,67 | 0,8511 | -0,1072 | |||
| TW / Tradeweb Markets Inc. | 0,34 | 8,79 | 48,89 | 16,08 | 0,8407 | 0,0389 | |||
| IR / Ingersoll Rand Inc. | 0,56 | 2,32 | 45,93 | -1,47 | 0,7898 | -0,0977 | |||
| ARGX / argenx SE - Depositary Receipt (Common Stock) | 0,08 | 16,38 | 45,57 | 6,81 | 0,7837 | -0,0287 | |||
| IHG / InterContinental Hotels Group PLC - Depositary Receipt (Common Stock) | 0,39 | 10,14 | 44,50 | 0,93 | 0,7652 | -0,0741 | |||
| 2282 / MGM China Holdings Limited | 30,61 | 5,30 | 43,48 | 7,93 | 0,7478 | -0,0193 | |||
| SAN / Santander UK plc - Preferred Stock | 0,43 | 29,52 | 43,19 | 18,89 | 0,7427 | 0,0511 | |||
| ALZC / ASSA ABLOY AB (publ) | 1,35 | 6,00 | 42,95 | 9,87 | 0,7386 | -0,0057 | |||
| BATS / British American Tobacco p.l.c. | 0,93 | 8,76 | 41,86 | 25,82 | 0,7198 | 0,0864 | |||
| DNB Bank ASA / STIV (US2332K0T697) | 41,57 | 0,7148 | 0,7148 | ||||||
| TMO / Thermo Fisher Scientific Inc. | 0,10 | -25,86 | 40,52 | -43,54 | 0,6967 | -0,6695 | |||
| NET / Cloudflare, Inc. | 0,24 | 40,37 | 0,6943 | 0,6943 | |||||
| PM / Philip Morris International Inc. | 0,22 | -14,75 | 39,70 | -0,86 | 0,6828 | -0,0797 | |||
| BX / Blackstone Inc. | 0,29 | 8,79 | 39,56 | -6,33 | 0,6803 | -0,1238 | |||
| SBGSY / Schneider Electric S.E. - Depositary Receipt (Common Stock) | 0,16 | -36,05 | 39,25 | -33,78 | 0,6750 | -0,4535 | |||
| IOC / ITOCHU Corporation | 0,73 | -44,12 | 39,24 | -32,15 | 0,6748 | -0,4264 | |||
| SIE / Siemens Aktiengesellschaft | 0,16 | 38,95 | 0,6699 | 0,6699 | |||||
| MNST / Monster Beverage Corporation | 0,61 | -16,25 | 38,90 | -2,00 | 0,6689 | -0,0868 | |||
| PUB / Pancontinental Energy NL | 0,36 | 95,92 | 38,67 | 115,31 | 0,6650 | 0,3231 | |||
| NSRGY / Nestlé S.A. - Depositary Receipt (Common Stock) | 0,35 | 8,79 | 37,57 | 20,15 | 0,6461 | 0,0508 | |||
| SBUX / Starbucks Corporation | 0,44 | 24,10 | 37,20 | -10,04 | 0,6396 | -0,1476 | |||
| CAP / Capgemini SE | 0,22 | 167,27 | 36,53 | 176,10 | 0,6282 | 0,3492 | |||
| AAPL / Apple Inc. | 0,18 | -44,75 | 36,24 | -54,12 | 0,6233 | -0,8807 | |||
| COST / Costco Wholesale Corporation | 0,03 | 35,75 | 0,6148 | 0,6148 | |||||
| 8136 / Sanrio Company, Ltd. | 0,79 | 17,26 | 34,84 | 22,98 | 0,5992 | 0,0598 | |||
| REGN / Regeneron Pharmaceuticals, Inc. | 0,07 | 8,87 | 34,76 | -23,61 | 0,5978 | -0,2686 | |||
| RELIANCE / Reliance Industries Limited | 2,06 | 8,74 | 34,20 | 31,65 | 0,5881 | 0,0935 | |||
| SLB / Schlumberger Limited | 1,03 | -1,34 | 33,91 | -21,73 | 0,5832 | -0,2417 | |||
| SAAB B / Saab AB (publ) | 0,67 | 33,61 | 0,5780 | 0,5780 | |||||
| HIA1 / Hitachi, Ltd. | 1,16 | 15,01 | 32,48 | 29,81 | 0,5585 | 0,0822 | |||
| PFE / Pfizer Inc. | 1,37 | 8,75 | 32,12 | -3,34 | 0,5523 | -0,0803 | |||
| CI / The Cigna Group | 0,10 | 8,63 | 30,70 | 11,37 | 0,5279 | 0,0031 | |||
| ALNY / Alnylam Pharmaceuticals, Inc. | 0,10 | 8,73 | 30,68 | 34,20 | 0,5275 | 0,0923 | |||
| HD / The Home Depot, Inc. | 0,08 | 8,69 | 30,16 | 0,93 | 0,5187 | -0,0503 | |||
| KYCCF / Keyence Corporation | 0,07 | -1,85 | 29,13 | 4,98 | 0,5009 | -0,0274 | |||
| SPOT / Spotify Technology S.A. | 0,04 | 28,83 | 0,4958 | 0,4958 | |||||
| CNC / Centene Corporation | 0,51 | 8,78 | 28,82 | 5,56 | 0,4956 | -0,0242 | |||
| PDYPF / Flutter Entertainment plc | 0,11 | 15,78 | 28,10 | 4,27 | 0,4833 | -0,0299 | |||
| CARR / Carrier Global Corporation | 0,39 | 4,86 | 27,90 | 15,21 | 0,4799 | 0,0188 | |||
| DG / Dollar General Corporation | 0,28 | 29,24 | 27,59 | 69,44 | 0,4744 | 0,1644 | |||
| CRERF / Carrefour SA | 1,81 | 27,13 | 0,4665 | 0,4665 | |||||
| EPAM / EPAM Systems, Inc. | 0,15 | 13,45 | 26,50 | -3,96 | 0,4558 | -0,0697 | |||
| BA / The Boeing Company | 0,12 | 25,25 | 0,4343 | 0,4343 | |||||
| BHARTIARTL / Bharti Airtel Limited | 1,13 | 48,87 | 24,44 | 79,94 | 0,4203 | 0,1617 | |||
| UNH / UnitedHealth Group Incorporated | 0,08 | -41,42 | 24,30 | -62,76 | 0,4179 | -0,8245 | |||
| GTCAP / GT Capital Holdings, Inc. | 2,35 | 8,74 | 22,89 | 21,03 | 0,3936 | 0,0336 | |||
| FQVLF / First Quantum Minerals Ltd. | 1,22 | 8,74 | 18,10 | 29,83 | 0,3113 | 0,0458 | |||
| Nestle Finance International Ltd / STIV (US64106GTJ21) | 14,97 | 0,2574 | 0,2574 | ||||||
| AGI / Alliance Global Group, Inc. | 79,92 | 0,00 | 11,95 | 33,36 | 0,2054 | 0,0349 | |||
| Mizuho Bank Ltd/New York NY / STIV (US60689FT659) | 8,99 | 0,1546 | 0,1546 | ||||||
| US8252528851 / Invesco Government & Agency Portfolio, Institutional Class | 7,94 | 7,94 | 0,1365 | 0,1365 | |||||
| LULU / lululemon athletica inc. | 0,01 | -82,27 | 3,92 | -84,64 | 0,0674 | -0,4187 | |||
| US14020B1026 / CAPITAL GROUP CENTRAL CASH FUND | 0,04 | -97,24 | 3,53 | -97,24 | 0,0607 | -2,3764 | |||
| GLBE / Global-E Online Ltd. | 0,00 | -100,00 | 0,00 | -100,00 | -0,2022 |