Statistiques de base
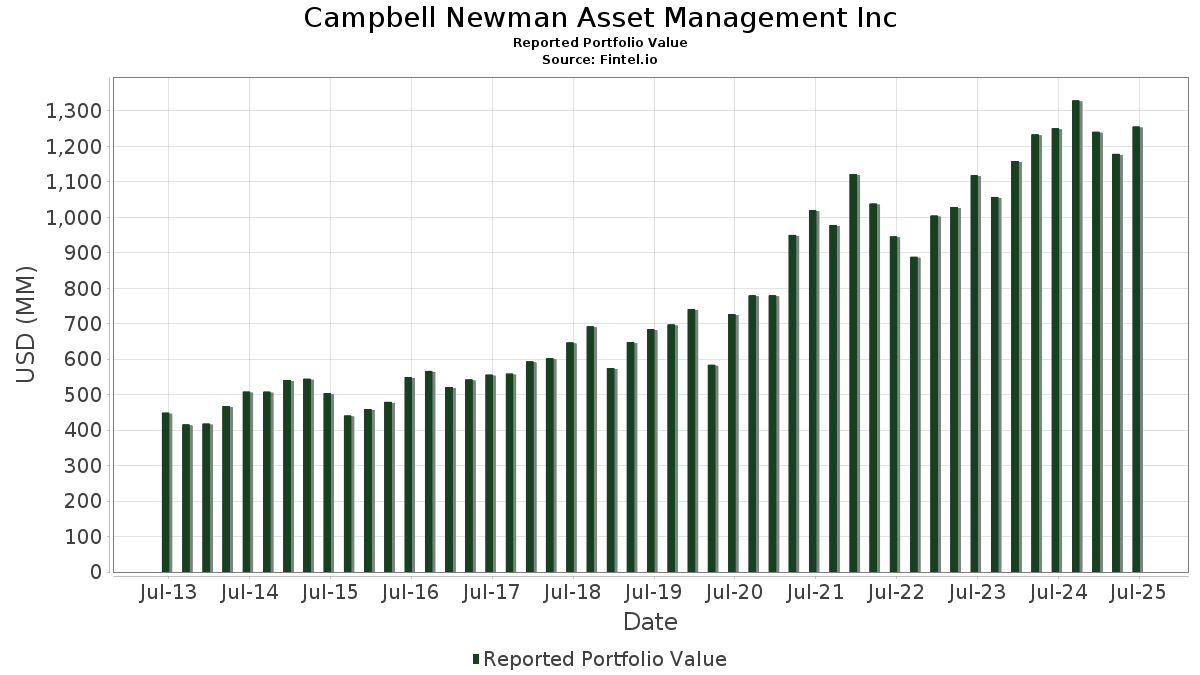
| Valeur du portefeuille | $ 1 255 256 485 |
| Positions actuelles | 106 |
Dernières positions, performances, ASG (à partir des dépôts 13F, 13D)
Campbell Newman Asset Management Inc a déclaré un total de 106 positions dans ses derniers dépôts auprès de la SEC. La valeur la plus récente du portefeuille est calculée à 1 255 256 485 USD. Les actifs sous gestion réels (ASG) sont cette valeur plus les liquidités (qui ne sont pas divulguées). Les principales positions de Campbell Newman Asset Management Inc sont Microsoft Corporation (US:MSFT) , Broadcom Inc. (US:AVGO) , Apple Inc. (US:AAPL) , KLA Corporation (US:KLAC) , and Amphenol Corporation (US:APH) . Les nouvelles positions de Campbell Newman Asset Management Inc incluent Primo Brands Corporation (US:PRMB) , Skyward Specialty Insurance Group, Inc. (US:SKWD) , Knife River Corporation (US:KNF) , Trane Technologies plc (US:TT) , and Motorola Solutions, Inc. (US:MSI) .
Meilleures augmentations ce trimestre
Nous utilisons la variation de l'allocation du portefeuille car il s'agit de l'indicateur le plus significatif. Les changements peuvent être dus à des transactions ou à des variations de prix des actions.
| Titre | Actions (en millions) |
Valeur ($ en millions) |
% du portefeuille | ΔPortefeuille % |
|---|---|---|---|---|
| 0,45 | 44,39 | 3,5363 | 2,0278 | |
| 0,06 | 22,41 | 1,7851 | 1,7851 | |
| 0,25 | 69,45 | 5,5325 | 1,6516 | |
| 0,18 | 89,41 | 7,1231 | 1,2069 | |
| 0,36 | 37,66 | 3,0000 | 1,0299 | |
| 0,17 | 35,29 | 2,8115 | 0,9007 | |
| 0,33 | 29,89 | 2,3812 | 0,8312 | |
| 0,06 | 54,81 | 4,3664 | 0,7268 | |
| 0,24 | 32,44 | 2,5841 | 0,2313 | |
| 0,13 | 29,85 | 2,3777 | 0,1712 |
Principales baisses ce trimestre
Nous utilisons la variation de l'allocation du portefeuille car il s'agit de l'indicateur le plus significatif. Les changements peuvent être dus à des transactions ou à des variations de prix des actions.
| Titre | Actions (en millions) |
Valeur ($ en millions) |
% du portefeuille | ΔPortefeuille % |
|---|---|---|---|---|
| 0,00 | 0,00 | -2,0298 | ||
| 0,04 | 31,96 | 2,5458 | -1,3300 | |
| 0,14 | 23,29 | 1,8553 | -1,1684 | |
| 0,34 | 69,33 | 5,5232 | -1,0276 | |
| 0,12 | 38,70 | 3,0827 | -0,5932 | |
| 0,16 | 29,45 | 2,3464 | -0,5712 | |
| 0,14 | 31,28 | 2,4921 | -0,4062 | |
| 0,00 | 0,22 | 0,0175 | -0,3660 | |
| 0,12 | 43,95 | 3,5016 | -0,3060 | |
| 0,08 | 43,32 | 3,4508 | -0,2624 |
Déclarations 13F et dépôts de fonds
Ce formulaire a été déposé le 2025-07-17 pour la période de déclaration 2025-06-30. Cliquez sur l'icône du lien pour voir l'historique complet des transactions.
Mettre à niveau pour débloquer les données premium et exporter vers Excel ![]() .
.
| Titre | Type | Prix moyen de l'action | Actions (en millions) |
ΔActions (%) |
ΔActions (%) |
Valeur ($ en millions) |
Portefeuille (%) |
ΔPortefeuille (%) |
|
|---|---|---|---|---|---|---|---|---|---|
| MSFT / Microsoft Corporation | 0,18 | -3,22 | 89,41 | 28,23 | 7,1231 | 1,2069 | |||
| AVGO / Broadcom Inc. | 0,25 | -7,78 | 69,45 | 51,83 | 5,5325 | 1,6516 | |||
| AAPL / Apple Inc. | 0,34 | -2,78 | 69,33 | -10,20 | 5,5232 | -1,0276 | |||
| KLAC / KLA Corporation | 0,06 | -3,03 | 54,81 | 27,77 | 4,3664 | 0,7268 | |||
| APH / Amphenol Corporation | 0,45 | 65,83 | 44,39 | 149,68 | 3,5363 | 2,0278 | |||
| V / Visa Inc. | 0,12 | -3,32 | 43,95 | -2,05 | 3,5016 | -0,3060 | |||
| MA / Mastercard Incorporated | 0,08 | -3,45 | 43,32 | -1,02 | 3,4508 | -0,2624 | |||
| SYK / Stryker Corporation | 0,10 | -3,73 | 40,73 | 2,31 | 3,2448 | -0,1329 | |||
| AJG / Arthur J. Gallagher & Co. | 0,12 | -3,67 | 38,70 | -10,68 | 3,0827 | -0,5932 | |||
| ICE / Intercontinental Exchange, Inc. | 0,21 | -3,62 | 38,49 | 2,50 | 3,0662 | -0,1197 | |||
| WEC / WEC Energy Group, Inc. | 0,36 | 69,62 | 37,66 | 62,18 | 3,0000 | 1,0299 | |||
| TXN / Texas Instruments Incorporated | 0,17 | 35,64 | 35,29 | 56,71 | 2,8115 | 0,9007 | |||
| J / Jacobs Solutions Inc. | 0,25 | -2,12 | 32,74 | 6,43 | 2,6080 | -0,0018 | |||
| EMR / Emerson Electric Co. | 0,24 | -3,81 | 32,44 | 16,98 | 2,5841 | 0,2313 | |||
| LLY / Eli Lilly and Company | 0,04 | -25,88 | 31,96 | -30,04 | 2,5458 | -1,3300 | |||
| ABT / Abbott Laboratories | 0,23 | -3,13 | 31,86 | -0,68 | 2,5381 | -0,1836 | |||
| RTX / RTX Corporation | 0,21 | -3,53 | 31,35 | 6,34 | 2,4976 | -0,0039 | |||
| LOW / Lowe's Companies, Inc. | 0,14 | -3,73 | 31,28 | -8,42 | 2,4921 | -0,4062 | |||
| NDAQ / Nasdaq, Inc. | 0,33 | 38,81 | 29,89 | 63,62 | 2,3812 | 0,8312 | |||
| ADI / Analog Devices, Inc. | 0,13 | -2,76 | 29,85 | 14,77 | 2,3777 | 0,1712 | |||
| ABBV / AbbVie Inc. | 0,16 | -3,32 | 29,45 | -14,35 | 2,3464 | -0,5712 | |||
| TEL / TE Connectivity plc | 0,14 | -45,25 | 23,29 | -34,65 | 1,8553 | -1,1684 | |||
| MCO / Moody's Corporation | 0,05 | -3,45 | 22,82 | 3,99 | 1,8179 | -0,0440 | |||
| ETN / Eaton Corporation plc | 0,06 | 22,41 | 1,7851 | 1,7851 | |||||
| HON / Honeywell International Inc. | 0,08 | -3,76 | 18,73 | 5,85 | 1,4919 | -0,0093 | |||
| CTSH / Cognizant Technology Solutions Corporation | 0,24 | -1,35 | 18,54 | 0,62 | 1,4773 | -0,0863 | |||
| AMZN / Amazon.com, Inc. | 0,08 | -0,09 | 18,11 | 15,21 | 1,4426 | 0,1090 | |||
| EOG / EOG Resources, Inc. | 0,15 | -3,23 | 17,93 | -9,74 | 1,4281 | -0,2571 | |||
| VMC / Vulcan Materials Company | 0,06 | -1,12 | 16,65 | 10,55 | 1,3266 | 0,0484 | |||
| DE / Deere & Company | 0,03 | -3,74 | 15,32 | 4,28 | 1,2204 | -0,0260 | |||
| ZTS / Zoetis Inc. | 0,10 | -4,65 | 14,91 | -9,69 | 1,1876 | -0,2129 | |||
| SPGI / S&P Global Inc. | 0,02 | -2,83 | 11,73 | 0,84 | 0,9341 | -0,0525 | |||
| IFF / International Flavors & Fragrances Inc. | 0,14 | 0,00 | 10,05 | -5,23 | 0,8008 | -0,0992 | |||
| MCD / McDonald's Corporation | 0,02 | 0,00 | 6,78 | -6,47 | 0,5401 | -0,0749 | |||
| GOOG / Alphabet Inc. | 0,04 | 0,00 | 6,35 | 13,55 | 0,5055 | 0,0313 | |||
| GOOGL / Alphabet Inc. | 0,04 | -0,19 | 6,25 | 13,74 | 0,4981 | 0,0317 | |||
| FN / Fabrinet | 0,01 | -4,67 | 4,39 | 42,25 | 0,3501 | 0,0880 | |||
| MTZ / MasTec, Inc. | 0,03 | -8,00 | 4,36 | 34,37 | 0,3476 | 0,0720 | |||
| NVDA / NVIDIA Corporation | 0,03 | -0,35 | 4,31 | 45,28 | 0,3431 | 0,0916 | |||
| CW / Curtiss-Wright Corporation | 0,01 | 7,09 | 4,26 | 64,96 | 0,3391 | 0,1201 | |||
| DY / Dycom Industries, Inc. | 0,01 | 7,11 | 3,61 | 71,83 | 0,2873 | 0,1092 | |||
| LRN / Stride, Inc. | 0,02 | 7,12 | 3,51 | 22,95 | 0,2796 | 0,0374 | |||
| EXLS / ExlService Holdings, Inc. | 0,08 | 7,21 | 3,46 | -0,57 | 0,2760 | -0,0196 | |||
| JNJ / Johnson & Johnson | 0,02 | 0,00 | 3,45 | -7,90 | 0,2750 | -0,0430 | |||
| FI / Fiserv, Inc. | 0,02 | -0,20 | 3,26 | -22,08 | 0,2601 | -0,0954 | |||
| META / Meta Platforms, Inc. | 0,00 | -4,08 | 3,21 | 22,84 | 0,2554 | 0,0339 | |||
| HD / The Home Depot, Inc. | 0,01 | -13,21 | 3,07 | -13,19 | 0,2449 | -0,0555 | |||
| ENSG / The Ensign Group, Inc. | 0,02 | 7,11 | 2,99 | 27,70 | 0,2384 | 0,0395 | |||
| MEDP / Medpace Holdings, Inc. | 0,01 | 7,13 | 2,93 | 10,35 | 0,2337 | 0,0081 | |||
| LNTH / Lantheus Holdings, Inc. | 0,04 | 7,11 | 2,93 | -10,16 | 0,2333 | -0,0433 | |||
| SFM / Sprouts Farmers Market, Inc. | 0,02 | 7,12 | 2,84 | 15,54 | 0,2263 | 0,0177 | |||
| CIEN / Ciena Corporation | 0,03 | 7,12 | 2,80 | 44,16 | 0,2232 | 0,0583 | |||
| EVR / Evercore Inc. | 0,01 | 7,10 | 2,75 | 44,84 | 0,2190 | 0,0579 | |||
| OLLI / Ollie's Bargain Outlet Holdings, Inc. | 0,02 | 7,13 | 2,74 | 21,34 | 0,2179 | 0,0266 | |||
| RMBS / Rambus Inc. | 0,04 | 7,16 | 2,67 | 32,55 | 0,2125 | 0,0417 | |||
| VITL / Vital Farms, Inc. | 0,07 | 7,11 | 2,64 | 35,46 | 0,2100 | 0,0448 | |||
| CORT / Corcept Therapeutics Incorporated | 0,04 | 7,20 | 2,60 | -31,11 | 0,2068 | -0,1129 | |||
| APG / APi Group Corporation | 0,05 | 7,09 | 2,58 | 52,90 | 0,2057 | 0,0624 | |||
| MOD / Modine Manufacturing Company | 0,03 | 5,04 | 2,50 | 34,84 | 0,1992 | 0,0418 | |||
| PLUS / ePlus inc. | 0,03 | 7,10 | 2,46 | 26,53 | 0,1957 | 0,0310 | |||
| AMSC / American Superconductor Corporation | 0,07 | 7,23 | 2,39 | 117,02 | 0,1900 | 0,0967 | |||
| NSC / Norfolk Southern Corporation | 0,01 | 0,00 | 2,35 | 8,06 | 0,1869 | 0,0027 | |||
| MGY / Magnolia Oil & Gas Corporation | 0,10 | 7,10 | 2,21 | -4,70 | 0,1763 | -0,0207 | |||
| TMUS / T-Mobile US, Inc. | 0,01 | -0,21 | 2,14 | -10,83 | 0,1706 | -0,0332 | |||
| PTC / PTC Inc. | 0,01 | 7,07 | 2,08 | 19,09 | 0,1661 | 0,0175 | |||
| CPRX / Catalyst Pharmaceuticals, Inc. | 0,09 | 7,10 | 2,04 | -4,14 | 0,1624 | -0,0181 | |||
| LAD / Lithia Motors, Inc. | 0,01 | 7,06 | 1,97 | 23,23 | 0,1568 | 0,0213 | |||
| BOOT / Boot Barn Holdings, Inc. | 0,01 | 7,13 | 1,96 | 51,67 | 0,1560 | 0,0464 | |||
| DIS / The Walt Disney Company | 0,02 | 0,00 | 1,93 | 25,65 | 0,1538 | 0,0234 | |||
| HALO / Halozyme Therapeutics, Inc. | 0,04 | 7,11 | 1,91 | -12,67 | 0,1522 | -0,0334 | |||
| ONTO / Onto Innovation Inc. | 0,02 | 7,13 | 1,90 | -10,90 | 0,1512 | -0,0295 | |||
| AMGN / Amgen Inc. | 0,01 | 0,00 | 1,89 | -10,35 | 0,1504 | -0,0283 | |||
| TJX / The TJX Companies, Inc. | 0,02 | -0,20 | 1,89 | 1,18 | 0,1502 | -0,0079 | |||
| NVEE / NV5 Global, Inc. | 0,08 | 7,11 | 1,74 | 28,35 | 0,1389 | 0,0236 | |||
| ORCL / Oracle Corporation | 0,01 | -0,28 | 1,69 | 56,04 | 0,1349 | 0,0428 | |||
| TMDX / TransMedics Group, Inc. | 0,01 | 7,09 | 1,67 | 113,44 | 0,1328 | 0,0665 | |||
| PRMB / Primo Brands Corporation | 0,06 | 1,66 | 0,1319 | 0,1319 | |||||
| BAC / Bank of America Corporation | 0,03 | 0,00 | 1,63 | 13,40 | 0,1295 | 0,0079 | |||
| CSCO / Cisco Systems, Inc. | 0,02 | 0,00 | 1,61 | 12,47 | 0,1279 | 0,0067 | |||
| AAON / AAON, Inc. | 0,02 | 7,14 | 1,59 | 1,15 | 0,1266 | -0,0067 | |||
| SKWD / Skyward Specialty Insurance Group, Inc. | 0,03 | 1,56 | 0,1245 | 0,1245 | |||||
| CCS / Century Communities, Inc. | 0,03 | 7,12 | 1,50 | -10,07 | 0,1196 | -0,0221 | |||
| KNF / Knife River Corporation | 0,02 | 1,45 | 0,1152 | 0,1152 | |||||
| SUPN / Supernus Pharmaceuticals, Inc. | 0,05 | 7,09 | 1,44 | 3,09 | 0,1144 | -0,0038 | |||
| POOL / Pool Corporation | 0,00 | 3,99 | 1,43 | -4,74 | 0,1137 | -0,0135 | |||
| PEP / PepsiCo, Inc. | 0,01 | 0,00 | 1,25 | -11,93 | 0,0994 | -0,0208 | |||
| SBUX / Starbucks Corporation | 0,01 | -0,50 | 1,22 | -7,03 | 0,0969 | -0,0141 | |||
| AMD / Advanced Micro Devices, Inc. | 0,01 | -0,22 | 1,21 | 37,77 | 0,0965 | 0,0219 | |||
| TMO / Thermo Fisher Scientific Inc. | 0,00 | -0,23 | 1,07 | -18,71 | 0,0852 | -0,0264 | |||
| MC / Moelis & Company | 0,02 | 7,18 | 1,06 | 14,41 | 0,0848 | 0,0059 | |||
| HSY / The Hershey Company | 0,01 | 0,00 | 1,06 | -3,02 | 0,0843 | -0,0082 | |||
| MTDR / Matador Resources Company | 0,02 | 7,08 | 0,99 | 0,00 | 0,0789 | -0,0051 | |||
| TT / Trane Technologies plc | 0,00 | 0,99 | 0,0786 | 0,0786 | |||||
| MSI / Motorola Solutions, Inc. | 0,00 | 0,95 | 0,0759 | 0,0759 | |||||
| NKE / NIKE, Inc. | 0,01 | -1,73 | 0,95 | 9,97 | 0,0756 | 0,0024 | |||
| MKTX / MarketAxess Holdings Inc. | 0,00 | 7,06 | 0,79 | 10,50 | 0,0629 | 0,0023 | |||
| VRTX / Vertex Pharmaceuticals Incorporated | 0,00 | -0,31 | 0,72 | -8,48 | 0,0577 | -0,0094 | |||
| ORLY / O'Reilly Automotive, Inc. | 0,01 | 1 400,00 | 0,72 | -5,63 | 0,0575 | -0,0074 | |||
| CARR / Carrier Global Corporation | 0,01 | 0,00 | 0,69 | 15,47 | 0,0553 | 0,0043 | |||
| LGIH / LGI Homes, Inc. | 0,01 | 7,10 | 0,68 | -17,01 | 0,0541 | -0,0153 | |||
| PG / The Procter & Gamble Company | 0,00 | 0,00 | 0,66 | -6,51 | 0,0527 | -0,0073 | |||
| XOM / Exxon Mobil Corporation | 0,01 | 0,00 | 0,55 | -9,34 | 0,0441 | -0,0077 | |||
| COST / Costco Wholesale Corporation | 0,00 | 0,00 | 0,50 | 4,61 | 0,0398 | -0,0007 | |||
| BA / The Boeing Company | 0,00 | -0,31 | 0,47 | 22,66 | 0,0376 | 0,0049 | |||
| JCI / Johnson Controls International plc | 0,00 | 0,00 | 0,38 | 31,94 | 0,0303 | 0,0058 | |||
| COP / ConocoPhillips | 0,00 | -94,31 | 0,22 | -95,15 | 0,0175 | -0,3660 | |||
| ACN / Accenture plc | 0,00 | -100,00 | 0,00 | -100,00 | -2,0298 | ||||
| VRNT / Verint Systems Inc. | 0,00 | -100,00 | 0,00 | 0,0000 | |||||
| BLKB / Blackbaud, Inc. | 0,00 | -100,00 | 0,00 | 0,0000 | |||||
| UNH / UnitedHealth Group Incorporated | 0,00 | -100,00 | 0,00 | 0,0000 | |||||
| SPY / SPDR S&P 500 ETF | 0,00 | -100,00 | 0,00 | 0,0000 |