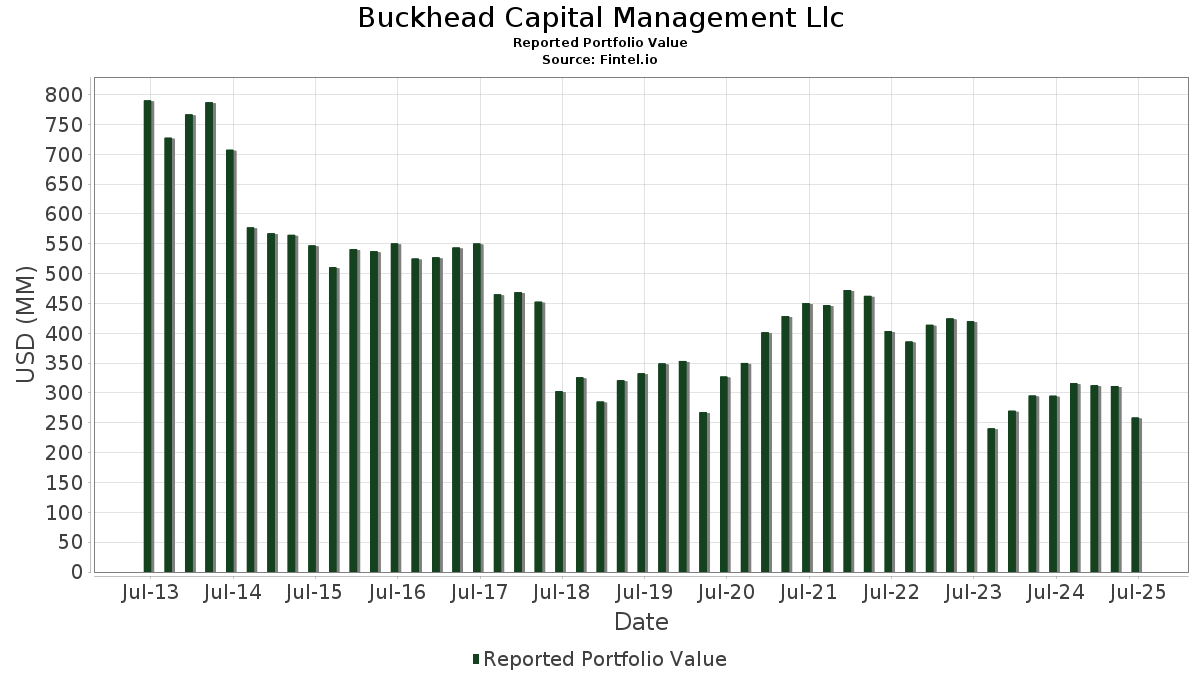
Statistiques de base
| Valeur du portefeuille | $ 258 615 289 |
| Positions actuelles | 128 |
Dernières positions, performances, ASG (à partir des dépôts 13F, 13D)
Buckhead Capital Management Llc a déclaré un total de 128 positions dans ses derniers dépôts auprès de la SEC. La valeur la plus récente du portefeuille est calculée à 258 615 289 USD. Les actifs sous gestion réels (ASG) sont cette valeur plus les liquidités (qui ne sont pas divulguées). Les principales positions de Buckhead Capital Management Llc sont Microsoft Corporation (US:MSFT) , Apple Inc. (US:AAPL) , The Home Depot, Inc. (US:HD) , Amazon.com, Inc. (US:AMZN) , and Berkshire Hathaway Inc. (US:BRK.B) . Les nouvelles positions de Buckhead Capital Management Llc incluent ResMed Inc. (US:RMD) , SPS Commerce, Inc. (US:SPSC) , Invesco QQQ Trust, Series 1 (US:QQQ) , Vistra Corp. (US:VST) , and Vanguard Tax-Managed Funds - Vanguard FTSE Developed Markets ETF (US:VEA) .
Meilleures augmentations ce trimestre
Nous utilisons la variation de l'allocation du portefeuille car il s'agit de l'indicateur le plus significatif. Les changements peuvent être dus à des transactions ou à des variations de prix des actions.
| Titre | Actions (en millions) |
Valeur ($ en millions) |
% du portefeuille | ΔPortefeuille % |
|---|---|---|---|---|
| 0,03 | 14,33 | 5,5430 | 1,7698 | |
| 0,01 | 2,72 | 1,0521 | 1,0521 | |
| 0,03 | 6,23 | 2,4098 | 0,9170 | |
| 0,06 | 2,89 | 1,1181 | 0,8570 | |
| 0,03 | 3,27 | 1,2645 | 0,7556 | |
| 0,01 | 1,90 | 0,7351 | 0,6593 | |
| 0,02 | 8,67 | 3,3532 | 0,5704 | |
| 0,05 | 4,97 | 1,9200 | 0,5698 | |
| 0,04 | 4,57 | 1,7688 | 0,5109 | |
| 0,02 | 2,36 | 0,9121 | 0,5084 |
Principales baisses ce trimestre
Nous utilisons la variation de l'allocation du portefeuille car il s'agit de l'indicateur le plus significatif. Les changements peuvent être dus à des transactions ou à des variations de prix des actions.
| Titre | Actions (en millions) |
Valeur ($ en millions) |
% du portefeuille | ΔPortefeuille % |
|---|---|---|---|---|
| 0,00 | 1,21 | 0,4669 | -1,2318 | |
| 0,01 | 6,17 | 2,3876 | -1,1708 | |
| 0,02 | 0,33 | 0,1294 | -1,0532 | |
| 0,03 | 4,82 | 1,8644 | -0,7789 | |
| 0,00 | 0,57 | 0,2207 | -0,7525 | |
| 0,03 | 4,47 | 1,7296 | -0,6582 | |
| 0,01 | 0,54 | 0,2092 | -0,6178 | |
| 0,01 | 1,02 | 0,3940 | -0,5635 | |
| 0,02 | 4,92 | 1,9016 | -0,5627 | |
| 0,00 | 0,83 | 0,3202 | -0,5287 |
Déclarations 13F et dépôts de fonds
Ce formulaire a été déposé le 2025-08-04 pour la période de déclaration 2025-06-30. Cliquez sur l'icône du lien pour voir l'historique complet des transactions.
Mettre à niveau pour débloquer les données premium et exporter vers Excel ![]() .
.
| Titre | Type | Prix moyen de l'action | Actions (en millions) |
ΔActions (%) |
ΔActions (%) |
Valeur ($ en millions) |
Portefeuille (%) |
ΔPortefeuille (%) |
|
|---|---|---|---|---|---|---|---|---|---|
| MSFT / Microsoft Corporation | 0,03 | -8,02 | 14,33 | 21,87 | 5,5430 | 1,7698 | |||
| AAPL / Apple Inc. | 0,06 | 0,11 | 11,67 | -7,53 | 4,5126 | 0,4640 | |||
| HD / The Home Depot, Inc. | 0,02 | -0,08 | 8,67 | -0,03 | 3,3532 | 0,5704 | |||
| AMZN / Amazon.com, Inc. | 0,03 | 16,14 | 6,23 | 33,94 | 2,4098 | 0,9170 | |||
| BRK.B / Berkshire Hathaway Inc. | 0,01 | -38,97 | 6,17 | -44,34 | 2,3876 | -1,1708 | |||
| GOOGL / Alphabet Inc. | 0,03 | -18,23 | 5,74 | -6,80 | 2,2195 | 0,2436 | |||
| GWRE / Guidewire Software, Inc. | 0,02 | -17,66 | 5,56 | 3,46 | 2,1482 | 0,4259 | |||
| V / Visa Inc. | 0,01 | 1,38 | 5,14 | 2,72 | 1,9860 | 0,3819 | |||
| JPM / JPMorgan Chase & Co. | 0,02 | -40,87 | 5,05 | -30,12 | 1,9525 | -0,3652 | |||
| APH / Amphenol Corporation | 0,05 | -21,64 | 4,97 | 17,99 | 1,9200 | 0,5698 | |||
| UNH / UnitedHealth Group Incorporated | 0,02 | 7,47 | 4,92 | -35,99 | 1,9016 | -0,5627 | |||
| FI / Fiserv, Inc. | 0,03 | -12,68 | 4,88 | -31,82 | 1,8857 | -0,4089 | |||
| TXN / Texas Instruments Incorporated | 0,02 | -30,46 | 4,86 | -19,65 | 1,8801 | -0,0612 | |||
| JNJ / Johnson & Johnson | 0,03 | -36,47 | 4,82 | -41,49 | 1,8644 | -0,7789 | |||
| ROP / Roper Technologies, Inc. | 0,01 | -24,98 | 4,80 | -27,88 | 1,8565 | -0,2790 | |||
| AZO / AutoZone, Inc. | 0,00 | -19,33 | 4,71 | -21,46 | 1,8216 | -0,1024 | |||
| WSO / Watsco, Inc. | 0,01 | -6,28 | 4,61 | -18,58 | 1,7825 | -0,0337 | |||
| CASY / Casey's General Stores, Inc. | 0,01 | -24,35 | 4,59 | -11,05 | 1,7737 | 0,1193 | |||
| FTNT / Fortinet, Inc. | 0,04 | 6,22 | 4,57 | 16,65 | 1,7688 | 0,5109 | |||
| CVX / Chevron Corporation | 0,03 | -29,80 | 4,47 | -39,90 | 1,7296 | -0,6582 | |||
| AON / Aon plc | 0,01 | -12,85 | 4,29 | -22,10 | 1,6604 | -0,1076 | |||
| AXP / American Express Company | 0,01 | 0,30 | 4,20 | 18,90 | 1,6227 | 0,4907 | |||
| PEP / PepsiCo, Inc. | 0,03 | -23,15 | 4,13 | -32,31 | 1,5981 | -0,3609 | |||
| RJF / Raymond James Financial, Inc. | 0,03 | -25,73 | 4,12 | -18,00 | 1,5922 | -0,0187 | |||
| TYL / Tyler Technologies, Inc. | 0,01 | 0,01 | 4,03 | 2,00 | 1,5577 | 0,2906 | |||
| ROK / Rockwell Automation, Inc. | 0,01 | -27,54 | 3,88 | -6,84 | 1,5005 | 0,1642 | |||
| SO / The Southern Company | 0,04 | -34,82 | 3,87 | -34,91 | 1,4982 | -0,4112 | |||
| BLK / BlackRock, Inc. | 0,00 | -28,45 | 3,87 | -20,69 | 1,4953 | -0,0691 | |||
| WMT / Walmart Inc. | 0,04 | -14,52 | 3,80 | -4,79 | 1,4687 | 0,1889 | |||
| ULTA / Ulta Beauty, Inc. | 0,01 | -33,97 | 3,78 | -15,72 | 1,4633 | 0,0228 | |||
| COO / The Cooper Companies, Inc. | 0,05 | -2,18 | 3,67 | -17,48 | 1,4188 | -0,0075 | |||
| RSG / Republic Services, Inc. | 0,01 | -0,23 | 3,67 | 1,61 | 1,4186 | 0,2603 | |||
| LRCX / Lam Research Corporation | 0,03 | 53,95 | 3,27 | 106,18 | 1,2645 | 0,7556 | |||
| CMCSA / Comcast Corporation | 0,09 | -30,38 | 3,24 | -32,67 | 1,2546 | -0,2912 | |||
| APD / Air Products and Chemicals, Inc. | 0,01 | -28,29 | 3,24 | -31,42 | 1,2517 | -0,2624 | |||
| AME / AMETEK, Inc. | 0,02 | -22,08 | 3,22 | -18,07 | 1,2448 | -0,0159 | |||
| CPRT / Copart, Inc. | 0,06 | 309,62 | 2,89 | 255,16 | 1,1181 | 0,8570 | |||
| RMD / ResMed Inc. | 0,01 | 2,72 | 1,0521 | 1,0521 | |||||
| LULU / lululemon athletica inc. | 0,01 | 9,07 | 2,66 | -8,43 | 1,0294 | 0,0966 | |||
| ROL / Rollins, Inc. | 0,05 | 4,48 | 2,66 | 9,10 | 1,0290 | 0,2466 | |||
| ELS / Equity LifeStyle Properties, Inc. | 0,04 | -30,19 | 2,65 | -35,44 | 1,0255 | -0,2926 | |||
| ORCL / Oracle Corporation | 0,01 | -53,55 | 2,59 | -27,37 | 1,0018 | -0,1423 | |||
| CF / CF Industries Holdings, Inc. | 0,03 | -30,61 | 2,51 | -18,31 | 0,9700 | -0,0150 | |||
| DINO / HF Sinclair Corporation | 0,06 | -16,16 | 2,46 | 4,76 | 0,9529 | 0,1982 | |||
| BRKR / Bruker Corporation | 0,06 | 74,25 | 2,45 | 72,06 | 0,9455 | 0,4894 | |||
| ICLR / ICON Public Limited Company | 0,02 | 125,51 | 2,36 | 87,44 | 0,9121 | 0,5084 | |||
| FANG / Diamondback Energy, Inc. | 0,02 | -28,60 | 2,24 | -38,63 | 0,8644 | -0,3042 | |||
| GOOG / Alphabet Inc. | 0,01 | -2,38 | 2,10 | 10,84 | 0,8109 | 0,2040 | |||
| YUM / Yum! Brands, Inc. | 0,01 | 753,63 | 1,90 | 705,51 | 0,7351 | 0,6593 | |||
| MA / Mastercard Incorporated | 0,00 | -0,30 | 1,68 | 2,26 | 0,6477 | 0,1220 | |||
| PNC / The PNC Financial Services Group, Inc. | 0,01 | -40,30 | 1,62 | -36,69 | 0,6246 | -0,1938 | |||
| IGSB / iShares Trust - iShares 1-5 Year Investment Grade Corporate Bond ETF | 0,03 | -0,22 | 1,53 | 0,53 | 0,5917 | 0,1034 | |||
| SPY / SPDR S&P 500 ETF | 0,00 | 19,43 | 1,38 | 31,87 | 0,5329 | 0,1977 | |||
| BAC / Bank of America Corporation | 0,03 | -0,36 | 1,33 | 12,95 | 0,5130 | 0,1363 | |||
| SPSC / SPS Commerce, Inc. | 0,01 | 1,27 | 0,4917 | 0,4917 | |||||
| COST / Costco Wholesale Corporation | 0,00 | -1,54 | 1,27 | 3,10 | 0,4892 | 0,0954 | |||
| LMT / Lockheed Martin Corporation | 0,00 | -78,01 | 1,21 | -77,20 | 0,4669 | -1,2318 | |||
| EVR / Evercore Inc. | 0,00 | 0,00 | 1,19 | 35,11 | 0,4601 | 0,1778 | |||
| LLY / Eli Lilly and Company | 0,00 | -0,92 | 1,18 | -6,44 | 0,4548 | 0,0513 | |||
| ATO / Atmos Energy Corporation | 0,01 | -65,76 | 1,02 | -65,88 | 0,3940 | -0,5635 | |||
| CME / CME Group Inc. | 0,00 | -62,43 | 0,95 | -61,00 | 0,3665 | -0,4124 | |||
| PG / The Procter & Gamble Company | 0,01 | -3,78 | 0,89 | -10,09 | 0,3447 | 0,0268 | |||
| IT / Gartner, Inc. | 0,00 | 0,00 | 0,86 | -3,80 | 0,3329 | 0,0461 | |||
| EMR / Emerson Electric Co. | 0,01 | -64,25 | 0,83 | -56,56 | 0,3217 | -0,2922 | |||
| BDX / Becton, Dickinson and Company | 0,00 | -58,38 | 0,83 | -68,71 | 0,3202 | -0,5287 | |||
| CSX / CSX Corporation | 0,03 | -65,61 | 0,82 | -61,89 | 0,3157 | -0,3713 | |||
| XOM / Exxon Mobil Corporation | 0,01 | -3,92 | 0,78 | -12,98 | 0,3011 | 0,0143 | |||
| TJX / The TJX Companies, Inc. | 0,01 | -1,90 | 0,73 | -0,54 | 0,2834 | 0,0470 | |||
| IWR / iShares Trust - iShares Russell Mid-Cap ETF | 0,01 | 0,00 | 0,72 | 8,16 | 0,2771 | 0,0645 | |||
| BR / Broadridge Financial Solutions, Inc. | 0,00 | -66,93 | 0,70 | -66,86 | 0,2700 | -0,4057 | |||
| CPAY / Corpay, Inc. | 0,00 | 0,00 | 0,67 | -4,82 | 0,2596 | 0,0333 | |||
| MELI / MercadoLibre, Inc. | 0,00 | 0,00 | 0,67 | 34,00 | 0,2577 | 0,0981 | |||
| RPM / RPM International Inc. | 0,01 | 0,24 | 0,65 | -4,84 | 0,2510 | 0,0322 | |||
| ABT / Abbott Laboratories | 0,00 | -2,01 | 0,61 | 0,50 | 0,2356 | 0,0411 | |||
| IBM / International Business Machines Corporation | 0,00 | -1,23 | 0,59 | 17,06 | 0,2284 | 0,0666 | |||
| PM / Philip Morris International Inc. | 0,00 | -0,79 | 0,58 | 13,86 | 0,2224 | 0,0603 | |||
| THG / The Hanover Insurance Group, Inc. | 0,00 | -80,73 | 0,57 | -81,21 | 0,2207 | -0,7525 | |||
| ANSS / ANSYS, Inc. | 0,00 | 0,00 | 0,56 | 10,93 | 0,2161 | 0,0545 | |||
| MO / Altria Group, Inc. | 0,01 | -78,51 | 0,54 | -79,01 | 0,2092 | -0,6178 | |||
| IWD / iShares Trust - iShares Russell 1000 Value ETF | 0,00 | -8,33 | 0,53 | -5,32 | 0,2065 | 0,0255 | |||
| DORM / Dorman Products, Inc. | 0,00 | 0,00 | 0,52 | 1,76 | 0,2012 | 0,0372 | |||
| VWO / Vanguard International Equity Index Funds - Vanguard FTSE Emerging Markets ETF | 0,01 | -0,64 | 0,52 | 8,63 | 0,1998 | 0,0471 | |||
| GGG / Graco Inc. | 0,01 | 0,00 | 0,51 | 2,81 | 0,1987 | 0,0386 | |||
| CSGP / CoStar Group, Inc. | 0,01 | 0,00 | 0,51 | 1,40 | 0,1960 | 0,0358 | |||
| CSCO / Cisco Systems, Inc. | 0,01 | -0,95 | 0,50 | 11,19 | 0,1925 | 0,0491 | |||
| WDFC / WD-40 Company | 0,00 | 0,00 | 0,49 | -6,53 | 0,1884 | 0,0212 | |||
| AMAT / Applied Materials, Inc. | 0,00 | 0,00 | 0,48 | 26,12 | 0,1849 | 0,0633 | |||
| TSCO / Tractor Supply Company | 0,01 | -64,03 | 0,47 | -65,55 | 0,1833 | -0,2581 | |||
| QCOM / QUALCOMM Incorporated | 0,00 | 0,17 | 0,46 | 3,85 | 0,1777 | 0,0357 | |||
| SHY / iShares Trust - iShares 1-3 Year Treasury Bond ETF | 0,01 | -2,89 | 0,46 | -2,75 | 0,1776 | 0,0261 | |||
| SCI / Service Corporation International | 0,01 | 0,00 | 0,46 | 1,55 | 0,1774 | 0,0324 | |||
| KELYA / Kelly Services, Inc. | 0,04 | 0,00 | 0,46 | -11,13 | 0,1761 | 0,0118 | |||
| SLQD / iShares Trust - iShares 0-5 Year Investment Grade Corporate Bond ETF | 0,01 | 20,74 | 0,45 | 21,56 | 0,1747 | 0,0554 | |||
| MASI / Masimo Corporation | 0,00 | 0,00 | 0,45 | 0,91 | 0,1724 | 0,0307 | |||
| NVDA / NVIDIA Corporation | 0,00 | 1,08 | 0,42 | 47,69 | 0,1605 | 0,0701 | |||
| AOS / A. O. Smith Corporation | 0,01 | 0,00 | 0,41 | 0,25 | 0,1583 | 0,0274 | |||
| SHOP / Shopify Inc. | 0,00 | 0,00 | 0,39 | 20,99 | 0,1516 | 0,0475 | |||
| VOO / Vanguard Index Funds - Vanguard S&P 500 ETF | 0,00 | 0,00 | 0,38 | 10,53 | 0,1463 | 0,0365 | |||
| WFC / Wells Fargo & Company | 0,00 | 0,00 | 0,37 | 11,68 | 0,1445 | 0,0371 | |||
| PAYX / Paychex, Inc. | 0,00 | -1,31 | 0,37 | -6,78 | 0,1435 | 0,0156 | |||
| BIP / Brookfield Infrastructure Partners L.P. - Limited Partnership | 0,01 | 0,00 | 0,37 | 12,46 | 0,1434 | 0,0376 | |||
| IVV / iShares Trust - iShares Core S&P 500 ETF | 0,00 | 0,17 | 0,37 | 10,91 | 0,1416 | 0,0355 | |||
| GLD / SPDR Gold Trust | 0,00 | 0,00 | 0,37 | 5,80 | 0,1412 | 0,0305 | |||
| FIVE / Five Below, Inc. | 0,00 | 0,00 | 0,36 | 75,36 | 0,1405 | 0,0739 | |||
| KO / The Coca-Cola Company | 0,01 | 0,00 | 0,36 | -1,09 | 0,1404 | 0,0225 | |||
| GNTX / Gentex Corporation | 0,02 | -90,38 | 0,33 | -90,94 | 0,1294 | -1,0532 | |||
| RTX / RTX Corporation | 0,00 | 0,00 | 0,32 | 10,31 | 0,1242 | 0,0307 | |||
| A / Agilent Technologies, Inc. | 0,00 | 0,00 | 0,30 | 0,66 | 0,1175 | 0,0209 | |||
| QQQ / Invesco QQQ Trust, Series 1 | 0,00 | 0,30 | 0,1165 | 0,1165 | |||||
| IWM / iShares Trust - iShares Russell 2000 ETF | 0,00 | 0,00 | 0,29 | 7,95 | 0,1105 | 0,0257 | |||
| TGT / Target Corporation | 0,00 | -5,13 | 0,28 | -10,41 | 0,1100 | 0,0082 | |||
| SITE / SiteOne Landscape Supply, Inc. | 0,00 | -20,29 | 0,28 | -20,80 | 0,1078 | -0,0049 | |||
| WY / Weyerhaeuser Company | 0,01 | 0,00 | 0,28 | -12,42 | 0,1065 | 0,0058 | |||
| WDIV / SPDR Index Shares Funds - SPDR S&P Global Dividend ETF | 0,00 | 5,62 | 0,26 | 14,67 | 0,1000 | 0,0275 | |||
| AMLP / ALPS ETF Trust - Alerian MLP ETF | 0,01 | -4,60 | 0,25 | -10,25 | 0,0982 | 0,0074 | |||
| VST / Vistra Corp. | 0,00 | 0,25 | 0,0974 | 0,0974 | |||||
| MRK / Merck & Co., Inc. | 0,00 | 0,00 | 0,24 | -11,72 | 0,0933 | 0,0055 | |||
| SGOV / iShares Trust - iShares 0-3 Month Treasury Bond ETF | 0,00 | 0,00 | 0,23 | 0,00 | 0,0893 | 0,0152 | |||
| PLD / Prologis, Inc. | 0,00 | 0,00 | 0,22 | -5,93 | 0,0860 | 0,0101 | |||
| IWP / iShares Trust - iShares Russell Mid-Cap Growth ETF | 0,00 | 0,22 | 0,0858 | 0,0858 | |||||
| ISRG / Intuitive Surgical, Inc. | 0,00 | 0,00 | 0,22 | 10,00 | 0,0851 | 0,0208 | |||
| URI / United Rentals, Inc. | 0,00 | 0,22 | 0,0845 | 0,0845 | |||||
| VTI / Vanguard Index Funds - Vanguard Total Stock Market ETF | 0,00 | 0,21 | 0,0826 | 0,0826 | |||||
| TIP / iShares Trust - iShares TIPS Bond ETF | 0,00 | 0,00 | 0,21 | -0,93 | 0,0825 | 0,0134 | |||
| FND / Floor & Decor Holdings, Inc. | 0,00 | -24,45 | 0,21 | -28,77 | 0,0808 | -0,0132 | |||
| MSCI / MSCI Inc. | 0,00 | 0,00 | 0,21 | 1,97 | 0,0803 | 0,0150 | |||
| VEA / Vanguard Tax-Managed Funds - Vanguard FTSE Developed Markets ETF | 0,00 | 0,21 | 0,0799 | 0,0799 | |||||
| IGIB / iShares Trust - iShares 5-10 Year Investment Grade Corporate Bond ETF | 0,00 | 0,20 | 0,0786 | 0,0786 | |||||
| EA / Electronic Arts Inc. | 0,00 | -100,00 | 0,00 | 0,0000 | |||||
| CRL / Charles River Laboratories International, Inc. | 0,00 | -100,00 | 0,00 | 0,0000 |