Statistiques de base
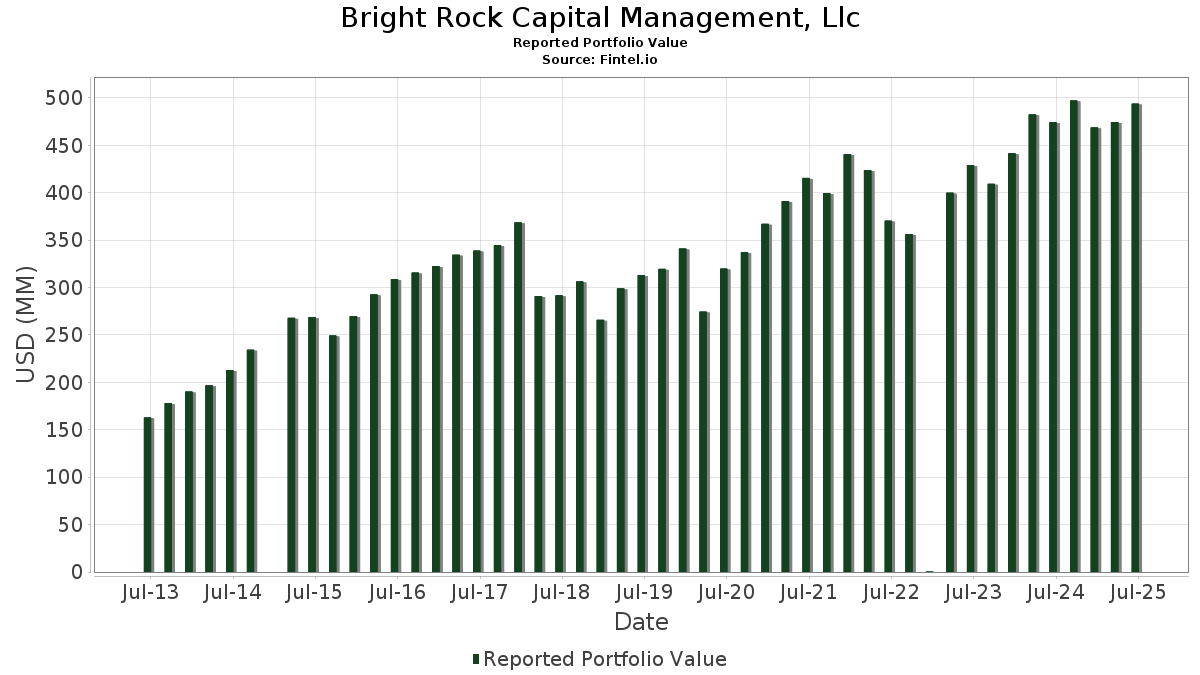
| Valeur du portefeuille | $ 493 980 221 |
| Positions actuelles | 74 |
Dernières positions, performances, ASG (à partir des dépôts 13F, 13D)
Bright Rock Capital Management, Llc a déclaré un total de 74 positions dans ses derniers dépôts auprès de la SEC. La valeur la plus récente du portefeuille est calculée à 493 980 221 USD. Les actifs sous gestion réels (ASG) sont cette valeur plus les liquidités (qui ne sont pas divulguées). Les principales positions de Bright Rock Capital Management, Llc sont Microsoft Corporation (US:MSFT) , Alphabet Inc. (US:GOOGL) , Mastercard Incorporated (US:MA) , iShares Trust - iShares U.S. Energy ETF (US:IYE) , and Chubb Limited (US:CB) . Les nouvelles positions de Bright Rock Capital Management, Llc incluent The Charles Schwab Corporation (US:SCHW) , Oracle Corporation (US:ORCL) , Pinterest, Inc. (US:PINS) , PTC Inc. (US:PTC) , and Gartner, Inc. (US:IT) .
Meilleures augmentations ce trimestre
Nous utilisons la variation de l'allocation du portefeuille car il s'agit de l'indicateur le plus significatif. Les changements peuvent être dus à des transactions ou à des variations de prix des actions.
| Titre | Actions (en millions) |
Valeur ($ en millions) |
% du portefeuille | ΔPortefeuille % |
|---|---|---|---|---|
| 0,12 | 11,40 | 2,3088 | 2,3088 | |
| 0,04 | 7,65 | 1,5491 | 1,5491 | |
| 0,10 | 7,58 | 1,5349 | 1,5349 | |
| 0,03 | 11,15 | 2,2572 | 1,2613 | |
| 0,06 | 31,83 | 6,4444 | 0,8293 | |
| 0,15 | 10,66 | 2,1572 | 0,8198 | |
| 0,25 | 12,22 | 2,4735 | 0,5420 | |
| 0,07 | 2,65 | 0,5372 | 0,5372 | |
| 0,15 | 26,43 | 5,3513 | 0,4644 | |
| 0,01 | 2,15 | 0,4361 | 0,4361 |
Principales baisses ce trimestre
Nous utilisons la variation de l'allocation du portefeuille car il s'agit de l'indicateur le plus significatif. Les changements peuvent être dus à des transactions ou à des variations de prix des actions.
| Titre | Actions (en millions) |
Valeur ($ en millions) |
% du portefeuille | ΔPortefeuille % |
|---|---|---|---|---|
| 0,03 | 9,36 | 1,8946 | -1,4157 | |
| 0,01 | 1,83 | 0,3711 | -0,7871 | |
| 0,01 | 5,90 | 1,1953 | -0,7475 | |
| 0,06 | 11,49 | 2,3259 | -0,5756 | |
| 0,07 | 6,75 | 1,3658 | -0,4652 | |
| 0,14 | 11,24 | 2,2755 | -0,4098 | |
| 0,30 | 13,57 | 2,7463 | -0,3697 | |
| 0,07 | 8,58 | 1,7374 | -0,3159 | |
| 0,04 | 13,04 | 2,6393 | -0,2238 | |
| 0,03 | 2,84 | 0,5759 | -0,1526 |
Déclarations 13F et dépôts de fonds
Ce formulaire a été déposé le 2025-07-10 pour la période de déclaration 2025-06-30. Cliquez sur l'icône du lien pour voir l'historique complet des transactions.
Mettre à niveau pour débloquer les données premium et exporter vers Excel ![]() .
.
| Titre | Type | Prix moyen de l'action | Actions (en millions) |
ΔActions (%) |
ΔActions (%) |
Valeur ($ en millions) |
Portefeuille (%) |
ΔPortefeuille (%) |
|
|---|---|---|---|---|---|---|---|---|---|
| MSFT / Microsoft Corporation | 0,06 | -9,86 | 31,83 | 19,44 | 6,4444 | 0,8293 | |||
| GOOGL / Alphabet Inc. | 0,15 | 0,00 | 26,43 | 13,96 | 5,3513 | 0,4644 | |||
| MA / Mastercard Incorporated | 0,03 | 0,00 | 16,86 | 2,52 | 3,4127 | -0,0516 | |||
| IYE / iShares Trust - iShares U.S. Energy ETF | 0,30 | 0,00 | 13,57 | -8,28 | 2,7463 | -0,3697 | |||
| CB / Chubb Limited | 0,04 | 0,00 | 13,04 | -4,06 | 2,6393 | -0,2238 | |||
| VEEV / Veeva Systems Inc. | 0,04 | 0,00 | 12,38 | 24,33 | 2,5068 | 0,4084 | |||
| UNP / Union Pacific Corporation | 0,05 | 28,92 | 12,31 | 25,56 | 2,4919 | 0,4264 | |||
| TXN / Texas Instruments Incorporated | 0,06 | 0,00 | 12,25 | 15,53 | 2,4798 | 0,2461 | |||
| HON / Honeywell International Inc. | 0,05 | 0,00 | 12,23 | 9,99 | 2,4750 | 0,1329 | |||
| CPRT / Copart, Inc. | 0,25 | 53,70 | 12,22 | 33,28 | 2,4735 | 0,5420 | |||
| AAPL / Apple Inc. | 0,06 | -9,68 | 11,49 | -16,58 | 2,3259 | -0,5756 | |||
| TJX / The TJX Companies, Inc. | 0,09 | 15,62 | 11,42 | 17,22 | 2,3124 | 0,2595 | |||
| SCHW / The Charles Schwab Corporation | 0,12 | 11,40 | 2,3088 | 2,3088 | |||||
| MRK / Merck & Co., Inc. | 0,14 | 0,00 | 11,24 | -11,81 | 2,2755 | -0,4098 | |||
| TMO / Thermo Fisher Scientific Inc. | 0,03 | 189,47 | 11,15 | 135,88 | 2,2572 | 1,2613 | |||
| BLK / BlackRock, Inc. | 0,01 | 0,00 | 11,02 | 10,86 | 2,2303 | 0,1365 | |||
| NKE / NIKE, Inc. | 0,15 | 50,00 | 10,66 | 67,86 | 2,1572 | 0,8198 | |||
| INTU / Intuit Inc. | 0,01 | 0,00 | 9,85 | 28,29 | 1,9931 | 0,3761 | |||
| SLB / Schlumberger Limited | 0,28 | 51,35 | 9,46 | 22,38 | 1,9159 | 0,2867 | |||
| UNH / UnitedHealth Group Incorporated | 0,03 | 0,00 | 9,36 | -40,43 | 1,8946 | -1,4157 | |||
| WST / West Pharmaceutical Services, Inc. | 0,04 | 0,00 | 8,75 | -2,27 | 1,7717 | -0,1149 | |||
| SBUX / Starbucks Corporation | 0,10 | 18,75 | 8,70 | 10,92 | 1,7622 | 0,1089 | |||
| PEP / PepsiCo, Inc. | 0,07 | 0,00 | 8,58 | -11,94 | 1,7374 | -0,3159 | |||
| ACN / Accenture plc | 0,03 | 0,00 | 8,37 | -4,22 | 1,6942 | -0,1465 | |||
| LIN / Linde plc | 0,02 | 0,00 | 8,21 | 0,76 | 1,6621 | -0,0546 | |||
| ROP / Roper Technologies, Inc. | 0,01 | 0,00 | 7,94 | -3,86 | 1,6065 | -0,1325 | |||
| ORCL / Oracle Corporation | 0,04 | 7,65 | 1,5491 | 1,5491 | |||||
| NEE / NextEra Energy, Inc. | 0,11 | 0,00 | 7,64 | -2,06 | 1,5459 | -0,0970 | |||
| MKC / McCormick & Company, Incorporated | 0,10 | 7,58 | 1,5349 | 1,5349 | |||||
| VZ / Verizon Communications Inc. | 0,17 | 0,00 | 7,36 | -4,62 | 1,4891 | -0,1355 | |||
| WMT / Walmart Inc. | 0,07 | -30,30 | 6,75 | -22,38 | 1,3658 | -0,4652 | |||
| V / Visa Inc. | 0,02 | 0,00 | 6,48 | 1,31 | 1,3117 | -0,0358 | |||
| JPM / JPMorgan Chase & Co. | 0,02 | 0,00 | 6,38 | 18,20 | 1,2911 | 0,1542 | |||
| META / Meta Platforms, Inc. | 0,01 | -50,00 | 5,90 | -35,97 | 1,1953 | -0,7475 | |||
| ICE / Intercontinental Exchange, Inc. | 0,03 | 0,00 | 5,50 | 6,36 | 1,1142 | 0,0240 | |||
| CL / Colgate-Palmolive Company | 0,06 | 0,00 | 5,36 | -2,98 | 1,0857 | -0,0790 | |||
| ECL / Ecolab Inc. | 0,02 | 0,00 | 4,85 | 6,27 | 0,9818 | 0,0204 | |||
| ANET / Arista Networks Inc | 0,04 | 0,00 | 4,60 | 32,04 | 0,9320 | 0,1975 | |||
| WEC / WEC Energy Group, Inc. | 0,04 | 0,00 | 4,38 | -4,39 | 0,8859 | -0,0784 | |||
| XOM / Exxon Mobil Corporation | 0,04 | 0,00 | 4,31 | -9,35 | 0,8729 | -0,1293 | |||
| FAST / Fastenal Company | 0,10 | 100,00 | 4,27 | 8,33 | 0,8638 | 0,0339 | |||
| APH / Amphenol Corporation | 0,04 | 0,00 | 4,25 | 50,57 | 0,8596 | 0,2654 | |||
| TSCO / Tractor Supply Company | 0,08 | 0,00 | 4,22 | -4,24 | 0,8546 | -0,0741 | |||
| EOG / EOG Resources, Inc. | 0,04 | 0,00 | 4,19 | -6,73 | 0,8475 | -0,0981 | |||
| RMD / ResMed Inc. | 0,02 | 0,00 | 4,00 | 15,28 | 0,8095 | 0,0786 | |||
| IDXX / IDEXX Laboratories, Inc. | 0,01 | 0,00 | 3,75 | 27,73 | 0,7600 | 0,1407 | |||
| TYL / Tyler Technologies, Inc. | 0,01 | 0,00 | 3,71 | 1,98 | 0,7501 | -0,0155 | |||
| JKHY / Jack Henry & Associates, Inc. | 0,02 | 0,00 | 3,53 | -1,31 | 0,7149 | -0,0391 | |||
| ATR / AptarGroup, Inc. | 0,02 | 0,00 | 3,52 | 5,42 | 0,7125 | 0,0092 | |||
| MNST / Monster Beverage Corporation | 0,05 | 0,00 | 3,32 | 7,03 | 0,6721 | 0,0186 | |||
| HSY / The Hershey Company | 0,02 | 0,00 | 3,32 | -2,95 | 0,6719 | -0,0488 | |||
| AME / AMETEK, Inc. | 0,02 | 0,00 | 3,17 | 5,11 | 0,6411 | 0,0064 | |||
| OKE / ONEOK, Inc. | 0,03 | 0,00 | 2,84 | -17,73 | 0,5759 | -0,1526 | |||
| ROL / Rollins, Inc. | 0,05 | 0,00 | 2,84 | 4,42 | 0,5739 | 0,0019 | |||
| BSY / Bentley Systems, Incorporated | 0,05 | 0,00 | 2,70 | 37,16 | 0,5463 | 0,1319 | |||
| FDS / FactSet Research Systems Inc. | 0,01 | 0,00 | 2,68 | -1,61 | 0,5433 | -0,0314 | |||
| PINS / Pinterest, Inc. | 0,07 | 2,65 | 0,5372 | 0,5372 | |||||
| AJG / Arthur J. Gallagher & Co. | 0,01 | 0,00 | 2,40 | -7,30 | 0,4860 | -0,0595 | |||
| MORN / Morningstar, Inc. | 0,01 | 0,00 | 2,35 | 4,67 | 0,4766 | 0,0028 | |||
| HEI / HEICO Corporation | 0,01 | 0,00 | 2,30 | 22,78 | 0,4648 | 0,0708 | |||
| PTC / PTC Inc. | 0,01 | 2,15 | 0,4361 | 0,4361 | |||||
| VMC / Vulcan Materials Company | 0,01 | 0,00 | 2,09 | 11,79 | 0,4224 | 0,0292 | |||
| LECO / Lincoln Electric Holdings, Inc. | 0,01 | 0,00 | 2,07 | 9,62 | 0,4197 | 0,0212 | |||
| EW / Edwards Lifesciences Corporation | 0,03 | 0,00 | 1,96 | 7,89 | 0,3958 | 0,0141 | |||
| IT / Gartner, Inc. | 0,00 | 1,86 | 0,3764 | 0,3764 | |||||
| HD / The Home Depot, Inc. | 0,01 | -66,67 | 1,83 | -66,65 | 0,3711 | -0,7871 | |||
| CMG / Chipotle Mexican Grill, Inc. | 0,03 | 0,00 | 1,68 | 11,82 | 0,3410 | 0,0237 | |||
| DTM / DT Midstream, Inc. | 0,01 | 0,00 | 1,65 | 13,89 | 0,3337 | 0,0289 | |||
| SYY / Sysco Corporation | 0,02 | 0,00 | 1,51 | 0,93 | 0,3067 | -0,0095 | |||
| CTRA / Coterra Energy Inc. | 0,05 | 0,00 | 1,27 | -12,18 | 0,2569 | -0,0475 | |||
| CLX / The Clorox Company | 0,01 | 0,00 | 1,25 | -18,48 | 0,2528 | -0,0698 | |||
| LULU / lululemon athletica inc. | 0,01 | 0,00 | 1,19 | -16,11 | 0,2405 | -0,0577 | |||
| ROST / Ross Stores, Inc. | 0,01 | 0,00 | 1,02 | -0,20 | 0,2066 | -0,0088 | |||
| CHE / Chemed Corporation | 0,00 | 0,00 | 0,97 | -20,89 | 0,1971 | -0,0621 | |||
| JBHT / J.B. Hunt Transport Services, Inc. | 0,00 | -100,00 | 0,00 | 0,0000 | |||||
| MANH / Manhattan Associates, Inc. | 0,00 | -100,00 | 0,00 | 0,0000 | |||||
| SEIC / SEI Investments Company | 0,00 | -100,00 | 0,00 | 0,0000 | |||||
| XLK / The Select Sector SPDR Trust - The Technology Select Sector SPDR Fund | 0,00 | -100,00 | 0,00 | 0,0000 | |||||
| GNTX / Gentex Corporation | 0,00 | -100,00 | 0,00 | 0,0000 | |||||
| ADP / Automatic Data Processing, Inc. | 0,00 | -100,00 | 0,00 | 0,0000 | |||||
| BRK.B / Berkshire Hathaway Inc. | 0,00 | -100,00 | 0,00 | 0,0000 | |||||
| PG / The Procter & Gamble Company | 0,00 | -100,00 | 0,00 | 0,0000 |