Statistiques de base
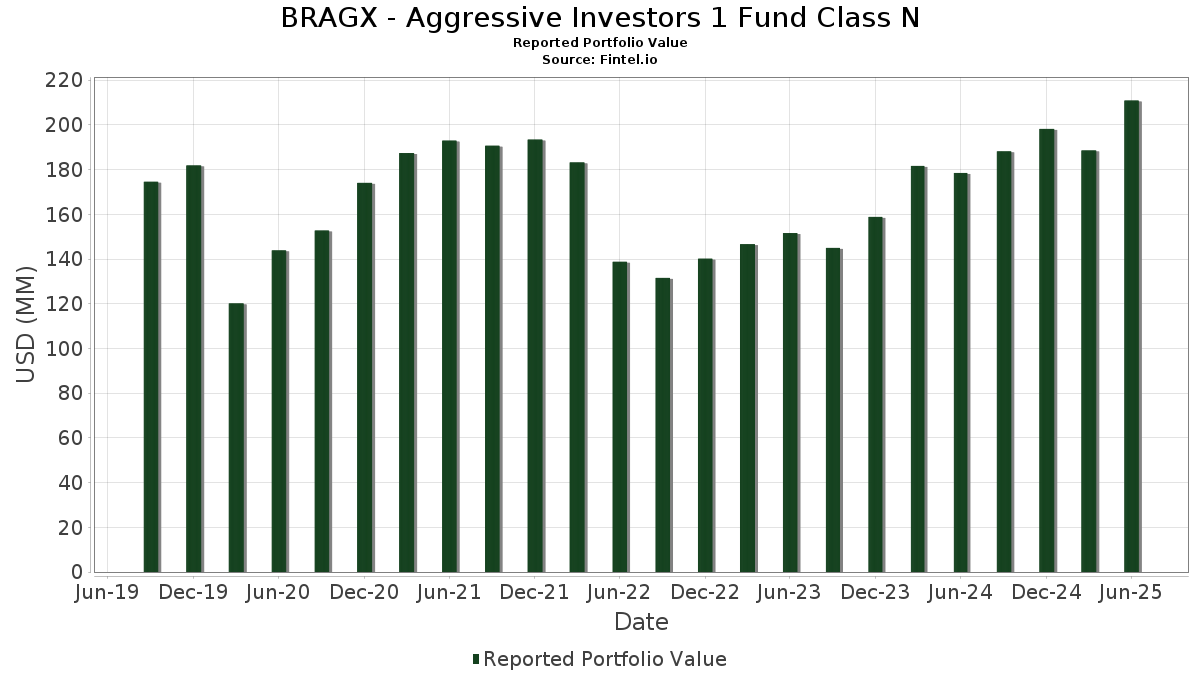
| Valeur du portefeuille | $ 210 880 133 |
| Positions actuelles | 102 |
Dernières positions, performances, ASG (à partir des dépôts 13F, 13D)
BRAGX - Aggressive Investors 1 Fund Class N a déclaré un total de 102 positions dans ses derniers dépôts auprès de la SEC. La valeur la plus récente du portefeuille est calculée à 210 880 133 USD. Les actifs sous gestion réels (ASG) sont cette valeur plus les liquidités (qui ne sont pas divulguées). Les principales positions de BRAGX - Aggressive Investors 1 Fund Class N sont NVIDIA Corporation (US:NVDA) , Microsoft Corporation (US:MSFT) , Apple Inc. (US:AAPL) , Meta Platforms, Inc. (US:META) , and Booking Holdings Inc. (US:BKNG) . Les nouvelles positions de BRAGX - Aggressive Investors 1 Fund Class N incluent Snowflake Inc. (US:SNOW) , Skyworks Solutions, Inc. (US:SWKS) , EQT Corporation (US:EQT) , Equitable Holdings, Inc. (US:EQH) , and Darden Restaurants, Inc. (US:DRI) .
Meilleures augmentations ce trimestre
Nous utilisons la variation de l'allocation du portefeuille car il s'agit de l'indicateur le plus significatif. Les changements peuvent être dus à des transactions ou à des variations de prix des actions.
| Titre | Actions (en millions) |
Valeur ($ en millions) |
% du portefeuille | ΔPortefeuille % |
|---|---|---|---|---|
| 0,01 | 2,22 | 1,0519 | 1,0519 | |
| 0,01 | 2,17 | 1,0296 | 1,0296 | |
| 0,02 | 2,12 | 1,0041 | 1,0041 | |
| 0,03 | 2,09 | 0,9898 | 0,9898 | |
| 0,04 | 2,07 | 0,9821 | 0,9821 | |
| 0,04 | 1,96 | 0,9314 | 0,9314 | |
| 0,01 | 1,96 | 0,9306 | 0,9306 | |
| 0,00 | 1,91 | 0,9038 | 0,9038 | |
| 0,02 | 1,89 | 0,8978 | 0,8978 | |
| 0,00 | 1,64 | 0,7780 | 0,7780 |
Principales baisses ce trimestre
Nous utilisons la variation de l'allocation du portefeuille car il s'agit de l'indicateur le plus significatif. Les changements peuvent être dus à des transactions ou à des variations de prix des actions.
| Titre | Actions (en millions) |
Valeur ($ en millions) |
% du portefeuille | ΔPortefeuille % |
|---|---|---|---|---|
| 0,04 | 2,03 | 0,9641 | -0,9552 | |
| 0,00 | 2,53 | 1,2012 | -0,8662 | |
| 0,00 | 1,85 | 0,8767 | -0,8500 | |
| 0,00 | 0,00 | -0,8118 | ||
| 0,00 | 0,00 | -0,7654 | ||
| 0,01 | 1,38 | 0,6538 | -0,6948 | |
| 0,00 | 0,00 | -0,6282 | ||
| 0,03 | 5,13 | 2,4331 | -0,5488 | |
| 0,01 | 5,02 | 2,3808 | -0,5283 | |
| 0,01 | 1,06 | 0,5015 | -0,4367 |
Déclarations 13F et dépôts de fonds
Ce formulaire a été déposé le 2025-08-26 pour la période de déclaration 2025-06-30. Cliquez sur l'icône du lien pour voir l'historique complet des transactions.
Mettre à niveau pour débloquer les données premium et exporter vers Excel ![]() .
.
| Titre | Type | Prix moyen de l'action | Actions (en millions) |
ΔActions (%) |
ΔActions (%) |
Valeur ($ en millions) |
Portefeuille (%) |
ΔPortefeuille (%) |
|
|---|---|---|---|---|---|---|---|---|---|
| NVDA / NVIDIA Corporation | 0,06 | -15,36 | 9,49 | 23,39 | 4,5038 | 0,3719 | |||
| MSFT / Microsoft Corporation | 0,02 | 0,00 | 8,80 | 32,51 | 4,1763 | 0,6085 | |||
| AAPL / Apple Inc. | 0,03 | 0,00 | 5,13 | -7,64 | 2,4331 | -0,5488 | |||
| META / Meta Platforms, Inc. | 0,01 | -27,66 | 5,02 | -7,35 | 2,3808 | -0,5283 | |||
| BKNG / Booking Holdings Inc. | 0,00 | 0,00 | 4,63 | 25,67 | 2,1969 | 0,2179 | |||
| AMZN / Amazon.com, Inc. | 0,02 | 0,00 | 3,77 | 15,31 | 1,7900 | 0,0328 | |||
| GOOGL / Alphabet Inc. | 0,02 | 0,00 | 3,60 | 13,98 | 1,7054 | 0,0114 | |||
| PLTR / Palantir Technologies Inc. | 0,02 | 0,00 | 3,23 | 61,50 | 1,5326 | 0,4585 | |||
| NRG / NRG Energy, Inc. | 0,02 | -15,22 | 3,13 | 42,64 | 1,4854 | 0,3064 | |||
| V / Visa Inc. | 0,01 | 0,00 | 3,09 | 1,28 | 1,4653 | -0,1719 | |||
| VST / Vistra Corp. | 0,02 | -32,31 | 3,00 | 11,71 | 1,4250 | -0,0191 | |||
| AXON / Axon Enterprise, Inc. | 0,00 | 0,00 | 2,90 | 57,45 | 1,3746 | 0,3861 | |||
| CHKP / Check Point Software Technologies Ltd. | 0,01 | 0,00 | 2,88 | -2,90 | 1,3644 | -0,2266 | |||
| FFIV / F5, Inc. | 0,01 | 0,00 | 2,80 | 10,56 | 1,3263 | -0,0320 | |||
| SYF / Synchrony Financial | 0,04 | -9,24 | 2,62 | 14,40 | 1,2442 | 0,0133 | |||
| SPOT / Spotify Technology S.A. | 0,00 | -52,86 | 2,53 | -34,23 | 1,2012 | -0,8662 | |||
| EME / EMCOR Group, Inc. | 0,00 | 0,00 | 2,51 | 44,67 | 1,1925 | 0,2597 | |||
| NFLX / Netflix, Inc. | 0,00 | -41,94 | 2,41 | 28,06 | 1,1434 | 0,1060 | |||
| CF / CF Industries Holdings, Inc. | 0,03 | 0,00 | 2,36 | 17,73 | 1,1216 | 0,0431 | |||
| LNG / Cheniere Energy, Inc. | 0,01 | 0,00 | 2,34 | 5,22 | 1,1090 | -0,0839 | |||
| CFG / Citizens Financial Group, Inc. | 0,05 | 0,00 | 2,27 | 9,23 | 1,0784 | -0,0392 | |||
| NTAP / NetApp, Inc. | 0,02 | 0,00 | 2,25 | 21,32 | 1,0665 | 0,0712 | |||
| VLO / Valero Energy Corporation | 0,02 | 0,00 | 2,24 | 1,77 | 1,0648 | -0,1195 | |||
| GL / Globe Life Inc. | 0,02 | 0,00 | 2,24 | -5,61 | 1,0612 | -0,2119 | |||
| AXP / American Express Company | 0,01 | 0,00 | 2,23 | 18,53 | 1,0592 | 0,0479 | |||
| VRSN / VeriSign, Inc. | 0,01 | 0,00 | 2,22 | 13,77 | 1,0549 | 0,0052 | |||
| CAH / Cardinal Health, Inc. | 0,01 | 2,22 | 1,0519 | 1,0519 | |||||
| EXEL / Exelixis, Inc. | 0,05 | 0,00 | 2,20 | 19,34 | 1,0454 | 0,0541 | |||
| SNOW / Snowflake Inc. | 0,01 | 2,17 | 1,0296 | 1,0296 | |||||
| NTRS / Northern Trust Corporation | 0,02 | 0,00 | 2,16 | 28,50 | 1,0224 | 0,1219 | |||
| SCHW / The Charles Schwab Corporation | 0,02 | 2,12 | 1,0041 | 1,0041 | |||||
| THC / Tenet Healthcare Corporation | 0,01 | 0,00 | 2,11 | 30,86 | 1,0018 | 0,1352 | |||
| MPC / Marathon Petroleum Corporation | 0,01 | 0,00 | 2,11 | 14,00 | 1,0007 | 0,0072 | |||
| COR / Cencora, Inc. | 0,01 | -17,65 | 2,10 | -11,21 | 0,9957 | -0,2736 | |||
| MRK / Merck & Co., Inc. | 0,03 | 0,00 | 2,09 | -11,82 | 0,9913 | -0,2811 | |||
| SWKS / Skyworks Solutions, Inc. | 0,03 | 2,09 | 0,9898 | 0,9898 | |||||
| EQT / EQT Corporation | 0,04 | 2,07 | 0,9821 | 0,9821 | |||||
| JNJ / Johnson & Johnson | 0,01 | 0,00 | 2,06 | -7,86 | 0,9782 | -0,2240 | |||
| HWM / Howmet Aerospace Inc. | 0,01 | 0,00 | 2,05 | 43,45 | 0,9712 | 0,2050 | |||
| GM / General Motors Company | 0,04 | -45,66 | 2,03 | -43,14 | 0,9641 | -0,9552 | |||
| AMAT / Applied Materials, Inc. | 0,01 | 0,00 | 2,01 | 26,13 | 0,9553 | 0,0981 | |||
| ADP / Automatic Data Processing, Inc. | 0,01 | 0,00 | 2,00 | 0,96 | 0,9509 | -0,1155 | |||
| CART / Maplebear Inc. | 0,04 | 0,00 | 1,99 | 13,39 | 0,9442 | 0,0018 | |||
| LPLA / LPL Financial Holdings Inc. | 0,01 | 0,00 | 1,99 | 14,66 | 0,9427 | 0,0117 | |||
| ABNB / Airbnb, Inc. | 0,01 | 0,00 | 1,99 | 10,83 | 0,9417 | -0,0205 | |||
| CH1300646267 / Bunge Global SA | 0,02 | 0,00 | 1,97 | 5,06 | 0,9368 | -0,0727 | |||
| RCL / Royal Caribbean Cruises Ltd. | 0,01 | 0,00 | 1,97 | 52,40 | 0,9358 | 0,2408 | |||
| EQH / Equitable Holdings, Inc. | 0,04 | 1,96 | 0,9314 | 0,9314 | |||||
| DRI / Darden Restaurants, Inc. | 0,01 | 1,96 | 0,9306 | 0,9306 | |||||
| APP / AppLovin Corporation | 0,01 | -35,29 | 1,93 | -14,52 | 0,9134 | -0,2960 | |||
| EA / Electronic Arts Inc. | 0,01 | 0,00 | 1,92 | 10,50 | 0,9091 | -0,0222 | |||
| MCK / McKesson Corporation | 0,00 | 1,91 | 0,9038 | 0,9038 | |||||
| HOLX / Hologic, Inc. | 0,03 | 0,00 | 1,90 | 5,51 | 0,8995 | -0,0657 | |||
| ORLY / O'Reilly Automotive, Inc. | 0,02 | 1,89 | 0,8978 | 0,8978 | |||||
| EBAY / eBay Inc. | 0,03 | 0,00 | 1,86 | 9,92 | 0,8830 | -0,0262 | |||
| COST / Costco Wholesale Corporation | 0,00 | -45,09 | 1,85 | -42,52 | 0,8767 | -0,8500 | |||
| OVV / Ovintiv Inc. | 0,05 | 0,00 | 1,83 | -11,06 | 0,8700 | -0,2378 | |||
| TRGP / Targa Resources Corp. | 0,01 | 0,00 | 1,83 | -13,17 | 0,8671 | -0,2632 | |||
| AMP / Ameriprise Financial, Inc. | 0,00 | 0,00 | 1,81 | 10,27 | 0,8608 | -0,0230 | |||
| USB / U.S. Bancorp | 0,04 | 0,00 | 1,81 | 7,23 | 0,8586 | -0,0482 | |||
| PPC / Pilgrim's Pride Corporation | 0,04 | 0,00 | 1,80 | -17,48 | 0,8535 | -0,3173 | |||
| DOCU / DocuSign, Inc. | 0,02 | 0,00 | 1,79 | -4,33 | 0,8498 | -0,1555 | |||
| ADBE / Adobe Inc. | 0,00 | 0,00 | 1,78 | 0,85 | 0,8442 | -0,1031 | |||
| CRM / Salesforce, Inc. | 0,01 | 0,00 | 1,75 | 1,63 | 0,8279 | -0,0944 | |||
| JBL / Jabil Inc. | 0,01 | 0,00 | 1,74 | 60,29 | 0,8277 | 0,2431 | |||
| VEEV / Veeva Systems Inc. | 0,01 | -29,41 | 1,73 | -12,25 | 0,8196 | -0,2376 | |||
| PRU / Prudential Financial, Inc. | 0,02 | 0,00 | 1,70 | -3,80 | 0,8053 | -0,1422 | |||
| EOG / EOG Resources, Inc. | 0,01 | 0,00 | 1,67 | -6,74 | 0,7943 | -0,1697 | |||
| DUOL / Duolingo, Inc. | 0,00 | 1,64 | 0,7780 | 0,7780 | |||||
| TAP / Molson Coors Beverage Company | 0,03 | 0,00 | 1,56 | -21,03 | 0,7414 | -0,3209 | |||
| UAL / United Airlines Holdings, Inc. | 0,02 | 0,00 | 1,55 | 15,30 | 0,7366 | 0,0136 | |||
| BMY / Bristol-Myers Squibb Company | 0,03 | 0,00 | 1,48 | -24,09 | 0,7027 | -0,3453 | |||
| DASH / DoorDash, Inc. | 0,01 | -23,08 | 1,48 | 91,83 | 0,7016 | 0,2167 | |||
| AVGO / Broadcom Inc. | 0,01 | -66,67 | 1,38 | -45,12 | 0,6538 | -0,6948 | |||
| NUE / Nucor Corporation | 0,01 | 0,00 | 1,33 | 7,67 | 0,6329 | -0,0327 | |||
| ROKU / Roku, Inc. | 0,01 | 1,32 | 0,6254 | 0,6254 | |||||
| EXPE / Expedia Group, Inc. | 0,01 | 0,00 | 1,32 | 0,31 | 0,6241 | -0,0799 | |||
| RY / Royal Bank of Canada | 0,01 | 0,00 | 1,32 | 16,68 | 0,6240 | 0,0188 | |||
| DVA / DaVita Inc. | 0,01 | 0,00 | 1,28 | -6,83 | 0,6082 | -0,1311 | |||
| TWLO / Twilio Inc. | 0,01 | 0,00 | 1,24 | 26,97 | 0,5899 | 0,0642 | |||
| EWBC / East West Bancorp, Inc. | 0,01 | 0,00 | 1,24 | 12,50 | 0,5892 | -0,0037 | |||
| RNR / RenaissanceRe Holdings Ltd. | 0,01 | -50,00 | 1,21 | -24,22 | 0,5761 | -0,3100 | |||
| TOST / Toast, Inc. | 0,03 | -26,67 | 1,17 | 14,72 | 0,5546 | 0,0134 | |||
| MTB / M&T Bank Corporation | 0,01 | 1,16 | 0,5521 | 0,5521 | |||||
| DINO / HF Sinclair Corporation | 0,03 | 0,00 | 1,15 | 25,00 | 0,5456 | 0,0513 | |||
| DOCS / Doximity, Inc. | 0,02 | -37,29 | 1,13 | -33,72 | 0,5383 | -0,3809 | |||
| TKO / TKO Group Holdings, Inc. | 0,01 | 1,11 | 0,5265 | 0,5265 | |||||
| IBKR / Interactive Brokers Group, Inc. | 0,02 | 300,00 | 1,11 | 33,98 | 0,5257 | 0,0811 | |||
| FHN / First Horizon Corporation | 0,05 | 0,00 | 1,10 | 9,22 | 0,5229 | -0,0193 | |||
| WSM / Williams-Sonoma, Inc. | 0,01 | -33,00 | 1,09 | -30,80 | 0,5192 | -0,3297 | |||
| FTNT / Fortinet, Inc. | 0,01 | -60,78 | 1,06 | -29,16 | 0,5015 | -0,4367 | |||
| GEN / Gen Digital Inc. | 0,04 | 1,03 | 0,4881 | 0,4881 | |||||
| AIG / American International Group, Inc. | 0,01 | 0,00 | 1,03 | -1,53 | 0,4872 | -0,0730 | |||
| HPE / Hewlett Packard Enterprise Company | 0,05 | 0,00 | 1,02 | 32,56 | 0,4850 | 0,0708 | |||
| DKS / DICK'S Sporting Goods, Inc. | 0,01 | 0,00 | 0,99 | -1,79 | 0,4692 | -0,0720 | |||
| FITB / Fifth Third Bancorp | 0,02 | 0,00 | 0,98 | 4,94 | 0,4643 | -0,0366 | |||
| RF / Regions Financial Corporation | 0,04 | 0,00 | 0,94 | 8,17 | 0,4463 | -0,0205 | |||
| ACGL / Arch Capital Group Ltd. | 0,01 | 0,00 | 0,91 | -5,31 | 0,4319 | -0,0845 | |||
| BROS / Dutch Bros Inc. | 0,01 | 0,00 | 0,88 | 10,76 | 0,4151 | -0,0092 | |||
| PAYX / Paychex, Inc. | 0,01 | 0,87 | 0,4140 | 0,4140 | |||||
| FI / Fiserv, Inc. | 0,00 | 0,00 | 0,78 | -21,95 | 0,3680 | -0,1656 | |||
| FIGXX / Fidelity Colchester Street Trust - Fidelity Institutional Money Market Funds Government Portfolio Class I | 0,37 | -53,54 | 0,37 | -53,61 | 0,1772 | -0,2546 | |||
| TSLA / Tesla, Inc. | 0,00 | -100,00 | 0,00 | -100,00 | -0,7654 | ||||
| SOFI / SoFi Technologies, Inc. | 0,00 | -100,00 | 0,00 | -100,00 | -0,8118 | ||||
| MRVL / Marvell Technology, Inc. | 0,00 | -100,00 | 0,00 | -100,00 | -0,6282 |