Statistiques de base
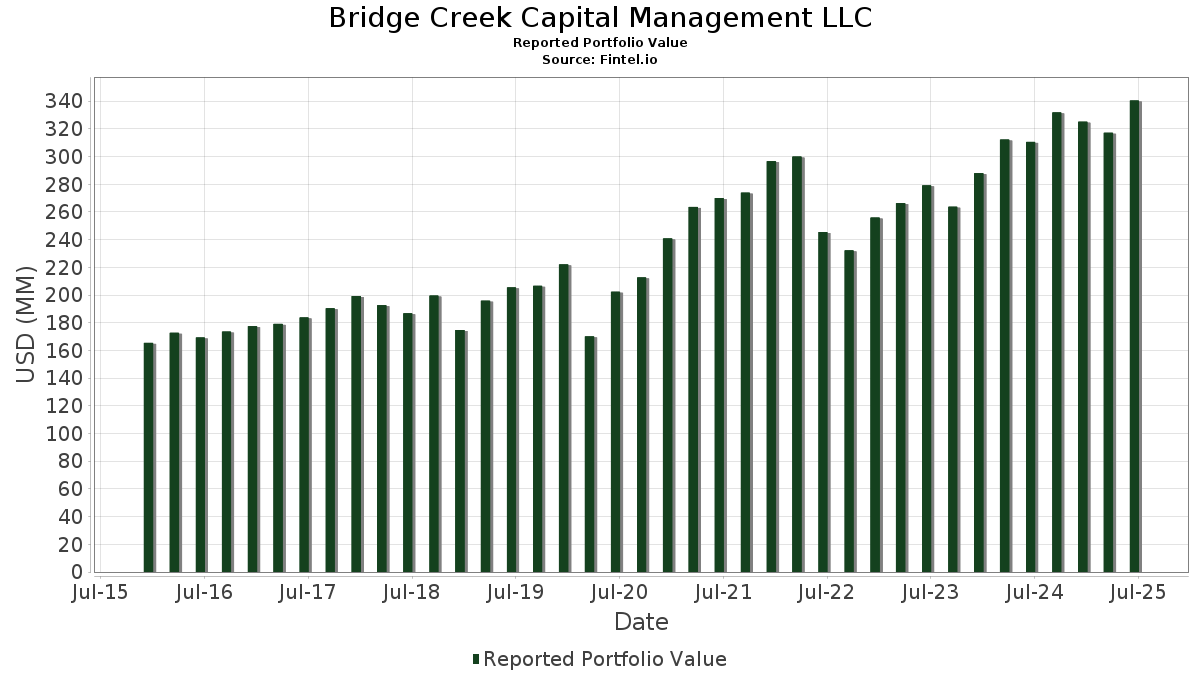
| Valeur du portefeuille | $ 340 396 665 |
| Positions actuelles | 111 |
Dernières positions, performances, ASG (à partir des dépôts 13F, 13D)
Bridge Creek Capital Management LLC a déclaré un total de 111 positions dans ses derniers dépôts auprès de la SEC. La valeur la plus récente du portefeuille est calculée à 340 396 665 USD. Les actifs sous gestion réels (ASG) sont cette valeur plus les liquidités (qui ne sont pas divulguées). Les principales positions de Bridge Creek Capital Management LLC sont Microsoft Corporation (US:MSFT) , Apple Inc. (US:AAPL) , JPMorgan Chase & Co. (US:JPM) , Bank of America Corporation (US:BAC) , and Blackstone Inc. (US:BX) . Les nouvelles positions de Bridge Creek Capital Management LLC incluent Old Dominion Freight Line, Inc. (MX:ODFL) , Vanguard International Equity Index Funds - Vanguard FTSE All-World ex-US ETF (US:VEU) , Amphenol Corporation (US:APH) , .
Meilleures augmentations ce trimestre
Nous utilisons la variation de l'allocation du portefeuille car il s'agit de l'indicateur le plus significatif. Les changements peuvent être dus à des transactions ou à des variations de prix des actions.
| Titre | Actions (en millions) |
Valeur ($ en millions) |
% du portefeuille | ΔPortefeuille % |
|---|---|---|---|---|
| 0,03 | 13,32 | 3,9133 | 0,7030 | |
| 0,04 | 5,56 | 1,6342 | 0,6962 | |
| 0,01 | 3,91 | 1,1497 | 0,4470 | |
| 0,03 | 6,81 | 2,0010 | 0,2916 | |
| 0,04 | 5,26 | 1,5461 | 0,2463 | |
| 0,01 | 2,63 | 0,7714 | 0,2245 | |
| 0,04 | 11,88 | 3,4904 | 0,2125 | |
| 0,02 | 6,89 | 2,0235 | 0,2103 | |
| 0,01 | 4,56 | 1,3405 | 0,1960 | |
| 0,04 | 7,76 | 2,2796 | 0,1928 |
Principales baisses ce trimestre
Nous utilisons la variation de l'allocation du portefeuille car il s'agit de l'indicateur le plus significatif. Les changements peuvent être dus à des transactions ou à des variations de prix des actions.
| Titre | Actions (en millions) |
Valeur ($ en millions) |
% du portefeuille | ΔPortefeuille % |
|---|---|---|---|---|
| 0,06 | 12,04 | 3,5365 | -0,5371 | |
| 0,10 | 1,04 | 0,3059 | -0,2545 | |
| 0,08 | 5,87 | 1,7239 | -0,2500 | |
| 0,04 | 5,62 | 1,6512 | -0,2459 | |
| 0,04 | 5,25 | 1,5433 | -0,2389 | |
| 0,03 | 5,45 | 1,6003 | -0,2168 | |
| 0,02 | 3,57 | 1,0485 | -0,2072 | |
| 0,08 | 4,03 | 1,1842 | -0,1874 | |
| 0,04 | 3,97 | 1,1655 | -0,1644 | |
| 0,10 | 6,68 | 1,9627 | -0,1595 |
Déclarations 13F et dépôts de fonds
Ce formulaire a été déposé le 2025-07-11 pour la période de déclaration 2025-06-30. Cliquez sur l'icône du lien pour voir l'historique complet des transactions.
Mettre à niveau pour débloquer les données premium et exporter vers Excel ![]() .
.
| Titre | Type | Prix moyen de l'action | Actions (en millions) |
ΔActions (%) |
ΔActions (%) |
Valeur ($ en millions) |
Portefeuille (%) |
ΔPortefeuille (%) |
|
|---|---|---|---|---|---|---|---|---|---|
| MSFT / Microsoft Corporation | 0,03 | -1,25 | 13,32 | 30,84 | 3,9133 | 0,7030 | |||
| AAPL / Apple Inc. | 0,06 | 0,89 | 12,04 | -6,81 | 3,5365 | -0,5371 | |||
| JPM / JPMorgan Chase & Co. | 0,04 | -3,29 | 11,88 | 14,30 | 3,4904 | 0,2125 | |||
| BAC / Bank of America Corporation | 0,18 | -1,03 | 8,56 | 12,24 | 2,5156 | 0,1097 | |||
| BX / Blackstone Inc. | 0,06 | 1,73 | 8,50 | 8,86 | 2,4979 | 0,0350 | |||
| GOOGL / Alphabet Inc. | 0,05 | 0,09 | 8,44 | 13,65 | 2,4798 | 0,1378 | |||
| AMZN / Amazon.com, Inc. | 0,04 | 1,68 | 7,76 | 17,24 | 2,2796 | 0,1928 | |||
| CAT / Caterpillar Inc. | 0,02 | 1,76 | 6,89 | 19,79 | 2,0235 | 0,2103 | |||
| GE / General Electric Company | 0,03 | -2,30 | 6,81 | 25,64 | 2,0010 | 0,2916 | |||
| NEE / NextEra Energy, Inc. | 0,10 | 1,37 | 6,68 | -0,73 | 1,9627 | -0,1595 | |||
| FAST / Fastenal Company | 0,16 | 98,42 | 6,57 | 7,47 | 1,9313 | 0,0022 | |||
| WMT / Walmart Inc. | 0,06 | -0,17 | 6,08 | 11,18 | 1,7849 | 0,0619 | |||
| KO / The Coca-Cola Company | 0,09 | 0,03 | 6,07 | -1,19 | 1,7832 | -0,1537 | |||
| MKC / McCormick & Company, Incorporated | 0,08 | 1,77 | 5,87 | -6,25 | 1,7239 | -0,2500 | |||
| GLW / Corning Incorporated | 0,11 | 1,25 | 5,83 | 16,31 | 1,7116 | 0,1320 | |||
| JNJ / Johnson & Johnson | 0,04 | 1,43 | 5,62 | -6,58 | 1,6512 | -0,2459 | |||
| NVDA / NVIDIA Corporation | 0,04 | 28,28 | 5,56 | 87,02 | 1,6342 | 0,6962 | |||
| CRM / Salesforce, Inc. | 0,02 | 1,89 | 5,50 | 3,52 | 1,6152 | -0,0593 | |||
| GJR / Strats Trust For Procter & Gambel Security - Preferred Security | 0,03 | 1,12 | 5,45 | -5,47 | 1,6003 | -0,2168 | |||
| PNC / The PNC Financial Services Group, Inc. | 0,03 | 0,57 | 5,42 | 6,68 | 1,5911 | -0,0100 | |||
| SO / The Southern Company | 0,06 | 0,68 | 5,41 | 0,54 | 1,5905 | -0,1074 | |||
| CL / Colgate-Palmolive Company | 0,06 | 1,56 | 5,30 | -1,49 | 1,5558 | -0,1391 | |||
| DIS / The Walt Disney Company | 0,04 | 1,62 | 5,26 | 27,69 | 1,5461 | 0,2463 | |||
| PEP / PepsiCo, Inc. | 0,04 | 5,55 | 5,25 | -7,04 | 1,5433 | -0,2389 | |||
| STAG / STAG Industrial, Inc. | 0,14 | 0,90 | 5,24 | 1,33 | 1,5393 | -0,0911 | |||
| C / Citigroup Inc. | 0,06 | -0,44 | 5,21 | 19,38 | 1,5311 | 0,1544 | |||
| TFC / Truist Financial Corporation | 0,11 | 0,54 | 4,91 | 5,03 | 1,4423 | -0,0316 | |||
| STT / State Street Corporation | 0,04 | -1,15 | 4,65 | 17,43 | 1,3659 | 0,1172 | |||
| META / Meta Platforms, Inc. | 0,01 | -1,83 | 4,56 | 25,71 | 1,3405 | 0,1960 | |||
| T / AT&T Inc. | 0,16 | -0,12 | 4,52 | 2,22 | 1,3285 | -0,0666 | |||
| CVS / CVS Health Corporation | 0,06 | 1,84 | 4,21 | 3,69 | 1,2376 | -0,0435 | |||
| D / Dominion Energy, Inc. | 0,07 | 0,93 | 4,18 | 1,73 | 1,2273 | -0,0675 | |||
| ATR / AptarGroup, Inc. | 0,03 | 0,97 | 4,12 | 6,44 | 1,2091 | -0,0101 | |||
| UPS / United Parcel Service, Inc. | 0,04 | 9,43 | 4,09 | 0,44 | 1,2021 | -0,0827 | |||
| GIS / General Mills, Inc. | 0,08 | 6,94 | 4,03 | -7,34 | 1,1842 | -0,1874 | |||
| UNP / Union Pacific Corporation | 0,02 | 1,28 | 4,00 | -1,36 | 1,1760 | -0,1037 | |||
| XOM / Exxon Mobil Corporation | 0,04 | 3,78 | 3,97 | -5,93 | 1,1655 | -0,1644 | |||
| XEL / Xcel Energy Inc. | 0,06 | 0,45 | 3,97 | -3,36 | 1,1650 | -0,1291 | |||
| APD / Air Products and Chemicals, Inc. | 0,01 | 2,81 | 3,92 | -1,68 | 1,1524 | -0,1056 | |||
| GEV / GE Vernova Inc. | 0,01 | 1,32 | 3,91 | 75,63 | 1,1497 | 0,4470 | |||
| TXN / Texas Instruments Incorporated | 0,02 | 2,76 | 3,81 | 18,72 | 1,1200 | 0,1074 | |||
| VZ / Verizon Communications Inc. | 0,09 | 1,71 | 3,78 | -2,98 | 1,1105 | -0,1181 | |||
| SHEL / Shell plc - Depositary Receipt (Common Stock) | 0,05 | 0,73 | 3,74 | -3,21 | 1,0991 | -0,1198 | |||
| MDT / Medtronic plc | 0,04 | 1,53 | 3,66 | -1,51 | 1,0738 | -0,0965 | |||
| FHN / First Horizon Corporation | 0,17 | 0,08 | 3,60 | 9,26 | 1,0567 | 0,0185 | |||
| LOW / Lowe's Companies, Inc. | 0,02 | 0,84 | 3,59 | -4,09 | 1,0540 | -0,1253 | |||
| CVX / Chevron Corporation | 0,02 | 4,71 | 3,57 | -10,40 | 1,0485 | -0,2072 | |||
| HD / The Home Depot, Inc. | 0,01 | 1,56 | 3,46 | 1,61 | 1,0168 | -0,0574 | |||
| CMCSA / Comcast Corporation | 0,09 | 2,11 | 3,37 | -1,23 | 0,9910 | -0,0860 | |||
| AWK / American Water Works Company, Inc. | 0,02 | 0,71 | 3,24 | -5,02 | 0,9505 | -0,1237 | |||
| ORA / Ormat Technologies, Inc. | 0,04 | 0,25 | 3,07 | 18,66 | 0,9022 | 0,0860 | |||
| COST / Costco Wholesale Corporation | 0,00 | 0,31 | 2,88 | 5,00 | 0,8448 | -0,0189 | |||
| HSIC / Henry Schein, Inc. | 0,04 | 0,74 | 2,87 | 7,44 | 0,8444 | 0,0009 | |||
| NSC / Norfolk Southern Corporation | 0,01 | 3,37 | 2,87 | 11,70 | 0,8419 | 0,0330 | |||
| MFC / Manulife Financial Corporation | 0,09 | -0,61 | 2,85 | 1,97 | 0,8360 | -0,0440 | |||
| ZBH / Zimmer Biomet Holdings, Inc. | 0,03 | 12,29 | 2,75 | -9,52 | 0,8074 | -0,1503 | |||
| AME / AMETEK, Inc. | 0,01 | 1,80 | 2,67 | 7,02 | 0,7836 | -0,0024 | |||
| ORCL / Oracle Corporation | 0,01 | -3,18 | 2,63 | 51,38 | 0,7714 | 0,2245 | |||
| CSCO / Cisco Systems, Inc. | 0,04 | -0,54 | 2,58 | 11,86 | 0,7565 | 0,0304 | |||
| BHP / BHP Group Limited - Depositary Receipt (Common Stock) | 0,05 | 1,21 | 2,51 | 0,24 | 0,7388 | -0,0521 | |||
| GEHC / GE HealthCare Technologies Inc. | 0,03 | 58,21 | 2,36 | 45,26 | 0,6931 | 0,1807 | |||
| TFX / Teleflex Incorporated | 0,02 | 7,13 | 2,29 | -8,24 | 0,6741 | -0,1144 | |||
| DHR / Danaher Corporation | 0,01 | 1,04 | 2,18 | -2,63 | 0,6415 | -0,0657 | |||
| TMO / Thermo Fisher Scientific Inc. | 0,00 | 21,13 | 2,01 | -1,28 | 0,5914 | -0,0518 | |||
| HON / Honeywell International Inc. | 0,01 | 9,61 | 1,94 | 20,56 | 0,5703 | 0,0625 | |||
| MRK / Merck & Co., Inc. | 0,02 | 3,36 | 1,72 | -8,86 | 0,5048 | -0,0896 | |||
| ALB / Albemarle Corporation | 0,03 | 14,24 | 1,61 | -0,62 | 0,4718 | -0,0376 | |||
| LLY / Eli Lilly and Company | 0,00 | -0,31 | 1,52 | -5,93 | 0,4477 | -0,0630 | |||
| CTVA / Corteva, Inc. | 0,02 | -0,16 | 1,48 | 18,28 | 0,4355 | 0,0402 | |||
| ADI / Analog Devices, Inc. | 0,01 | -1,04 | 1,41 | 16,86 | 0,4135 | 0,0335 | |||
| IBM / International Business Machines Corporation | 0,00 | -0,80 | 1,29 | 17,64 | 0,3782 | 0,0330 | |||
| F / Ford Motor Company | 0,10 | -45,84 | 1,04 | -41,42 | 0,3059 | -0,2545 | |||
| VOD / Vodafone Group Public Limited Company - Depositary Receipt (Common Stock) | 0,08 | -13,98 | 0,88 | -2,12 | 0,2576 | -0,0249 | |||
| PSX / Phillips 66 | 0,01 | 0,00 | 0,84 | -3,34 | 0,2462 | -0,0273 | |||
| GOOGL / Alphabet Inc. | 0,00 | 0,00 | 0,83 | 13,95 | 0,2449 | 0,0142 | |||
| COP / ConocoPhillips | 0,01 | 0,00 | 0,74 | -14,58 | 0,2170 | -0,0556 | |||
| HSY / The Hershey Company | 0,00 | 8,71 | 0,73 | 5,53 | 0,2130 | -0,0038 | |||
| VITS.X / Vanguard Index Funds - Vanguard Total Stock Market ETF | 0,00 | -2,35 | 0,68 | 7,94 | 0,2000 | 0,0012 | |||
| VIG / Vanguard Specialized Funds - Vanguard Dividend Appreciation ETF | 0,00 | 3,29 | 0,67 | 8,90 | 0,1980 | 0,0030 | |||
| ODFL / Old Dominion Freight Line, Inc. | 0,00 | 0,62 | 0,1819 | 0,1819 | |||||
| BRK.A / Berkshire Hathaway Inc. | 0,00 | -0,39 | 0,62 | -9,14 | 0,1811 | -0,0329 | |||
| WFC / Wells Fargo & Company | 0,01 | 0,00 | 0,59 | 11,49 | 0,1742 | 0,0067 | |||
| SLB / Schlumberger Limited | 0,02 | 0,00 | 0,59 | -19,20 | 0,1733 | -0,0567 | |||
| VPU / Vanguard World Fund - Vanguard Utilities ETF | 0,00 | 0,80 | 0,44 | 4,23 | 0,1305 | -0,0040 | |||
| EMR / Emerson Electric Co. | 0,00 | 0,00 | 0,44 | 21,61 | 0,1291 | 0,0151 | |||
| QQQ / Invesco QQQ Trust, Series 1 | 0,00 | 11,10 | 0,43 | 30,70 | 0,1266 | 0,0226 | |||
| VEA / Vanguard Tax-Managed Funds - Vanguard FTSE Developed Markets ETF | 0,01 | 6,88 | 0,41 | 19,71 | 0,1215 | 0,0127 | |||
| ABT / Abbott Laboratories | 0,00 | 0,00 | 0,41 | 2,48 | 0,1215 | -0,0057 | |||
| VXUS / Vanguard STAR Funds - Vanguard Total International Stock ETF | 0,01 | 0,00 | 0,41 | 11,23 | 0,1194 | 0,0042 | |||
| RSP / Invesco Exchange-Traded Fund Trust - Invesco S&P 500 Equal Weight ETF | 0,00 | 5,23 | 0,39 | 10,57 | 0,1138 | 0,0032 | |||
| VGT / Vanguard World Fund - Vanguard Information Technology ETF | 0,00 | 5,77 | 0,38 | 29,21 | 0,1107 | 0,0188 | |||
| EMXC / iShares, Inc. - iShares MSCI Emerging Markets ex China ETF | 0,01 | 0,71 | 0,36 | 15,43 | 0,1055 | 0,0074 | |||
| MDLZ / Mondelez International, Inc. | 0,01 | 1,49 | 0,35 | 0,88 | 0,1014 | -0,0065 | |||
| K / Kellanova | 0,00 | 0,00 | 0,34 | -3,67 | 0,1005 | -0,0114 | |||
| BP / BP p.l.c. - Depositary Receipt (Common Stock) | 0,01 | 0,00 | 0,32 | -11,51 | 0,0952 | -0,0202 | |||
| SHW / The Sherwin-Williams Company | 0,00 | 0,00 | 0,31 | -1,57 | 0,0923 | -0,0085 | |||
| BA / The Boeing Company | 0,00 | -1,64 | 0,31 | 20,85 | 0,0922 | 0,0103 | |||
| WELL / Welltower Inc. | 0,00 | 0,00 | 0,30 | 0,33 | 0,0882 | -0,0062 | |||
| DUK / Duke Energy Corporation | 0,00 | 0,00 | 0,27 | -3,20 | 0,0800 | -0,0088 | |||
| AMT / American Tower Corporation | 0,00 | -0,82 | 0,27 | 0,75 | 0,0788 | -0,0052 | |||
| AVGO / Broadcom Inc. | 0,00 | 0,27 | 0,0781 | 0,0781 | |||||
| BMY / Bristol-Myers Squibb Company | 0,01 | -5,13 | 0,26 | -28,09 | 0,0755 | -0,0370 | |||
| VEU / Vanguard International Equity Index Funds - Vanguard FTSE All-World ex-US ETF | 0,00 | 0,26 | 0,0750 | 0,0750 | |||||
| CLX / The Clorox Company | 0,00 | 0,00 | 0,24 | -18,58 | 0,0711 | -0,0225 | |||
| EVX / VanEck ETF Trust - VanEck Environmental Services ETF | 0,01 | 1,61 | 0,24 | 10,05 | 0,0709 | 0,0016 | |||
| VDE / Vanguard World Fund - Vanguard Energy ETF | 0,00 | 4,44 | 0,24 | -4,03 | 0,0699 | -0,0083 | |||
| SNA / Snap-on Incorporated | 0,00 | 0,00 | 0,22 | -7,66 | 0,0640 | -0,0104 | |||
| APH / Amphenol Corporation | 0,00 | 0,22 | 0,0638 | 0,0638 | |||||
| VFH / Vanguard World Fund - Vanguard Financials ETF | 0,00 | 0,21 | 0,0622 | 0,0622 | |||||
| VIS / Vanguard World Fund - Vanguard Industrials ETF | 0,00 | 0,21 | 0,0605 | 0,0605 | |||||
| VCR / Vanguard World Fund - Vanguard Consumer Discretionary ETF | 0,00 | 0,20 | 0,0596 | 0,0596 | |||||
| AMGN / Amgen Inc. | 0,00 | -100,00 | 0,00 | 0,0000 |