Statistiques de base
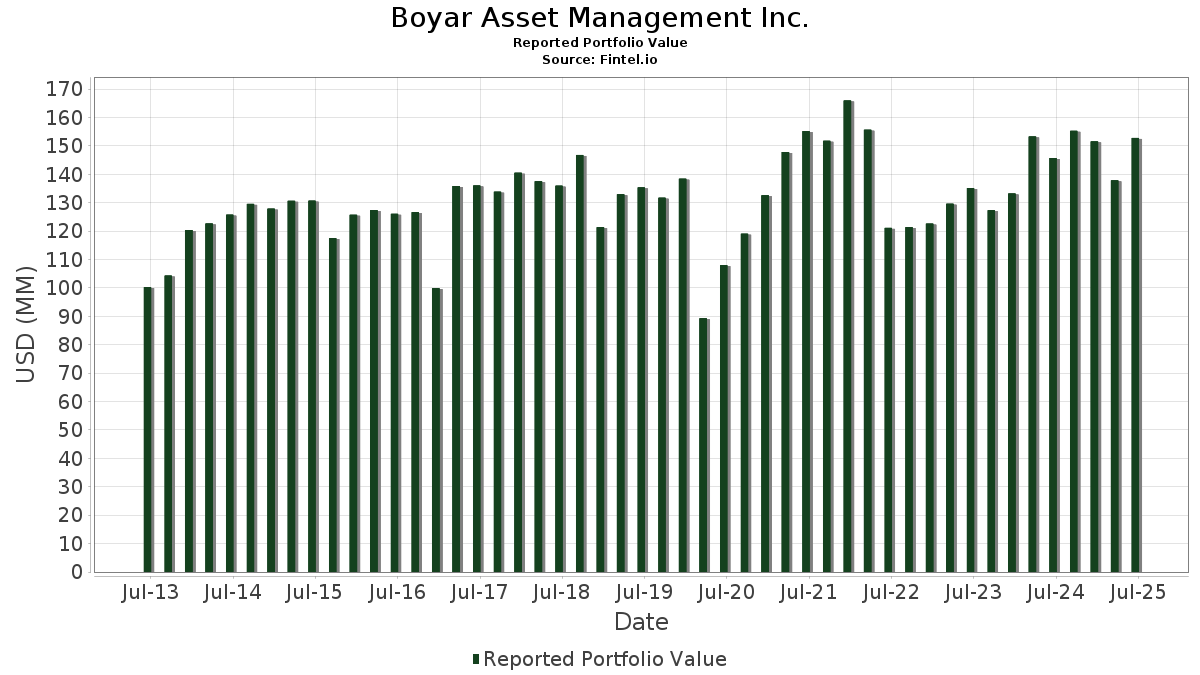
| Valeur du portefeuille | $ 152 816 773 |
| Positions actuelles | 79 |
Dernières positions, performances, ASG (à partir des dépôts 13F, 13D)
Boyar Asset Management Inc. a déclaré un total de 79 positions dans ses derniers dépôts auprès de la SEC. La valeur la plus récente du portefeuille est calculée à 152 816 773 USD. Les actifs sous gestion réels (ASG) sont cette valeur plus les liquidités (qui ne sont pas divulguées). Les principales positions de Boyar Asset Management Inc. sont Microsoft Corporation (US:MSFT) , JPMorgan Chase & Co. (US:JPM) , Ameriprise Financial, Inc. (US:AMP) , The Home Depot, Inc. (US:HD) , and Uber Technologies, Inc. (US:UBER) . Les nouvelles positions de Boyar Asset Management Inc. incluent Citizens Financial Group, Inc. (US:CFG) , Dave & Buster's Entertainment, Inc. (US:PLAY) , .
Meilleures augmentations ce trimestre
Nous utilisons la variation de l'allocation du portefeuille car il s'agit de l'indicateur le plus significatif. Les changements peuvent être dus à des transactions ou à des variations de prix des actions.
| Titre | Actions (en millions) |
Valeur ($ en millions) |
% du portefeuille | ΔPortefeuille % |
|---|---|---|---|---|
| 0,04 | 20,90 | 13,6769 | 2,0983 | |
| 0,09 | 8,39 | 5,4901 | 0,6935 | |
| 0,05 | 14,73 | 9,6385 | 0,5705 | |
| 0,03 | 3,79 | 2,4795 | 0,2873 | |
| 0,15 | 7,17 | 4,6936 | 0,2071 | |
| 0,04 | 1,80 | 1,1760 | 0,1785 | |
| 0,00 | 0,27 | 0,1771 | 0,1771 | |
| 0,00 | 0,24 | 0,1600 | 0,1600 | |
| 0,00 | 0,96 | 0,6287 | 0,1514 | |
| 0,01 | 0,23 | 0,1511 | 0,1511 |
Principales baisses ce trimestre
Nous utilisons la variation de l'allocation du portefeuille car il s'agit de l'indicateur le plus significatif. Les changements peuvent être dus à des transactions ou à des variations de prix des actions.
| Titre | Actions (en millions) |
Valeur ($ en millions) |
% du portefeuille | ΔPortefeuille % |
|---|---|---|---|---|
| 0,02 | 9,15 | 5,9853 | -0,6815 | |
| 0,02 | 1,07 | 0,7017 | -0,4039 | |
| 0,02 | 2,56 | 1,6778 | -0,3411 | |
| 0,09 | 3,21 | 2,1024 | -0,3098 | |
| 0,02 | 1,54 | 1,0077 | -0,2734 | |
| 0,09 | 2,19 | 1,4323 | -0,2335 | |
| 0,05 | 3,10 | 2,0283 | -0,2333 | |
| 0,01 | 1,56 | 1,0219 | -0,1891 | |
| 0,01 | 0,98 | 0,6395 | -0,1531 | |
| 0,00 | 0,96 | 0,6313 | -0,1474 |
Déclarations 13F et dépôts de fonds
Ce formulaire a été déposé le 2025-07-21 pour la période de déclaration 2025-06-30. Cliquez sur l'icône du lien pour voir l'historique complet des transactions.
Mettre à niveau pour débloquer les données premium et exporter vers Excel ![]() .
.
| Titre | Type | Prix moyen de l'action | Actions (en millions) |
ΔActions (%) |
ΔActions (%) |
Valeur ($ en millions) |
Portefeuille (%) |
ΔPortefeuille (%) |
|
|---|---|---|---|---|---|---|---|---|---|
| MSFT / Microsoft Corporation | 0,04 | -1,19 | 20,90 | 30,92 | 13,6769 | 2,0983 | |||
| JPM / JPMorgan Chase & Co. | 0,05 | -0,32 | 14,73 | 17,81 | 9,6385 | 0,5705 | |||
| AMP / Ameriprise Financial, Inc. | 0,02 | -0,63 | 10,76 | 9,56 | 7,0441 | -0,0822 | |||
| HD / The Home Depot, Inc. | 0,02 | -0,53 | 9,15 | -0,49 | 5,9853 | -0,6815 | |||
| UBER / Uber Technologies, Inc. | 0,09 | -0,93 | 8,39 | 26,86 | 5,4901 | 0,6935 | |||
| BAC / Bank of America Corporation | 0,15 | 2,26 | 7,17 | 15,96 | 4,6936 | 0,2071 | |||
| BK / The Bank of New York Mellon Corporation | 0,05 | -1,68 | 4,52 | 6,80 | 2,9602 | -0,1117 | |||
| MSGS / Madison Square Garden Sports Corp. | 0,02 | 1,89 | 4,31 | 9,33 | 2,8220 | -0,0387 | |||
| CSCO / Cisco Systems, Inc. | 0,06 | -1,03 | 3,94 | 11,28 | 2,5758 | 0,0102 | |||
| DIS / The Walt Disney Company | 0,03 | -0,23 | 3,79 | 25,38 | 2,4795 | 0,2873 | |||
| CMCSA / Comcast Corporation | 0,09 | -0,12 | 3,21 | -3,40 | 2,1024 | -0,3098 | |||
| MDLZ / Mondelez International, Inc. | 0,05 | 0,01 | 3,10 | -0,61 | 2,0283 | -0,2333 | |||
| JNJ / Johnson & Johnson | 0,02 | 0,01 | 2,56 | -7,91 | 1,6778 | -0,3411 | |||
| BATRK / Atlanta Braves Holdings, Inc. | 0,05 | 4,24 | 2,37 | 21,82 | 1,5495 | 0,1401 | |||
| MAR / Marriott International, Inc. | 0,01 | 0,00 | 2,27 | 14,71 | 1,4851 | 0,0500 | |||
| PFE / Pfizer Inc. | 0,09 | -0,37 | 2,19 | -4,70 | 1,4323 | -0,2335 | |||
| SMG / The Scotts Miracle-Gro Company | 0,03 | 1,04 | 1,85 | 21,43 | 1,2131 | 0,1057 | |||
| MSGE / Madison Square Garden Entertainment Corp. | 0,05 | 2,85 | 1,82 | 25,53 | 1,1942 | 0,1400 | |||
| SPHR / Sphere Entertainment Co. | 0,04 | 2,29 | 1,80 | 30,69 | 1,1760 | 0,1785 | |||
| GOOGL / Alphabet Inc. | 0,01 | 7,39 | 1,76 | 22,38 | 1,1486 | 0,1083 | |||
| BR / Broadridge Financial Solutions, Inc. | 0,01 | 0,01 | 1,75 | 0,23 | 1,1421 | -0,1207 | |||
| SYY / Sysco Corporation | 0,02 | -0,36 | 1,66 | 0,61 | 1,0878 | -0,1111 | |||
| MCD / McDonald's Corporation | 0,01 | 0,00 | 1,56 | -6,47 | 1,0219 | -0,1891 | |||
| UPS / United Parcel Service, Inc. | 0,02 | -5,00 | 1,54 | -12,85 | 1,0077 | -0,2734 | |||
| MWA / Mueller Water Products, Inc. | 0,06 | 3,37 | 1,54 | -2,23 | 1,0056 | -0,1345 | |||
| KO / The Coca-Cola Company | 0,02 | -0,34 | 1,53 | -1,55 | 0,9998 | -0,1258 | |||
| AXP / American Express Company | 0,00 | 0,00 | 1,52 | 18,52 | 0,9932 | 0,0647 | |||
| SSNC / SS&C Technologies Holdings, Inc. | 0,02 | 2,06 | 1,42 | 1,14 | 0,9308 | -0,0890 | |||
| WM / Waste Management, Inc. | 0,01 | -2,47 | 1,35 | -3,64 | 0,8851 | -0,1326 | |||
| C / Citigroup Inc. | 0,02 | -13,52 | 1,35 | 3,76 | 0,8841 | -0,0609 | |||
| CVS / CVS Health Corporation | 0,02 | 1,87 | 1,30 | 3,77 | 0,8477 | -0,0582 | |||
| GOLF / Acushnet Holdings Corp. | 0,02 | 3,37 | 1,17 | 9,64 | 0,7666 | -0,0084 | |||
| BMY / Bristol-Myers Squibb Company | 0,02 | -7,31 | 1,07 | -29,66 | 0,7017 | -0,4039 | |||
| MTCH / Match Group, Inc. | 0,03 | 0,51 | 1,05 | -0,57 | 0,6890 | -0,0784 | |||
| LH / Labcorp Holdings Inc. | 0,00 | 2,78 | 1,05 | 15,93 | 0,6859 | 0,0301 | |||
| GPN / Global Payments Inc. | 0,01 | 32,93 | 0,98 | 8,65 | 0,6417 | -0,0129 | |||
| TGT / Target Corporation | 0,01 | -5,40 | 0,98 | -10,53 | 0,6395 | -0,1531 | |||
| BRK.B / Berkshire Hathaway Inc. | 0,00 | -1,49 | 0,96 | -10,16 | 0,6313 | -0,1474 | |||
| MKL / Markel Group Inc. | 0,00 | 36,65 | 0,96 | 45,90 | 0,6287 | 0,1514 | |||
| MODG / Topgolf Callaway Brands Corp. | 0,12 | 5,00 | 0,93 | 28,31 | 0,6083 | 0,0826 | |||
| TRIP / Tripadvisor, Inc. | 0,06 | -1,20 | 0,79 | -9,02 | 0,5153 | -0,1124 | |||
| INTC / Intel Corporation | 0,03 | -6,05 | 0,77 | -7,31 | 0,5062 | -0,0993 | |||
| CB / Chubb Limited | 0,00 | 0,47 | 0,75 | -3,62 | 0,4884 | -0,0732 | |||
| HHH / Howard Hughes Holdings Inc. | 0,01 | -3,93 | 0,74 | -12,47 | 0,4824 | -0,1284 | |||
| WBD / Warner Bros. Discovery, Inc. | 0,06 | -12,59 | 0,72 | -6,72 | 0,4730 | -0,0886 | |||
| PRGO / Perrigo Company plc | 0,03 | 2,78 | 0,72 | -2,04 | 0,4706 | -0,0620 | |||
| MGM / MGM Resorts International | 0,02 | 0,00 | 0,69 | 16,10 | 0,4487 | 0,0201 | |||
| EBAY / eBay Inc. | 0,01 | -3,62 | 0,65 | 6,01 | 0,4274 | -0,0197 | |||
| IAC / IAC Inc. | 0,02 | 5,40 | 0,63 | -14,34 | 0,4143 | -0,1217 | |||
| AAPL / Apple Inc. | 0,00 | 0,00 | 0,63 | -7,62 | 0,4123 | -0,0825 | |||
| KVUE / Kenvue Inc. | 0,03 | 0,78 | 0,62 | -12,04 | 0,4065 | -0,1057 | |||
| MDT / Medtronic plc | 0,01 | 8,94 | 0,54 | 5,71 | 0,3519 | -0,0172 | |||
| NWSA / News Corporation | 0,02 | 15,41 | 0,52 | 26,09 | 0,3418 | 0,0412 | |||
| IBM / International Business Machines Corporation | 0,00 | 0,00 | 0,48 | 18,38 | 0,3166 | 0,0206 | |||
| GLW / Corning Incorporated | 0,01 | 3,44 | 0,46 | 18,77 | 0,3026 | 0,0203 | |||
| NDAQ / Nasdaq, Inc. | 0,00 | -8,42 | 0,44 | 7,90 | 0,2865 | -0,0077 | |||
| VZ / Verizon Communications Inc. | 0,01 | 0,00 | 0,42 | -4,54 | 0,2758 | -0,0447 | |||
| GD / General Dynamics Corporation | 0,00 | 3,29 | 0,42 | 10,50 | 0,2758 | -0,0008 | |||
| GEHC / GE HealthCare Technologies Inc. | 0,01 | 5,83 | 0,42 | -2,78 | 0,2746 | -0,0388 | |||
| MRK / Merck & Co., Inc. | 0,00 | -1,32 | 0,37 | -13,05 | 0,2447 | -0,0669 | |||
| GOOG / Alphabet Inc. | 0,00 | 0,00 | 0,35 | 13,46 | 0,2322 | 0,0055 | |||
| SCHW / The Charles Schwab Corporation | 0,00 | -1,90 | 0,35 | 14,24 | 0,2314 | 0,0071 | |||
| TSQ / Townsquare Media, Inc. | 0,04 | 17,67 | 0,34 | 14,29 | 0,2202 | 0,0067 | |||
| WEN / The Wendy's Company | 0,03 | 0,02 | 0,32 | -21,87 | 0,2083 | -0,0874 | |||
| ANGI / Angi Inc. | 0,02 | 34,64 | 0,31 | 33,33 | 0,2047 | 0,0345 | |||
| AIG / American International Group, Inc. | 0,00 | 0,00 | 0,30 | -1,34 | 0,1931 | -0,0243 | |||
| KMB / Kimberly-Clark Corporation | 0,00 | 0,00 | 0,28 | -9,18 | 0,1814 | -0,0404 | |||
| BEN / Franklin Resources, Inc. | 0,01 | -21,38 | 0,27 | -2,87 | 0,1779 | -0,0245 | |||
| IBKR / Interactive Brokers Group, Inc. | 0,00 | 0,27 | 0,1771 | 0,1771 | |||||
| SO / The Southern Company | 0,00 | 0,00 | 0,25 | -0,39 | 0,1662 | -0,0182 | |||
| FTXP / Foothills Exploration, Inc. | 0,00 | 0,24 | 0,1600 | 0,1600 | |||||
| CFG / Citizens Financial Group, Inc. | 0,01 | 0,23 | 0,1511 | 0,1511 | |||||
| LEVI / Levi Strauss & Co. | 0,01 | 3,72 | 0,21 | 23,26 | 0,1392 | 0,0138 | |||
| GXO / GXO Logistics, Inc. | 0,00 | 0,21 | 0,1382 | 0,1382 | |||||
| PLAY / Dave & Buster's Entertainment, Inc. | 0,01 | 0,21 | 0,1343 | 0,1343 | |||||
| STKL / SunOpta Inc. | 0,03 | 15,06 | 0,20 | 37,24 | 0,1305 | 0,0252 | |||
| HBI / Hanesbrands Inc. | 0,04 | -4,98 | 0,16 | -24,42 | 0,1075 | -0,0505 | |||
| CNDT / Conduent Incorporated | 0,05 | 0,00 | 0,13 | -2,34 | 0,0822 | -0,0110 | |||
| NWL / Newell Brands Inc. | 0,02 | -14,58 | 0,12 | -25,79 | 0,0775 | -0,0380 | |||
| EPC / Edgewell Personal Care Company | 0,00 | -100,00 | 0,00 | 0,0000 | |||||
| QVCGA / QVC Group Inc. | 0,00 | -100,00 | 0,00 | 0,0000 | |||||
| ENR / Energizer Holdings, Inc. | 0,00 | -100,00 | 0,00 | 0,0000 |