Statistiques de base
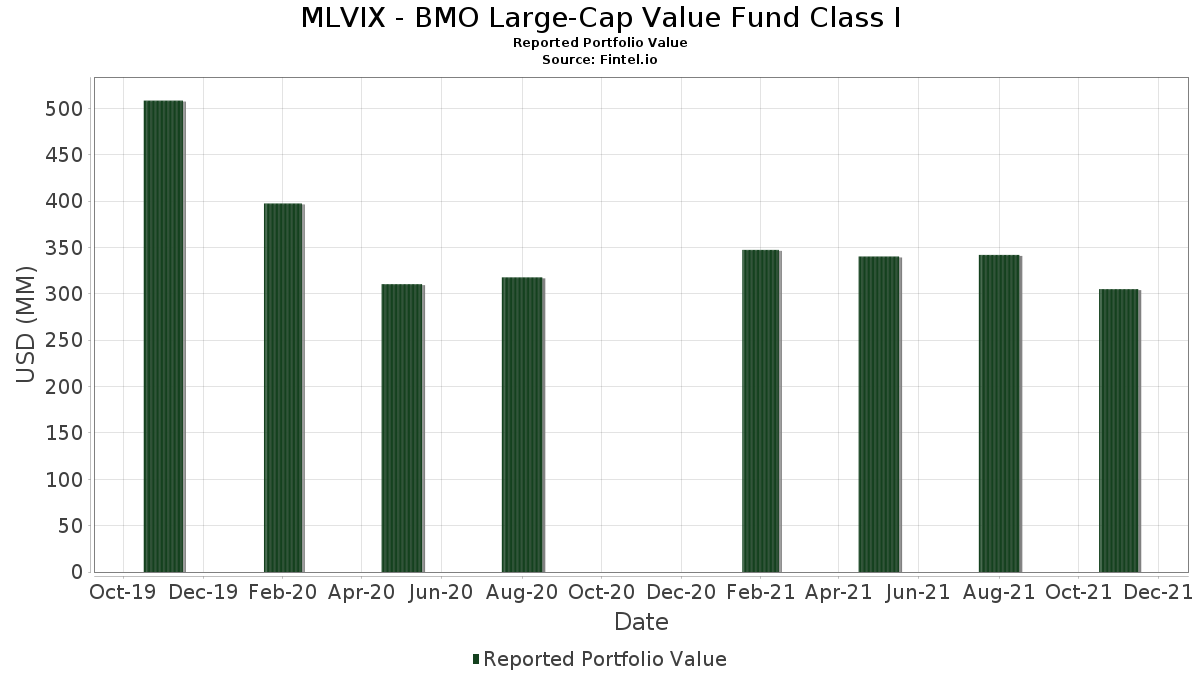
| Valeur du portefeuille | $ 305 070 160 |
| Positions actuelles | 78 |
Dernières positions, performances, ASG (à partir des dépôts 13F, 13D)
MLVIX - BMO Large-Cap Value Fund Class I a déclaré un total de 78 positions dans ses derniers dépôts auprès de la SEC. La valeur la plus récente du portefeuille est calculée à 305 070 160 USD. Les actifs sous gestion réels (ASG) sont cette valeur plus les liquidités (qui ne sont pas divulguées). Les principales positions de MLVIX - BMO Large-Cap Value Fund Class I sont Alphabet Inc. (US:GOOG) , EOG Resources, Inc. (US:EOG) , Citigroup Inc. (US:C) , Walmart Inc. (US:WMT) , and Morgan Stanley (US:MS) . Les nouvelles positions de MLVIX - BMO Large-Cap Value Fund Class I incluent Liberty Broadband Corporation (US:LBRDA) , Fox Corporation (US:FOXA) , Neurocrine Biosciences, Inc. (US:NBIX) , Sylvamo Corporation (US:SLVM) , and .
Meilleures augmentations ce trimestre
Nous utilisons la variation de l'allocation du portefeuille car il s'agit de l'indicateur le plus significatif. Les changements peuvent être dus à des transactions ou à des variations de prix des actions.
| Titre | Actions (en millions) |
Valeur ($ en millions) |
% du portefeuille | ΔPortefeuille % |
|---|---|---|---|---|
| 0,01 | 4,79 | 1,5423 | 1,5423 | |
| 0,07 | 4,62 | 1,4853 | 0,8304 | |
| 0,06 | 2,19 | 0,7054 | 0,7054 | |
| 0,02 | 2,07 | 0,6647 | 0,6647 | |
| 0,08 | 7,33 | 2,3588 | 0,5897 | |
| 0,00 | 4,67 | 1,5029 | 0,5014 | |
| 0,03 | 4,14 | 1,3334 | 0,4690 | |
| 0,02 | 3,84 | 1,2371 | 0,4292 | |
| 0,02 | 5,80 | 1,8677 | 0,3631 | |
| 0,08 | 2,40 | 0,7713 | 0,3290 |
Principales baisses ce trimestre
Nous utilisons la variation de l'allocation du portefeuille car il s'agit de l'indicateur le plus significatif. Les changements peuvent être dus à des transactions ou à des variations de prix des actions.
| Titre | Actions (en millions) |
Valeur ($ en millions) |
% du portefeuille | ΔPortefeuille % |
|---|---|---|---|---|
| 0,00 | 0,00 | -1,4006 | ||
| 0,00 | 0,00 | -1,1515 | ||
| 0,00 | 0,00 | -1,0402 | ||
| 0,11 | 5,43 | 1,7467 | -1,0332 | |
| 0,00 | 0,00 | -0,8717 | ||
| 0,00 | 0,00 | -0,8499 | ||
| 0,00 | 0,00 | -0,7833 | ||
| 0,02 | 2,12 | 0,6810 | -0,3884 | |
| 0,05 | 5,31 | 1,7091 | -0,3461 | |
| 0,03 | 2,89 | 0,9300 | -0,3137 |
Déclarations 13F et dépôts de fonds
Ce formulaire a été déposé le 2022-01-19 pour la période de déclaration 2021-11-30. Cliquez sur l'icône du lien pour voir l'historique complet des transactions.
Mettre à niveau pour débloquer les données premium et exporter vers Excel ![]() .
.
| Titre | Type | Prix moyen de l'action | Actions (en millions) |
ΔActions (%) |
ΔActions (%) |
Valeur ($ en millions) |
Portefeuille (%) |
ΔPortefeuille (%) |
|
|---|---|---|---|---|---|---|---|---|---|
| GOOG / Alphabet Inc. | 0,00 | -6,11 | 8,93 | -8,06 | 2,8727 | 0,0380 | |||
| EOG / EOG Resources, Inc. | 0,08 | -6,12 | 7,33 | 20,98 | 2,3588 | 0,5897 | |||
| C / Citigroup Inc. | 0,11 | -6,12 | 7,23 | -16,84 | 2,3273 | -0,2117 | |||
| WMT / Walmart Inc. | 0,05 | -6,12 | 7,22 | -10,85 | 2,3238 | -0,0412 | |||
| MS / Morgan Stanley | 0,07 | -6,12 | 6,97 | -14,76 | 2,2433 | -0,1444 | |||
| JNJ / Johnson & Johnson | 0,04 | -6,12 | 6,79 | -15,45 | 2,1862 | -0,1596 | |||
| WM / Waste Management, Inc. | 0,04 | -6,12 | 6,75 | -2,75 | 2,1736 | 0,1457 | |||
| TGT / Target Corporation | 0,03 | -6,12 | 6,60 | -7,31 | 2,1225 | 0,0449 | |||
| GS / The Goldman Sachs Group, Inc. | 0,02 | -6,12 | 6,42 | -13,51 | 2,0668 | -0,1010 | |||
| KEY / KeyCorp | 0,28 | -6,12 | 6,37 | 3,68 | 2,0502 | 0,2561 | |||
| LOW / Lowe's Companies, Inc. | 0,02 | -6,12 | 5,80 | 12,64 | 1,8677 | 0,3631 | |||
| COF / Capital One Financial Corporation | 0,04 | -6,12 | 5,64 | -20,51 | 1,8140 | -0,2564 | |||
| PSA / Public Storage | 0,02 | -6,12 | 5,63 | -5,03 | 1,8120 | 0,0810 | |||
| PG / The Procter & Gamble Company | 0,04 | -6,12 | 5,54 | -4,67 | 1,7814 | 0,0859 | |||
| CMCSA / Comcast Corporation | 0,11 | -30,79 | 5,43 | -42,99 | 1,7467 | -1,0332 | |||
| CPT / Camden Property Trust | 0,03 | -6,12 | 5,39 | 3,39 | 1,7360 | 0,2124 | |||
| MRK / Merck & Co., Inc. | 0,07 | -6,12 | 5,38 | -7,83 | 1,7314 | 0,0274 | |||
| CSL / Carlisle Companies Incorporated | 0,02 | -6,12 | 5,35 | 0,34 | 1,7212 | 0,1647 | |||
| RF / Regions Financial Corporation | 0,23 | -6,12 | 5,34 | 4,54 | 1,7189 | 0,2272 | |||
| ALL / The Allstate Corporation | 0,05 | -6,12 | 5,31 | -24,55 | 1,7091 | -0,3461 | |||
| HSY / The Hershey Company | 0,03 | 11,46 | 5,29 | 11,35 | 1,7019 | 0,3150 | |||
| ANTM / Anthem Inc | 0,01 | -6,11 | 5,15 | 1,68 | 1,6588 | 0,1785 | |||
| BAX / Baxter International Inc. | 0,07 | -6,12 | 5,10 | -8,14 | 1,6418 | 0,0201 | |||
| VRTX / Vertex Pharmaceuticals Incorporated | 0,03 | -6,12 | 5,02 | -12,39 | 1,6162 | -0,0573 | |||
| EA / Electronic Arts Inc. | 0,04 | 11,72 | 4,89 | -4,42 | 1,5726 | 0,0797 | |||
| LBRDA / Liberty Broadband Corporation | 0,01 | 4,79 | 1,5423 | 1,5423 | |||||
| TXN / Texas Instruments Incorporated | 0,02 | -6,12 | 4,75 | -5,39 | 1,5298 | 0,0626 | |||
| MSFT / Microsoft Corporation | 0,01 | -6,12 | 4,69 | 2,81 | 1,5080 | 0,1772 | |||
| AES / The AES Corporation | 0,20 | -6,12 | 4,67 | -8,03 | 1,5039 | 0,0201 | |||
| AZO / AutoZone, Inc. | 0,00 | 16,08 | 4,67 | 36,16 | 1,5029 | 0,5014 | |||
| SEE / Sealed Air Corporation | 0,07 | 102,14 | 4,62 | 105,75 | 1,4853 | 0,8304 | |||
| FISV / Fiserv, Inc. | 0,05 | -6,12 | 4,44 | -23,08 | 1,4281 | -0,2562 | |||
| FFIV / F5, Inc. | 0,02 | -6,12 | 4,42 | 4,94 | 1,4227 | 0,1928 | |||
| CRI / Carter's, Inc. | 0,04 | 19,63 | 4,39 | 18,04 | 1,4130 | 0,3271 | |||
| EG / Everest Group, Ltd. | 0,02 | -6,11 | 4,35 | -9,14 | 1,3986 | 0,0021 | |||
| AXP / American Express Company | 0,03 | 42,13 | 4,14 | 60,02 | 1,3334 | 0,4690 | |||
| MSI / Motorola Solutions, Inc. | 0,02 | 34,01 | 3,84 | 38,92 | 1,2371 | 0,4292 | |||
| BRX / Brixmor Property Group Inc. | 0,16 | -6,12 | 3,66 | -8,96 | 1,1775 | 0,0040 | |||
| USB / U.S. Bancorp | 0,07 | -6,12 | 3,60 | -9,47 | 1,1596 | -0,0026 | |||
| HOLX / Hologic, Inc. | 0,05 | -6,12 | 3,55 | -11,38 | 1,1431 | -0,0269 | |||
| D / Dominion Energy, Inc. | 0,05 | -6,12 | 3,48 | -14,13 | 1,1205 | -0,0633 | |||
| MDU / MDU Resources Group, Inc. | 0,12 | -6,12 | 3,35 | -20,53 | 1,0765 | -0,1526 | |||
| RJF / Raymond James Financial, Inc. | 0,03 | 40,82 | 3,21 | -1,05 | 1,0336 | 0,0858 | |||
| IP / International Paper Company | 0,07 | -6,12 | 3,06 | -28,89 | 0,9834 | -0,2711 | |||
| STT / State Street Corporation | 0,03 | -6,12 | 3,05 | -10,10 | 0,9825 | -0,0090 | |||
| LLY / Eli Lilly and Company | 0,01 | -6,12 | 3,05 | -9,84 | 0,9821 | -0,0062 | |||
| NOC / Northrop Grumman Corporation | 0,01 | -6,11 | 3,02 | -10,94 | 0,9723 | -0,0182 | |||
| CLH / Clean Harbors, Inc. | 0,03 | -6,12 | 2,92 | -7,18 | 0,9399 | 0,0210 | |||
| DVA / DaVita Inc. | 0,03 | -6,12 | 2,89 | -32,17 | 0,9300 | -0,3137 | |||
| CDW / CDW Corporation | 0,01 | -6,12 | 2,78 | -11,39 | 0,8962 | -0,0213 | |||
| URI / United Rentals, Inc. | 0,01 | -6,12 | 2,68 | -9,82 | 0,8635 | -0,0052 | |||
| ZION / Zions Bancorporation, National Association | 0,04 | -6,12 | 2,61 | 2,27 | 0,8411 | 0,0950 | |||
| CBRE / CBRE Group, Inc. | 0,03 | -6,12 | 2,57 | -6,82 | 0,8264 | 0,0217 | |||
| RHI / Robert Half Inc. | 0,02 | -6,12 | 2,51 | 0,97 | 0,8069 | 0,0816 | |||
| CSCO / Cisco Systems, Inc. | 0,04 | -6,12 | 2,45 | -12,77 | 0,7870 | -0,0315 | |||
| AKAM / Akamai Technologies, Inc. | 0,02 | 7,89 | 2,44 | 14,96 | 0,7863 | -0,0642 | |||
| OSK / Oshkosh Corporation | 0,02 | -25,34 | 2,41 | -11,21 | 0,7755 | 0,0839 | |||
| FLS / Flowserve Corporation | 0,08 | 105,12 | 2,40 | 58,26 | 0,7713 | 0,3290 | |||
| DOW / Dow Inc. | 0,04 | -6,12 | 2,39 | -18,01 | 0,7692 | -0,0820 | |||
| GWW / W.W. Grainger, Inc. | 0,00 | -6,10 | 2,36 | 4,24 | 0,7590 | 0,0984 | |||
| CPRI / Capri Holdings Limited | 0,04 | -6,12 | 2,32 | -1,61 | 0,7459 | 0,0581 | |||
| OC / Owens Corning | 0,03 | -6,12 | 2,31 | -16,66 | 0,7440 | -0,0658 | |||
| JBL / Jabil Inc. | 0,04 | -6,12 | 2,27 | -11,14 | 0,7319 | -0,0156 | |||
| TNL / Travel + Leisure Co. | 0,05 | -6,12 | 2,24 | -15,61 | 0,7203 | -0,0542 | |||
| FOXA / Fox Corporation | 0,06 | 2,19 | 0,7054 | 0,7054 | |||||
| AGCO / AGCO Corporation | 0,02 | -27,85 | 2,12 | -42,22 | 0,6810 | -0,3884 | |||
| GLPI / Gaming and Leisure Properties, Inc. | 0,05 | -6,12 | 2,10 | -14,06 | 0,6769 | -0,0379 | |||
| NBIX / Neurocrine Biosciences, Inc. | 0,02 | 2,07 | 0,6647 | 0,6647 | |||||
| DBX / Dropbox, Inc. | 0,08 | -6,12 | 2,02 | -27,15 | 0,6503 | -0,1595 | |||
| GIS / General Mills, Inc. | 0,03 | -6,12 | 1,95 | 0,31 | 0,6276 | 0,0600 | |||
| BIIB / Biogen Inc. | 0,01 | -25,22 | 1,90 | -41,22 | 0,6101 | -0,2117 | |||
| EXEL / Exelixis, Inc. | 0,11 | -6,12 | 1,88 | -17,76 | 0,6034 | -0,0624 | |||
| AGR / Avangrid, Inc. | 0,04 | -6,12 | 1,86 | -13,07 | 0,5999 | -0,0260 | |||
| DECK / Deckers Outdoor Corporation | 0,00 | -6,12 | 1,81 | -9,07 | 0,5840 | 0,0014 | |||
| CACI / CACI International Inc | 0,01 | -6,12 | 1,70 | -5,40 | 0,5471 | 0,0222 | |||
| BKR / Baker Hughes Company | 0,07 | -6,12 | 1,53 | -3,83 | 0,4930 | 0,0280 | |||
| CERN / Cerner Corp. | 0,02 | -6,11 | 1,53 | -13,37 | 0,4923 | -0,0233 | |||
| SLVM / Sylvamo Corporation | 0,01 | 0,18 | 0,0595 | 0,0595 | |||||
| VZ / Verizon Communications Inc. | 0,00 | -100,00 | 0,00 | -100,00 | -0,7833 | ||||
| PWR / Quanta Services, Inc. | 0,00 | -100,00 | 0,00 | -100,00 | -1,4006 | ||||
| CI / The Cigna Group | 0,00 | -100,00 | 0,00 | -100,00 | -1,0402 | ||||
| TROW / T. Rowe Price Group, Inc. | 0,00 | -100,00 | 0,00 | -100,00 | -1,1515 | ||||
| TSN / Tyson Foods, Inc. | 0,00 | -100,00 | 0,00 | -100,00 | -0,8499 | ||||
| JAZZ / Jazz Pharmaceuticals plc | 0,00 | -100,00 | 0,00 | -100,00 | -0,8717 |