Statistiques de base
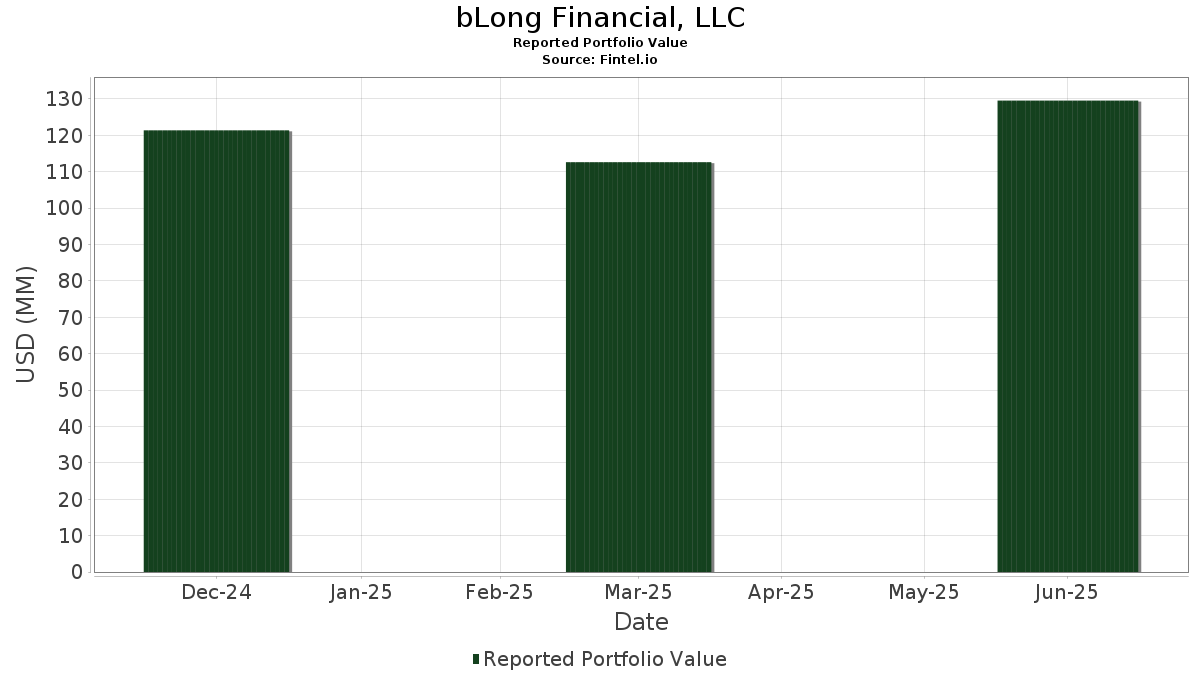
| Valeur du portefeuille | $ 129 566 377 |
| Positions actuelles | 79 |
Dernières positions, performances, ASG (à partir des dépôts 13F, 13D)
bLong Financial, LLC a déclaré un total de 79 positions dans ses derniers dépôts auprès de la SEC. La valeur la plus récente du portefeuille est calculée à 129 566 377 USD. Les actifs sous gestion réels (ASG) sont cette valeur plus les liquidités (qui ne sont pas divulguées). Les principales positions de bLong Financial, LLC sont NVIDIA Corporation (US:NVDA) , Apple Inc. (US:AAPL) , iShares Trust - iShares MSCI Europe Financials ETF (US:EUFN) , Eli Lilly and Company (US:LLY) , and Microsoft Corporation (US:MSFT) . Les nouvelles positions de bLong Financial, LLC incluent Spinnaker ETF Series - Select STOXX Europe Aerospace & Defense ETF (US:EUAD) , iShares Trust - iShares International Select Dividend ETF (US:IDV) , iShares, Inc. - iShares Emerging Markets Dividend ETF (US:DVYE) , Arm Holdings plc - Depositary Receipt (Common Stock) (US:ARM) , and Ubiquiti Inc. (US:UI) .
Meilleures augmentations ce trimestre
Nous utilisons la variation de l'allocation du portefeuille car il s'agit de l'indicateur le plus significatif. Les changements peuvent être dus à des transactions ou à des variations de prix des actions.
| Titre | Actions (en millions) |
Valeur ($ en millions) |
% du portefeuille | ΔPortefeuille % |
|---|---|---|---|---|
| 0,49 | 15,34 | 11,8418 | 4,7202 | |
| 0,17 | 26,56 | 20,4959 | 4,2883 | |
| 0,11 | 4,73 | 3,6534 | 3,6534 | |
| 0,08 | 2,62 | 2,0233 | 2,0233 | |
| 0,06 | 1,64 | 1,2694 | 1,2694 | |
| 0,01 | 2,52 | 1,9450 | 0,5935 | |
| 0,01 | 5,41 | 4,1757 | 0,5840 | |
| 0,01 | 3,77 | 2,9133 | 0,2964 | |
| 0,02 | 2,25 | 1,7386 | 0,2901 | |
| 0,00 | 0,33 | 0,2527 | 0,2527 |
Principales baisses ce trimestre
Nous utilisons la variation de l'allocation du portefeuille car il s'agit de l'indicateur le plus significatif. Les changements peuvent être dus à des transactions ou à des variations de prix des actions.
| Titre | Actions (en millions) |
Valeur ($ en millions) |
% du portefeuille | ΔPortefeuille % |
|---|---|---|---|---|
| 0,09 | 19,30 | 14,8956 | -3,7193 | |
| 0,01 | 5,47 | 4,2193 | -0,8863 | |
| 0,02 | 1,60 | 1,2330 | -0,3828 | |
| 0,00 | 2,12 | 1,6350 | -0,3688 | |
| 0,00 | 0,70 | 0,5425 | -0,2236 | |
| 0,01 | 0,69 | 0,5338 | -0,2222 | |
| 0,00 | 0,85 | 0,6573 | -0,2002 | |
| 0,00 | 0,83 | 0,6385 | -0,1905 | |
| 0,03 | 1,11 | 0,8529 | -0,1796 | |
| 0,01 | 0,88 | 0,6825 | -0,1699 |
Déclarations 13F et dépôts de fonds
Ce formulaire a été déposé le 2025-08-13 pour la période de déclaration 2025-06-30. Cliquez sur l'icône du lien pour voir l'historique complet des transactions.
Mettre à niveau pour débloquer les données premium et exporter vers Excel ![]() .
.
| Titre | Type | Prix moyen de l'action | Actions (en millions) |
ΔActions (%) |
ΔActions (%) |
Valeur ($ en millions) |
Portefeuille (%) |
ΔPortefeuille (%) |
|
|---|---|---|---|---|---|---|---|---|---|
| NVDA / NVIDIA Corporation | 0,17 | -0,21 | 26,56 | 45,47 | 20,4959 | 4,2883 | |||
| AAPL / Apple Inc. | 0,09 | -0,34 | 19,30 | -7,96 | 14,8956 | -3,7193 | |||
| EUFN / iShares Trust - iShares MSCI Europe Financials ETF | 0,49 | 72,28 | 15,34 | 91,27 | 11,8418 | 4,7202 | |||
| LLY / Eli Lilly and Company | 0,01 | 0,72 | 5,47 | -4,94 | 4,2193 | -0,8863 | |||
| MSFT / Microsoft Corporation | 0,01 | 0,93 | 5,41 | 33,75 | 4,1757 | 0,5840 | |||
| EUAD / Spinnaker ETF Series - Select STOXX Europe Aerospace & Defense ETF | 0,11 | 4,73 | 3,6534 | 3,6534 | |||||
| META / Meta Platforms, Inc. | 0,01 | 0,00 | 3,77 | 28,06 | 2,9133 | 0,2964 | |||
| IDV / iShares Trust - iShares International Select Dividend ETF | 0,08 | 2,62 | 2,0233 | 2,0233 | |||||
| AVGO / Broadcom Inc. | 0,01 | 0,55 | 2,52 | 65,57 | 1,9450 | 0,5935 | |||
| AMD / Advanced Micro Devices, Inc. | 0,02 | -0,03 | 2,25 | 38,07 | 1,7386 | 0,2901 | |||
| JPM / JPMorgan Chase & Co. | 0,01 | -0,66 | 2,18 | 17,38 | 1,6838 | 0,0341 | |||
| BRK.B / Berkshire Hathaway Inc. | 0,00 | 2,90 | 2,12 | -6,16 | 1,6350 | -0,3688 | |||
| IBM / International Business Machines Corporation | 0,01 | 0,08 | 1,84 | 18,67 | 1,4179 | 0,0432 | |||
| DVYE / iShares, Inc. - iShares Emerging Markets Dividend ETF | 0,06 | 1,64 | 1,2694 | 1,2694 | |||||
| MRK / Merck & Co., Inc. | 0,02 | -0,46 | 1,60 | -12,20 | 1,2330 | -0,3828 | |||
| CRM / Salesforce, Inc. | 0,00 | 1,66 | 1,34 | 3,32 | 1,0321 | -0,1172 | |||
| CSCO / Cisco Systems, Inc. | 0,02 | 0,00 | 1,23 | 12,43 | 0,9499 | -0,0220 | |||
| MS / Morgan Stanley | 0,01 | -2,26 | 1,22 | 18,01 | 0,9413 | 0,0237 | |||
| GOOGL / Alphabet Inc. | 0,01 | 0,00 | 1,21 | 13,98 | 0,9317 | -0,0087 | |||
| TSLA / Tesla, Inc. | 0,00 | 1,23 | 1,17 | 24,15 | 0,9049 | 0,0660 | |||
| VZ / Verizon Communications Inc. | 0,03 | -0,39 | 1,11 | -4,91 | 0,8529 | -0,1796 | |||
| ABT / Abbott Laboratories | 0,01 | 0,06 | 0,99 | 2,60 | 0,7622 | -0,0924 | |||
| DELL / Dell Technologies Inc. | 0,01 | 2,90 | 0,98 | 38,39 | 0,7543 | 0,1274 | |||
| JNJ / Johnson & Johnson | 0,01 | 0,00 | 0,88 | -7,92 | 0,6825 | -0,1699 | |||
| AMGN / Amgen Inc. | 0,00 | -1,61 | 0,85 | -11,81 | 0,6573 | -0,2002 | |||
| ABBV / AbbVie Inc. | 0,00 | 0,00 | 0,83 | -11,36 | 0,6385 | -0,1905 | |||
| RTX / RTX Corporation | 0,01 | 0,00 | 0,78 | 10,24 | 0,5985 | -0,0260 | |||
| ED / Consolidated Edison, Inc. | 0,01 | 0,00 | 0,77 | -9,20 | 0,5944 | -0,1591 | |||
| WMT / Walmart Inc. | 0,01 | 0,00 | 0,76 | 11,40 | 0,5884 | -0,0193 | |||
| GOOG / Alphabet Inc. | 0,00 | 0,00 | 0,72 | 13,50 | 0,5586 | -0,0073 | |||
| DFAC / Dimensional ETF Trust - Dimensional U.S. Core Equity 2 ETF | 0,02 | 0,00 | 0,71 | 8,74 | 0,5473 | -0,0322 | |||
| MAA / Mid-America Apartment Communities, Inc. | 0,00 | -7,77 | 0,70 | -18,56 | 0,5425 | -0,2236 | |||
| AMZN / Amazon.com, Inc. | 0,00 | 3,26 | 0,70 | 19,01 | 0,5371 | 0,0182 | |||
| BMY / Bristol-Myers Squibb Company | 0,01 | 7,01 | 0,69 | -18,80 | 0,5338 | -0,2222 | |||
| HON / Honeywell International Inc. | 0,00 | 0,00 | 0,61 | 9,84 | 0,4745 | -0,0218 | |||
| ZS / Zscaler, Inc. | 0,00 | 0,00 | 0,60 | 58,58 | 0,4640 | 0,1267 | |||
| MO / Altria Group, Inc. | 0,01 | 0,00 | 0,57 | -2,42 | 0,4366 | -0,0775 | |||
| TT / Trane Technologies plc | 0,00 | 0,00 | 0,52 | 29,70 | 0,4051 | 0,0462 | |||
| BA / The Boeing Company | 0,00 | -3,90 | 0,49 | 18,07 | 0,3787 | 0,0097 | |||
| MCD / McDonald's Corporation | 0,00 | 0,00 | 0,49 | -6,33 | 0,3768 | -0,0866 | |||
| PG / The Procter & Gamble Company | 0,00 | 0,00 | 0,48 | -6,45 | 0,3700 | -0,0853 | |||
| T / AT&T Inc. | 0,02 | -1,21 | 0,47 | 1,08 | 0,3634 | -0,0501 | |||
| ORCL / Oracle Corporation | 0,00 | 0,00 | 0,46 | 56,42 | 0,3577 | 0,0946 | |||
| CVX / Chevron Corporation | 0,00 | 0,00 | 0,45 | -14,48 | 0,3470 | -0,1193 | |||
| GS / The Goldman Sachs Group, Inc. | 0,00 | 0,00 | 0,45 | 29,36 | 0,3441 | 0,0386 | |||
| WM / Waste Management, Inc. | 0,00 | 0,00 | 0,43 | -1,15 | 0,3304 | -0,0541 | |||
| COP / ConocoPhillips | 0,00 | -2,20 | 0,40 | -16,39 | 0,3075 | -0,1158 | |||
| PFE / Pfizer Inc. | 0,02 | -0,63 | 0,38 | -4,99 | 0,2948 | -0,0619 | |||
| WELL / Welltower Inc. | 0,00 | 0,00 | 0,38 | 0,27 | 0,2907 | -0,0426 | |||
| QBTS / D-Wave Quantum Inc. | 0,02 | 2,29 | 0,36 | 96,72 | 0,2784 | 0,1159 | |||
| KO / The Coca-Cola Company | 0,01 | 0,00 | 0,36 | -1,11 | 0,2759 | -0,0454 | |||
| VRT / Vertiv Holdings Co | 0,00 | 0,33 | 0,2527 | 0,2527 | |||||
| GE / General Electric Company | 0,00 | 0,00 | 0,33 | 28,85 | 0,2519 | 0,0266 | |||
| SNOW / Snowflake Inc. | 0,00 | -37,11 | 0,32 | -3,93 | 0,2461 | -0,0479 | |||
| FDX / FedEx Corporation | 0,00 | 0,00 | 0,32 | -6,80 | 0,2439 | -0,0570 | |||
| PEP / PepsiCo, Inc. | 0,00 | 0,00 | 0,31 | -11,85 | 0,2358 | -0,0722 | |||
| GLW / Corning Incorporated | 0,01 | 0,00 | 0,30 | 15,12 | 0,2293 | -0,0003 | |||
| TXN / Texas Instruments Incorporated | 0,00 | 0,00 | 0,29 | 15,54 | 0,2243 | 0,0010 | |||
| LMT / Lockheed Martin Corporation | 0,00 | -1,57 | 0,29 | 2,12 | 0,2234 | -0,0284 | |||
| IP / International Paper Company | 0,01 | 0,00 | 0,27 | -12,18 | 0,2120 | -0,0658 | |||
| GMED / Globus Medical, Inc. | 0,00 | -7,81 | 0,26 | -25,64 | 0,2016 | -0,1104 | |||
| VLO / Valero Energy Corporation | 0,00 | -4,96 | 0,26 | -3,38 | 0,1987 | -0,0376 | |||
| NSC / Norfolk Southern Corporation | 0,00 | 0,00 | 0,26 | 8,05 | 0,1976 | -0,0127 | |||
| QCOM / QUALCOMM Incorporated | 0,00 | 0,00 | 0,25 | 3,70 | 0,1951 | -0,0214 | |||
| WMB / The Williams Companies, Inc. | 0,00 | -5,87 | 0,25 | -1,18 | 0,1944 | -0,0316 | |||
| DUK / Duke Energy Corporation | 0,00 | 0,00 | 0,25 | -3,54 | 0,1898 | -0,0359 | |||
| SBUX / Starbucks Corporation | 0,00 | 0,00 | 0,24 | -6,51 | 0,1886 | -0,0436 | |||
| TRV / The Travelers Companies, Inc. | 0,00 | 0,00 | 0,23 | 1,32 | 0,1776 | -0,0243 | |||
| ARM / Arm Holdings plc - Depositary Receipt (Common Stock) | 0,00 | 0,23 | 0,1760 | 0,1760 | |||||
| FI / Fiserv, Inc. | 0,00 | 0,00 | 0,22 | -21,83 | 0,1714 | -0,0811 | |||
| FHN / First Horizon Corporation | 0,01 | 0,00 | 0,22 | 9,05 | 0,1678 | -0,0090 | |||
| UNH / UnitedHealth Group Incorporated | 0,00 | 0,00 | 0,21 | -40,40 | 0,1606 | -0,1495 | |||
| UI / Ubiquiti Inc. | 0,00 | 0,21 | 0,1589 | 0,1589 | |||||
| SYK / Stryker Corporation | 0,00 | 0,20 | 0,1557 | 0,1557 | |||||
| ALL / The Allstate Corporation | 0,00 | 0,00 | 0,20 | -2,90 | 0,1554 | -0,0285 | |||
| XOM / Exxon Mobil Corporation | 0,00 | 0,00 | 0,20 | -9,46 | 0,1553 | -0,0418 | |||
| RGTI / Rigetti Computing, Inc. | 0,01 | 0,00 | 0,16 | 49,52 | 0,1217 | 0,0282 | |||
| LUMN / Lumen Technologies, Inc. | 0,02 | -14,92 | 0,08 | -4,94 | 0,0597 | -0,0126 | |||
| BEAT / HeartBeam, Inc. | 0,01 | 0,00 | 0,01 | -40,00 | 0,0096 | -0,0082 | |||
| TLH / iShares Trust - iShares 10-20 Year Treasury Bond ETF | 0,00 | -100,00 | 0,00 | 0,0000 | |||||
| IEF / iShares Trust - iShares 7-10 Year Treasury Bond ETF | 0,00 | -100,00 | 0,00 | 0,0000 | |||||
| NEA / Nuveen AMT-Free Quality Municipal Income Fund | 0,00 | -100,00 | 0,00 | 0,0000 | |||||
| EWG / iShares, Inc. - iShares MSCI Germany ETF | 0,00 | -100,00 | 0,00 | 0,0000 | |||||
| IEV / iShares Trust - iShares Europe ETF | 0,00 | -100,00 | 0,00 | 0,0000 |