Statistiques de base
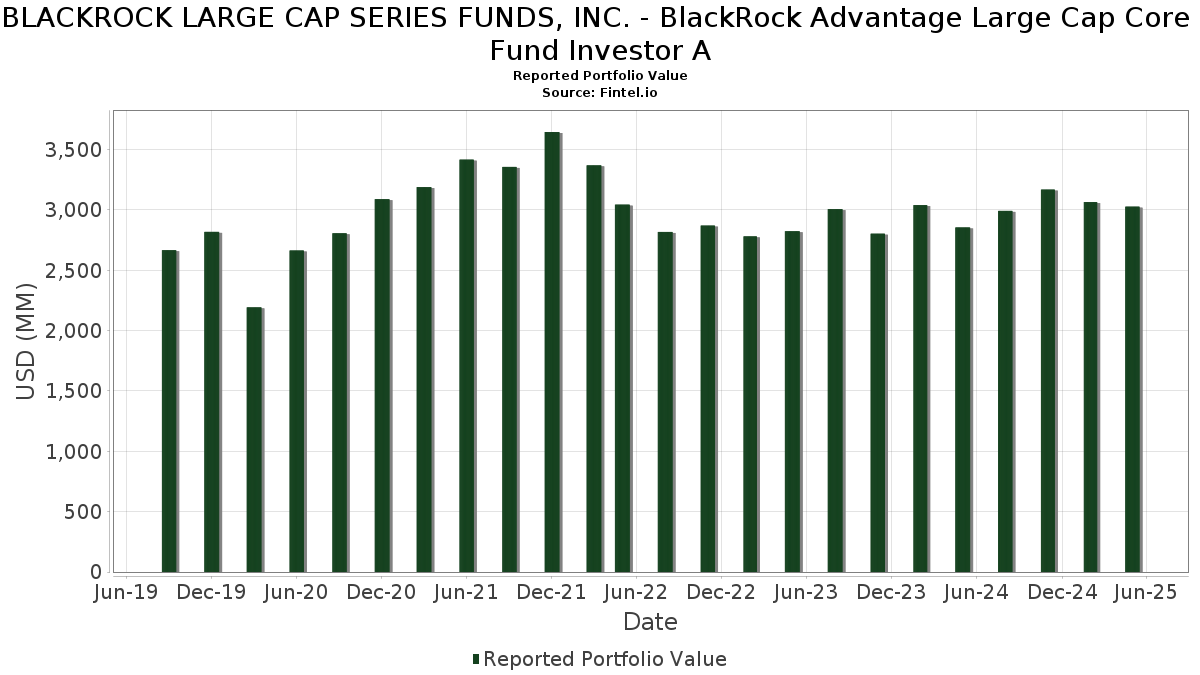
| Valeur du portefeuille | $ 3 027 051 829 |
| Positions actuelles | 99 |
Dernières positions, performances, ASG (à partir des dépôts 13F, 13D)
BLACKROCK LARGE CAP SERIES FUNDS, INC. - BlackRock Advantage Large Cap Core Fund Investor A a déclaré un total de 99 positions dans ses derniers dépôts auprès de la SEC. La valeur la plus récente du portefeuille est calculée à 3 027 051 829 USD. Les actifs sous gestion réels (ASG) sont cette valeur plus les liquidités (qui ne sont pas divulguées). Les principales positions de BLACKROCK LARGE CAP SERIES FUNDS, INC. - BlackRock Advantage Large Cap Core Fund Investor A sont Microsoft Corporation (US:MSFT) , NVIDIA Corporation (US:NVDA) , Apple Inc. (US:AAPL) , Amazon.com, Inc. (US:AMZN) , and Meta Platforms, Inc. (US:META) . Les nouvelles positions de BLACKROCK LARGE CAP SERIES FUNDS, INC. - BlackRock Advantage Large Cap Core Fund Investor A incluent Corning Incorporated (DE:GLW) , Palantir Technologies Inc. (US:PLTR) , Elastic N.V. (US:ESTC) , .
Meilleures augmentations ce trimestre
Nous utilisons la variation de l'allocation du portefeuille car il s'agit de l'indicateur le plus significatif. Les changements peuvent être dus à des transactions ou à des variations de prix des actions.
| Titre | Actions (en millions) |
Valeur ($ en millions) |
% du portefeuille | ΔPortefeuille % |
|---|---|---|---|---|
| 0,44 | 36,23 | 1,1986 | 0,9316 | |
| 0,43 | 27,86 | 0,9216 | 0,8967 | |
| 0,48 | 42,15 | 1,3945 | 0,8930 | |
| 0,25 | 38,47 | 1,2725 | 0,8410 | |
| 0,11 | 25,06 | 0,8289 | 0,7857 | |
| 0,21 | 38,60 | 1,2770 | 0,7716 | |
| 0,43 | 21,30 | 0,7047 | 0,7047 | |
| 0,40 | 23,92 | 0,7912 | 0,6796 | |
| 0,15 | 17,38 | 0,5749 | 0,5506 | |
| 0,08 | 37,84 | 1,2519 | 0,5326 |
Principales baisses ce trimestre
Nous utilisons la variation de l'allocation du portefeuille car il s'agit de l'indicateur le plus significatif. Les changements peuvent être dus à des transactions ou à des variations de prix des actions.
| Titre | Actions (en millions) |
Valeur ($ en millions) |
% du portefeuille | ΔPortefeuille % |
|---|---|---|---|---|
| 0,05 | 14,07 | 0,4654 | -1,1168 | |
| 0,86 | 173,59 | 5,7427 | -1,0863 | |
| 0,01 | 28,42 | 0,9401 | -0,5822 | |
| 0,01 | 10,63 | 0,3516 | -0,5768 | |
| 0,22 | 20,00 | 0,6617 | -0,5747 | |
| 0,07 | 15,94 | 0,5273 | -0,5743 | |
| 0,14 | 23,47 | 0,7765 | -0,5480 | |
| 0,05 | 19,40 | 0,6418 | -0,5301 | |
| 0,11 | 20,59 | 0,6810 | -0,4914 | |
| 0,00 | 0,00 | -0,4602 |
Déclarations 13F et dépôts de fonds
Ce formulaire a été déposé le 2025-07-24 pour la période de déclaration 2025-05-30. Cliquez sur l'icône du lien pour voir l'historique complet des transactions.
Mettre à niveau pour débloquer les données premium et exporter vers Excel ![]() .
.
| Titre | Type | Prix moyen de l'action | Actions (en millions) |
ΔActions (%) |
ΔActions (%) |
Valeur ($ en millions) |
Portefeuille (%) |
ΔPortefeuille (%) |
|
|---|---|---|---|---|---|---|---|---|---|
| MSFT / Microsoft Corporation | 0,46 | -10,25 | 209,56 | 4,08 | 6,9326 | 0,3677 | |||
| NVDA / NVIDIA Corporation | 1,31 | -8,99 | 177,61 | -1,55 | 5,8754 | -0,0063 | |||
| AAPL / Apple Inc. | 0,86 | -0,21 | 173,59 | -17,12 | 5,7427 | -1,0863 | |||
| AMZN / Amazon.com, Inc. | 0,61 | -1,52 | 124,91 | -4,90 | 4,1321 | -0,1501 | |||
| META / Meta Platforms, Inc. | 0,14 | 4,82 | 88,58 | 1,57 | 2,9302 | 0,0871 | |||
| GOOGL / Alphabet Inc. | 0,45 | -1,34 | 77,63 | -0,49 | 2,5680 | 0,0244 | |||
| AVGO / Broadcom Inc. | 0,26 | 5,64 | 62,55 | 28,23 | 2,0694 | 0,4788 | |||
| HD / The Home Depot, Inc. | 0,15 | 16,35 | 55,33 | 8,05 | 1,8303 | 0,1608 | |||
| WMT / Walmart Inc. | 0,55 | -0,99 | 54,42 | -0,88 | 1,8002 | 0,0102 | |||
| BAC / Bank of America Corporation | 1,18 | 0,69 | 51,95 | -3,61 | 1,7186 | -0,0387 | |||
| COST / Costco Wholesale Corporation | 0,05 | 2,68 | 47,55 | 1,85 | 1,5728 | 0,0509 | |||
| GOOG / Alphabet Inc. | 0,27 | -0,74 | 46,30 | -0,37 | 1,5316 | 0,0164 | |||
| TSLA / Tesla, Inc. | 0,13 | -17,57 | 44,54 | -2,53 | 1,4734 | -0,0164 | |||
| MS / Morgan Stanley | 0,35 | 2,53 | 44,35 | -1,39 | 1,4673 | 0,0009 | |||
| MDT / Medtronic plc | 0,51 | 20,38 | 42,62 | 8,55 | 1,4098 | 0,1298 | |||
| SCHW / The Charles Schwab Corporation | 0,48 | 146,71 | 42,15 | 174,06 | 1,3945 | 0,8930 | |||
| MCO / Moody's Corporation | 0,08 | 22,35 | 39,40 | 16,38 | 1,3034 | 0,1996 | |||
| TRV / The Travelers Companies, Inc. | 0,14 | 4,52 | 39,19 | 59,54 | 1,2965 | 0,4154 | |||
| PM / Philip Morris International Inc. | 0,21 | 114,14 | 38,60 | 149,04 | 1,2770 | 0,7716 | |||
| CAH / Cardinal Health, Inc. | 0,25 | 143,66 | 38,47 | 190,64 | 1,2725 | 0,8410 | |||
| LMT / Lockheed Martin Corporation | 0,08 | 60,16 | 37,84 | 71,54 | 1,2519 | 0,5326 | |||
| JPM / JPMorgan Chase & Co. | 0,14 | 0,00 | 36,87 | -0,24 | 1,2198 | 0,0146 | |||
| ETR / Entergy Corporation | 0,44 | 567,52 | 36,23 | 378,12 | 1,1986 | 0,9316 | |||
| BSX / Boston Scientific Corporation | 0,34 | -38,58 | 36,01 | 19,85 | 1,1913 | 0,1878 | |||
| PFE / Pfizer Inc. | 1,52 | 45,19 | 35,71 | 29,04 | 1,1814 | 0,2791 | |||
| CTAS / Cintas Corporation | 0,15 | -13,58 | 34,84 | -5,67 | 1,1524 | -0,0516 | |||
| US09248U7182 / BlackRock Liquidity Funds: T-Fund, Institutional Shares | 34,28 | 17,81 | 34,28 | 17,81 | 1,1340 | 0,1853 | |||
| LLY / Eli Lilly and Company | 0,05 | 1,51 | 33,85 | -18,67 | 1,1199 | -0,2372 | |||
| EQIX / Equinix, Inc. | 0,04 | 75,73 | 33,09 | 87,20 | 1,0946 | 0,5041 | |||
| PNC / The PNC Financial Services Group, Inc. | 0,19 | 22,99 | 32,77 | 11,38 | 1,0841 | 0,1248 | |||
| ADSK / Autodesk, Inc. | 0,11 | 29,47 | 32,59 | 39,82 | 1,0781 | 0,3182 | |||
| CRM / Salesforce, Inc. | 0,11 | 21,18 | 30,32 | 27,66 | 1,0030 | 0,1511 | |||
| PH / Parker-Hannifin Corporation | 0,04 | -28,97 | 29,55 | -29,37 | 0,9776 | -0,3866 | |||
| ABBV / AbbVie Inc. | 0,16 | 65,83 | 29,26 | 47,65 | 0,9681 | 0,3219 | |||
| NFLX / Netflix, Inc. | 0,02 | 40,28 | 29,17 | 72,71 | 0,9650 | 0,4143 | |||
| BKNG / Booking Holdings Inc. | 0,01 | -44,68 | 28,42 | -39,14 | 0,9401 | -0,5822 | |||
| MRK / Merck & Co., Inc. | 0,36 | 38,94 | 28,04 | 15,73 | 0,9275 | 0,1376 | |||
| VTR / Ventas, Inc. | 0,43 | 2 751,76 | 27,86 | 3 840,45 | 0,9216 | 0,8967 | |||
| LRCX / Lam Research Corporation | 0,34 | 25,53 | 27,72 | 32,16 | 0,9168 | 0,2331 | |||
| CL / Colgate-Palmolive Company | 0,30 | -33,78 | 27,56 | -32,49 | 0,9118 | -0,4194 | |||
| V / Visa Inc. | 0,07 | -29,65 | 26,13 | -29,17 | 0,8646 | -0,3385 | |||
| LNG / Cheniere Energy, Inc. | 0,11 | 1 109,86 | 25,06 | 1 952,09 | 0,8289 | 0,7857 | |||
| ICE / Intercontinental Exchange, Inc. | 0,14 | -31,06 | 24,90 | -28,45 | 0,8237 | -0,3109 | |||
| DVN / Devon Energy Corporation | 0,82 | 11,49 | 24,89 | -6,86 | 0,8234 | -0,0478 | |||
| ADBE / Adobe Inc. | 0,06 | 5,73 | 24,32 | 0,08 | 0,8046 | 0,0122 | |||
| WMB / The Williams Companies, Inc. | 0,40 | 308,67 | 23,92 | 616,26 | 0,7912 | 0,6796 | |||
| SPG / Simon Property Group, Inc. | 0,14 | -34,06 | 23,47 | -42,22 | 0,7765 | -0,5480 | |||
| FLS / Flowserve Corporation | 0,46 | 94,90 | 22,73 | 76,74 | 0,7520 | 0,3326 | |||
| ETN / Eaton Corporation plc | 0,07 | -25,54 | 22,67 | -18,72 | 0,7500 | -0,1594 | |||
| BWA / BorgWarner Inc. | 0,68 | 73,24 | 22,59 | 92,57 | 0,7472 | 0,3648 | |||
| CMCSA / Comcast Corporation | 0,64 | -13,43 | 22,26 | -16,59 | 0,7365 | -0,1338 | |||
| BMY / Bristol-Myers Squibb Company | 0,45 | 77,77 | 21,67 | 71,83 | 0,7169 | 0,2956 | |||
| GLW / Corning Incorporated | 0,43 | 21,30 | 0,7047 | 0,7047 | |||||
| UNH / UnitedHealth Group Incorporated | 0,07 | 20,35 | 21,23 | -23,50 | 0,7022 | -0,2025 | |||
| RL / Ralph Lauren Corporation | 0,08 | 70,91 | 21,14 | 345,09 | 0,6994 | 0,5313 | |||
| PKG / Packaging Corporation of America | 0,11 | -36,85 | 20,59 | -42,75 | 0,6810 | -0,4914 | |||
| UBER / Uber Technologies, Inc. | 0,24 | -19,26 | 20,51 | -5,57 | 0,6785 | -0,0113 | |||
| APH / Amphenol Corporation | 0,22 | -60,94 | 20,00 | -47,25 | 0,6617 | -0,5747 | |||
| BRK.B / Berkshire Hathaway Inc. | 0,04 | 38,35 | 19,76 | 35,69 | 0,6538 | 0,1789 | |||
| MTZ / MasTec, Inc. | 0,13 | 64,77 | 19,72 | 96,75 | 0,6524 | 0,3256 | |||
| MSI / Motorola Solutions, Inc. | 0,05 | -42,80 | 19,40 | -46,03 | 0,6418 | -0,5301 | |||
| QCOM / QUALCOMM Incorporated | 0,13 | -31,99 | 18,32 | -37,17 | 0,6061 | -0,3447 | |||
| DIS / The Walt Disney Company | 0,15 | 2 074,99 | 17,38 | 2 415,05 | 0,5749 | 0,5506 | |||
| AMD / Advanced Micro Devices, Inc. | 0,16 | 13,87 | 17,22 | 26,27 | 0,5697 | 0,1250 | |||
| FDX / FedEx Corporation | 0,07 | -38,41 | 15,94 | -48,10 | 0,5273 | -0,5743 | |||
| MRVL / Marvell Technology, Inc. | 0,26 | 15,90 | 0,5261 | 0,5261 | |||||
| PLTR / Palantir Technologies Inc. | 0,12 | 15,89 | 0,5258 | 0,5258 | |||||
| EXPD / Expeditors International of Washington, Inc. | 0,14 | 9,01 | 15,87 | 4,71 | 0,5251 | 0,0309 | |||
| CME / CME Group Inc. | 0,05 | -50,81 | 15,71 | -43,98 | 0,5195 | -0,3946 | |||
| BIIB / Biogen Inc. | 0,12 | -15,25 | 15,70 | -21,71 | 0,5194 | -0,1345 | |||
| TRGP / Targa Resources Corp. | 0,10 | 63,84 | 15,05 | 200,00 | 0,4980 | 0,3304 | |||
| REGN / Regeneron Pharmaceuticals, Inc. | 0,03 | 284,75 | 15,04 | 128,97 | 0,4976 | 0,2620 | |||
| MA / Mastercard Incorporated | 0,03 | -24,33 | 14,88 | -23,11 | 0,4922 | -0,1387 | |||
| YUM / Yum! Brands, Inc. | 0,10 | 167,44 | 14,39 | 199,13 | 0,4760 | 0,3058 | |||
| PGR / The Progressive Corporation | 0,05 | -71,31 | 14,07 | -71,01 | 0,4654 | -1,1168 | |||
| FIX / Comfort Systems USA, Inc. | 0,03 | 11,45 | 13,97 | 46,70 | 0,4623 | 0,1517 | |||
| ESTC / Elastic N.V. | 0,16 | 13,14 | 0,4346 | 0,4346 | |||||
| BMRN / BioMarin Pharmaceutical Inc. | 0,22 | -3,16 | 13,02 | -20,97 | 0,4308 | -0,1065 | |||
| HAL / Halliburton Company | 0,61 | 2,66 | 11,87 | -23,73 | 0,3925 | -0,1147 | |||
| TOL / Toll Brothers, Inc. | 0,11 | 12,47 | 11,50 | 5,03 | 0,3803 | 0,0234 | |||
| DAL / Delta Air Lines, Inc. | 0,23 | -2,65 | 10,93 | -21,64 | 0,3616 | -0,0932 | |||
| NUE / Nucor Corporation | 0,10 | -42,56 | 10,76 | -54,31 | 0,3559 | -0,4117 | |||
| NOW / ServiceNow, Inc. | 0,01 | -65,68 | 10,63 | -62,68 | 0,3516 | -0,5768 | |||
| KO / The Coca-Cola Company | 0,15 | -63,89 | 10,49 | -56,63 | 0,3470 | -0,4532 | |||
| TXN / Texas Instruments Incorporated | 0,06 | 207,80 | 10,46 | 218,46 | 0,3459 | 0,2381 | |||
| NTRA / Natera, Inc. | 0,07 | 0,00 | 10,28 | 1,37 | 0,3401 | 0,0095 | |||
| CNC / Centene Corporation | 0,18 | -49,46 | 9,91 | -50,96 | 0,3280 | -0,3312 | |||
| INTU / Intuit Inc. | 0,01 | -50,09 | 9,59 | -41,40 | 0,3174 | -0,2026 | |||
| IVZ / Invesco Ltd. | 0,64 | -50,14 | 9,22 | -58,54 | 0,3050 | -0,4200 | |||
| FICO / Fair Isaac Corporation | 0,01 | -32,07 | 9,11 | -37,84 | 0,3013 | -0,1764 | |||
| UTHR / United Therapeutics Corporation | 0,03 | 27,56 | 9,06 | 27,09 | 0,2997 | 0,0673 | |||
| DHI / D.R. Horton, Inc. | 0,07 | -2,24 | 7,99 | -8,98 | 0,2645 | -0,0219 | |||
| DASH / DoorDash, Inc. | 0,03 | -71,77 | 5,83 | -70,32 | 0,1930 | -0,4479 | |||
| FCX / Freeport-McMoRan Inc. | 0,13 | -60,54 | 5,03 | -58,86 | 0,1665 | -0,2324 | |||
| S&P500 EMINI / DE (000000000) | 2,31 | 0,0765 | 0,0765 | ||||||
| SAIL / SailPoint, Inc. | 0,04 | 0,00 | 0,62 | -26,63 | 0,0205 | -0,0070 | |||
| FOX / Fox Corporation | 0,01 | 0,00 | 0,38 | -6,95 | 0,0124 | -0,0007 | |||
| IDCC / InterDigital, Inc. | 0,00 | 0,00 | 0,00 | 0,00 | 0,0000 | 0,0000 | |||
| RLJ / RLJ Lodging Trust | 0,00 | 0,00 | 0,00 | 0,0000 | -0,0000 | ||||
| DD / DuPont de Nemours, Inc. | 0,00 | -100,00 | 0,00 | -100,00 | -0,3475 | ||||
| FOXA / Fox Corporation | 0,00 | -100,00 | 0,00 | -100,00 | -0,3540 | ||||
| IRM / Iron Mountain Incorporated | 0,00 | -100,00 | 0,00 | -100,00 | -0,4602 | ||||
| ETSY / Etsy, Inc. | 0,00 | -100,00 | 0,00 | -100,00 | -0,3459 |