Statistiques de base
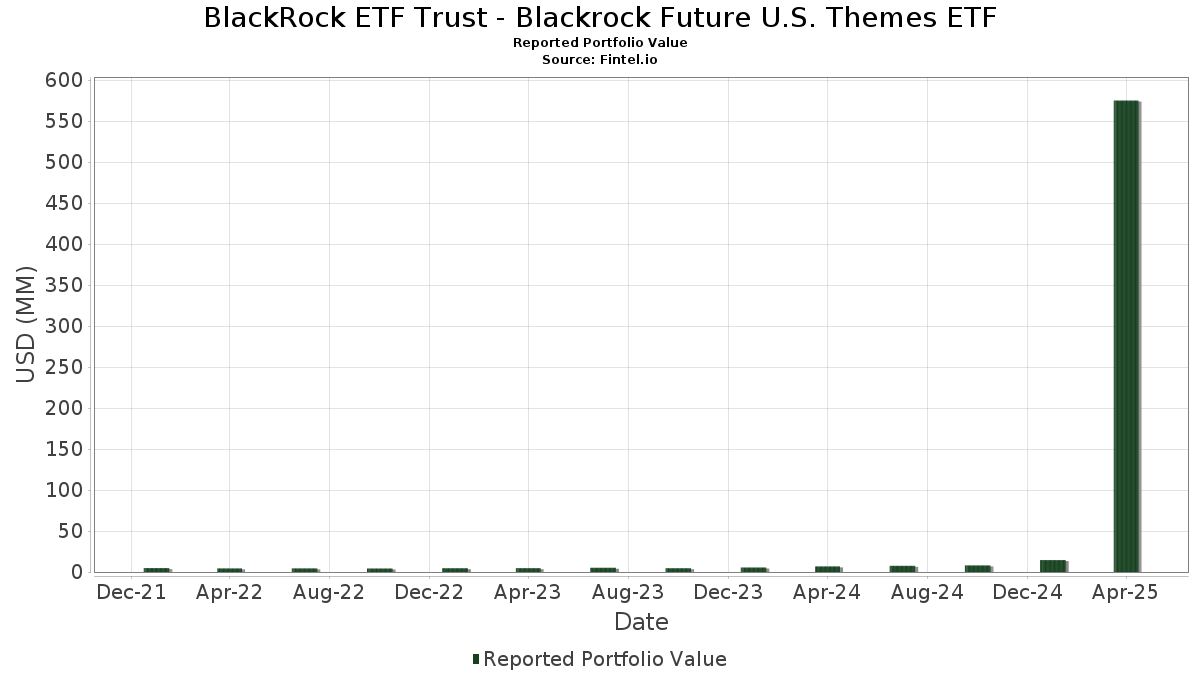
| Valeur du portefeuille | $ 574 936 151 |
| Positions actuelles | 197 |
Dernières positions, performances, ASG (à partir des dépôts 13F, 13D)
BlackRock ETF Trust - Blackrock Future U.S. Themes ETF a déclaré un total de 197 positions dans ses derniers dépôts auprès de la SEC. La valeur la plus récente du portefeuille est calculée à 574 936 151 USD. Les actifs sous gestion réels (ASG) sont cette valeur plus les liquidités (qui ne sont pas divulguées). Les principales positions de BlackRock ETF Trust - Blackrock Future U.S. Themes ETF sont NVIDIA Corporation (US:NVDA) , Apple Inc. (US:AAPL) , Microsoft Corporation (US:MSFT) , Amazon.com, Inc. (US:AMZN) , and Costco Wholesale Corporation (US:COST) . Les nouvelles positions de BlackRock ETF Trust - Blackrock Future U.S. Themes ETF incluent Eli Lilly and Company (US:LLY) , Merck & Co., Inc. (US:MRK) , Gilead Sciences, Inc. (US:GILD) , Palantir Technologies Inc. (US:PLTR) , and Cencora, Inc. (US:COR) .
Meilleures augmentations ce trimestre
Nous utilisons la variation de l'allocation du portefeuille car il s'agit de l'indicateur le plus significatif. Les changements peuvent être dus à des transactions ou à des variations de prix des actions.
| Titre | Actions (en millions) |
Valeur ($ en millions) |
% du portefeuille | ΔPortefeuille % |
|---|---|---|---|---|
| 0,01 | 7,14 | 1,2538 | 1,2538 | |
| 0,02 | 5,86 | 1,0275 | 0,9715 | |
| 0,01 | 8,06 | 1,4146 | 0,9375 | |
| 0,03 | 7,23 | 1,2681 | 0,8995 | |
| 5,14 | 5,14 | 0,9020 | 0,8270 | |
| 0,01 | 5,39 | 0,9451 | 0,8162 | |
| 0,16 | 35,03 | 6,1479 | 0,6728 | |
| 0,01 | 3,45 | 0,6052 | 0,6052 | |
| 0,04 | 3,01 | 0,5277 | 0,5277 | |
| 0,03 | 2,78 | 0,4878 | 0,4878 |
Principales baisses ce trimestre
Nous utilisons la variation de l'allocation du portefeuille car il s'agit de l'indicateur le plus significatif. Les changements peuvent être dus à des transactions ou à des variations de prix des actions.
| Titre | Actions (en millions) |
Valeur ($ en millions) |
% du portefeuille | ΔPortefeuille % |
|---|---|---|---|---|
| 0,01 | 1,85 | 0,3241 | -2,1265 | |
| 0,00 | 0,29 | 0,0509 | -1,9980 | |
| 0,00 | 0,30 | 0,0525 | -1,5531 | |
| 0,00 | 1,67 | 0,2923 | -1,4408 | |
| 0,00 | 1,36 | 0,2391 | -1,2581 | |
| 0,00 | 0,30 | 0,0520 | -1,1962 | |
| 0,06 | 8,79 | 1,5428 | -0,9298 | |
| 0,00 | 0,16 | 0,0285 | -0,9290 | |
| 0,01 | 1,27 | 0,2236 | -0,8116 | |
| 0,11 | 19,86 | 3,4854 | -0,6797 |
Déclarations 13F et dépôts de fonds
Ce formulaire a été déposé le 2025-06-26 pour la période de déclaration 2025-04-30. Cliquez sur l'icône du lien pour voir l'historique complet des transactions.
Mettre à niveau pour débloquer les données premium et exporter vers Excel ![]() .
.
| Titre | Type | Prix moyen de l'action | Actions (en millions) |
ΔActions (%) |
ΔActions (%) |
Valeur ($ en millions) |
Portefeuille (%) |
ΔPortefeuille (%) |
|
|---|---|---|---|---|---|---|---|---|---|
| NVDA / NVIDIA Corporation | 0,33 | 4 156,82 | 36,29 | 3 764,22 | 6,3676 | -0,0975 | |||
| AAPL / Apple Inc. | 0,16 | 4 789,23 | 35,03 | 4 306,67 | 6,1479 | 0,6728 | |||
| MSFT / Microsoft Corporation | 0,08 | 3 898,04 | 29,90 | 3 708,66 | 5,2468 | -0,1561 | |||
| AMZN / Amazon.com, Inc. | 0,11 | 4 128,35 | 19,86 | 3 182,81 | 3,4854 | -0,6797 | |||
| COST / Costco Wholesale Corporation | 0,02 | 3 967,95 | 17,92 | 4 029,26 | 3,1450 | 0,1585 | |||
| BSX / Boston Scientific Corporation | 0,16 | 4 132,66 | 16,57 | 4 159,90 | 2,9081 | 0,2277 | |||
| META / Meta Platforms, Inc. | 0,03 | 4 707,84 | 15,15 | 3 735,44 | 2,6587 | -0,0630 | |||
| TJX / The TJX Companies, Inc. | 0,11 | 2 919,11 | 14,74 | 3 016,07 | 2,5866 | -0,6708 | |||
| CHKP / Check Point Software Technologies Ltd. | 0,06 | 4 125,62 | 12,31 | 4 159,86 | 2,1605 | 0,1700 | |||
| US0669224778 / BlackRock Cash Funds: Treasury, SL Agency Shares | 10,66 | 4 000,00 | 10,66 | 4 000,00 | 1,8707 | 0,0818 | |||
| WMT / Walmart Inc. | 0,11 | 3 220,31 | 10,57 | 3 194,08 | 1,8558 | -0,3560 | |||
| AVGO / Broadcom Inc. | 0,05 | 4 151,06 | 10,45 | 3 604,96 | 1,8335 | -0,1105 | |||
| GOOGL / Alphabet Inc. | 0,06 | 4 158,79 | 9,47 | 3 222,11 | 1,6615 | -0,3036 | |||
| APH / Amphenol Corporation | 0,12 | 2 833,79 | 9,04 | 3 093,99 | 1,5863 | -0,3636 | |||
| ROST / Ross Stores, Inc. | 0,06 | 2 549,77 | 8,79 | 2 348,75 | 1,5428 | -0,9298 | |||
| ISRG / Intuitive Surgical, Inc. | 0,02 | 4 222,76 | 8,72 | 3 809,42 | 1,5299 | -0,0085 | |||
| PG / The Procter & Gamble Company | 0,05 | 3 446,67 | 8,23 | 3 386,02 | 1,4439 | -0,1858 | |||
| NFLX / Netflix, Inc. | 0,01 | 9 932,39 | 8,06 | 11 582,61 | 1,4146 | 0,9375 | |||
| GOOG / Alphabet Inc. | 0,05 | 4 116,71 | 7,88 | 3 209,24 | 1,3822 | -0,2601 | |||
| SYK / Stryker Corporation | 0,02 | 4 111,40 | 7,32 | 3 945,30 | 1,2850 | 0,0331 | |||
| MMC / Marsh & McLennan Companies, Inc. | 0,03 | 12 875,30 | 7,23 | 13 533,96 | 1,2681 | 0,8995 | |||
| LLY / Eli Lilly and Company | 0,01 | 7,14 | 1,2538 | 1,2538 | |||||
| LOW / Lowe's Companies, Inc. | 0,03 | 3 184,10 | 6,37 | 2 732,00 | 1,1183 | -0,4346 | |||
| GE / General Electric Company | 0,03 | 3 144,58 | 6,28 | 3 118,97 | 1,1016 | -0,2429 | |||
| CL / Colgate-Palmolive Company | 0,07 | 3 446,04 | 6,16 | 3 676,07 | 1,0802 | -0,0430 | |||
| PPC / Pilgrim's Pride Corporation | 0,11 | 3 314,35 | 5,97 | 3 909,40 | 1,0484 | 0,0219 | |||
| PGR / The Progressive Corporation | 0,02 | 62 875,76 | 5,86 | 73 087,50 | 1,0275 | 0,9715 | |||
| BRK.A / Berkshire Hathaway Inc. | 0,01 | 25 150,00 | 5,39 | 29 816,67 | 0,9451 | 0,8162 | |||
| US0669225197 / BlackRock Cash Funds: Institutional, SL Agency Shares | 5,14 | 47 048,07 | 5,14 | 51 300,00 | 0,9020 | 0,8270 | |||
| CSCO / Cisco Systems, Inc. | 0,09 | 5 050,75 | 5,14 | 4 840,38 | 0,9017 | 0,1812 | |||
| LIN / Linde plc | 0,01 | 4 248,44 | 4,43 | 4 334,00 | 0,7782 | 0,0876 | |||
| SSNC / SS&C Technologies Holdings, Inc. | 0,06 | 3 546,07 | 4,34 | 3 320,47 | 0,7623 | -0,1154 | |||
| FI / Fiserv, Inc. | 0,02 | 5 329,81 | 4,27 | 4 540,22 | 0,7492 | 0,1160 | |||
| GGG / Graco Inc. | 0,05 | 3 409,68 | 4,26 | 3 309,60 | 0,7479 | -0,1138 | |||
| RSG / Republic Services, Inc. | 0,02 | 4 117,46 | 4,24 | 4 830,23 | 0,7442 | 0,1458 | |||
| WCN / Waste Connections, Inc. | 0,02 | 4 105,51 | 4,22 | 4 439,78 | 0,7409 | 0,0986 | |||
| TRGP / Targa Resources Corp. | 0,02 | 4 494,97 | 4,22 | 3 915,24 | 0,7400 | 0,0129 | |||
| GDDY / GoDaddy Inc. | 0,02 | 4 129,90 | 4,02 | 3 658,88 | 0,7060 | -0,0329 | |||
| EME / EMCOR Group, Inc. | 0,01 | 2 682,26 | 3,65 | 2 396,58 | 0,6397 | -0,3683 | |||
| CVLT / Commvault Systems, Inc. | 0,02 | 3 489,75 | 3,57 | 3 696,81 | 0,6264 | -0,0255 | |||
| DTM / DT Midstream, Inc. | 0,04 | 3 840,17 | 3,55 | 3 712,90 | 0,6223 | -0,0216 | |||
| TSLA / Tesla, Inc. | 0,01 | 3,45 | 0,6052 | 0,6052 | |||||
| EW / Edwards Lifesciences Corporation | 0,04 | 4 739,84 | 3,29 | 4 963,08 | 0,5777 | 0,1286 | |||
| TXN / Texas Instruments Incorporated | 0,02 | 5 055,92 | 3,28 | 3 995,00 | 0,5749 | -0,4606 | |||
| ACN / Accenture plc | 0,01 | 4 221,86 | 3,19 | 3 261,05 | 0,5604 | -0,0938 | |||
| BMI / Badger Meter, Inc. | 0,01 | 4 162,87 | 3,14 | 4 328,17 | 0,5517 | 0,0602 | |||
| ITT / ITT Inc. | 0,02 | 3 085,31 | 3,09 | 2 815,09 | 0,5423 | -0,1934 | |||
| UBER / Uber Technologies, Inc. | 0,04 | 3,01 | 0,5277 | 0,5277 | |||||
| BOX / Box, Inc. | 0,10 | 4 149,17 | 2,97 | 3 916,22 | 0,5217 | 0,0069 | |||
| TT / Trane Technologies plc | 0,01 | 1 620,14 | 2,88 | 1 723,42 | 0,5056 | -0,5850 | |||
| PEN / Penumbra, Inc. | 0,01 | 4 174,24 | 2,87 | 4 598,36 | 0,5030 | 0,0824 | |||
| MRK / Merck & Co., Inc. | 0,03 | 2,78 | 0,4878 | 0,4878 | |||||
| GILD / Gilead Sciences, Inc. | 0,03 | 2,77 | 0,4868 | 0,4868 | |||||
| MSI / Motorola Solutions, Inc. | 0,01 | 3 924,52 | 2,75 | 3 715,28 | 0,4821 | -0,0183 | |||
| SFM / Sprouts Farmers Market, Inc. | 0,01 | 3 773,47 | 2,50 | 4 132,20 | 0,4382 | 0,0275 | |||
| PTC / PTC Inc. | 0,02 | 4 073,44 | 2,48 | 3 255,41 | 0,4358 | -0,0753 | |||
| DDS / Dillard's, Inc. | 0,01 | 4 318,01 | 2,47 | 3 186,67 | 0,4327 | -0,0858 | |||
| JBL / Jabil Inc. | 0,02 | 3 865,25 | 2,46 | 3 514,71 | 0,4314 | -0,0413 | |||
| LII / Lennox International Inc. | 0,00 | 2 501,86 | 2,29 | 2 310,53 | 0,4019 | -0,2543 | |||
| CLH / Clean Harbors, Inc. | 0,01 | 4 187,95 | 2,28 | 3 837,93 | 0,4008 | 0,0017 | |||
| MCK / McKesson Corporation | 0,00 | 5 058,06 | 2,28 | 6 230,56 | 0,4000 | 0,1463 | |||
| ATR / AptarGroup, Inc. | 0,01 | 3 630,05 | 2,21 | 3 470,97 | 0,3887 | -0,0395 | |||
| PLTR / Palantir Technologies Inc. | 0,02 | 2,15 | 0,3778 | 0,3778 | |||||
| AMAT / Applied Materials, Inc. | 0,01 | 6 230,22 | 2,15 | 5 265,00 | 0,3767 | 0,0975 | |||
| FFIV / F5, Inc. | 0,01 | 4 273,77 | 2,12 | 3 822,22 | 0,3718 | -0,0024 | |||
| LNW / Light & Wonder, Inc. | 0,02 | 4 422,20 | 1,97 | 4 365,91 | 0,3449 | 0,0370 | |||
| GMED / Globus Medical, Inc. | 0,03 | 4 105,51 | 1,92 | 3 203,45 | 0,3363 | -0,0687 | |||
| KR / The Kroger Co. | 0,03 | 4 084,44 | 1,86 | 4 805,26 | 0,3272 | 0,0655 | |||
| V / Visa Inc. | 0,01 | 950,29 | 1,85 | 1 426,45 | 0,3241 | -2,1265 | |||
| CPRT / Copart, Inc. | 0,03 | 2 465,65 | 1,85 | 2 614,71 | 0,3240 | -0,1459 | |||
| MLI / Mueller Industries, Inc. | 0,02 | 2 070,67 | 1,83 | 1 937,78 | 0,3220 | -0,3006 | |||
| GWW / W.W. Grainger, Inc. | 0,00 | 4 041,86 | 1,82 | 3 953,33 | 0,3201 | 0,0058 | |||
| HLT / Hilton Worldwide Holdings Inc. | 0,01 | 3 990,31 | 1,81 | 3 514,00 | 0,3172 | -0,0281 | |||
| AXS / AXIS Capital Holdings Limited | 0,02 | 4 156,95 | 1,80 | 4 515,38 | 0,3159 | 0,0410 | |||
| SNPS / Synopsys, Inc. | 0,00 | 2 003,26 | 1,78 | 1 750,00 | 0,3117 | -0,3535 | |||
| HES / Hess Corporation | 0,01 | 19 236,62 | 1,77 | 19 577,78 | 0,3109 | 0,1232 | |||
| SNX / TD SYNNEX Corporation | 0,02 | 4 220,86 | 1,68 | 3 318,37 | 0,2940 | -0,0491 | |||
| UNH / UnitedHealth Group Incorporated | 0,00 | 2 148,89 | 1,67 | 1 709,78 | 0,2923 | -1,4408 | |||
| SPOT / Spotify Technology S.A. | 0,00 | 3 833,82 | 1,64 | 4 337,84 | 0,2882 | 0,0316 | |||
| DY / Dycom Industries, Inc. | 0,01 | 2 806,23 | 1,64 | 2 503,17 | 0,2880 | -0,1506 | |||
| AXON / Axon Enterprise, Inc. | 0,00 | 4 345,00 | 1,64 | 4 092,31 | 0,2870 | 0,0178 | |||
| CAH / Cardinal Health, Inc. | 0,01 | 50 226,09 | 1,64 | 81 650,00 | 0,2870 | 0,2674 | |||
| CDNS / Cadence Design Systems, Inc. | 0,01 | 1 182,63 | 1,63 | 1 190,48 | 0,2855 | -0,5868 | |||
| ADP / Automatic Data Processing, Inc. | 0,01 | 3 950,00 | 1,61 | 4 020,51 | 0,2820 | 0,0068 | |||
| MTZ / MasTec, Inc. | 0,01 | 2 498,96 | 1,59 | 2 197,10 | 0,2781 | -0,2000 | |||
| THC / Tenet Healthcare Corporation | 0,01 | 2 229,48 | 1,53 | 4 021,62 | 0,2676 | -0,4454 | |||
| RLI / RLI Corp. | 0,02 | 4 104,11 | 1,52 | 4 228,57 | 0,2659 | 0,0201 | |||
| ORCL / Oracle Corporation | 0,01 | 2 218,95 | 1,50 | 1 819,23 | 0,2628 | -0,2742 | |||
| DCI / Donaldson Company, Inc. | 0,02 | 3 116,88 | 1,47 | 2 889,80 | 0,2571 | -0,0823 | |||
| COR / Cencora, Inc. | 0,00 | 1,45 | 0,2542 | 0,2542 | |||||
| HCA / HCA Healthcare, Inc. | 0,00 | 1 413,03 | 1,36 | 1 624,05 | 0,2391 | -1,2581 | |||
| HESM / Hess Midstream LP | 0,04 | 3 792,02 | 1,32 | 3 475,68 | 0,2323 | -0,0227 | |||
| EOG / EOG Resources, Inc. | 0,01 | 6 671,26 | 1,30 | 5 804,55 | 0,2281 | -0,1133 | |||
| LECO / Lincoln Electric Holdings, Inc. | 0,01 | 2 260,13 | 1,29 | 2 019,67 | 0,2270 | -0,1984 | |||
| BMY / Bristol-Myers Squibb Company | 0,03 | 9 922,66 | 1,29 | 6 678,95 | 0,2260 | -0,2535 | |||
| CRUS / Cirrus Logic, Inc. | 0,01 | 4 164,54 | 1,28 | 4 032,26 | 0,2250 | 0,0087 | |||
| COP / ConocoPhillips | 0,01 | 2 476,58 | 1,27 | 1 746,38 | 0,2236 | -0,8116 | |||
| CB / Chubb Limited | 0,00 | 44 370,00 | 1,27 | 63 500,00 | 0,2233 | 0,1779 | |||
| 0XHL / Aon plc | 0,00 | 1,26 | 0,2220 | 0,2220 | |||||
| ORLY / O'Reilly Automotive, Inc. | 0,00 | 3 950,00 | 1,26 | 4 400,00 | 0,2213 | 0,0253 | |||
| EHC / Encompass Health Corporation | 0,01 | 4 026,25 | 1,25 | 4 900,00 | 0,2194 | 0,0425 | |||
| KLAC / KLA Corporation | 0,00 | 9 783,33 | 1,25 | 9 515,38 | 0,2194 | 0,1279 | |||
| NTAP / NetApp, Inc. | 0,01 | 3 608,78 | 1,18 | 2 632,56 | 0,2062 | -0,0903 | |||
| EA / Electronic Arts Inc. | 0,01 | 4 297,25 | 1,16 | 5 177,27 | 0,2038 | 0,0499 | |||
| IT / Gartner, Inc. | 0,00 | 4 010,77 | 1,13 | 3 114,29 | 0,1974 | -0,0453 | |||
| TMHC / Taylor Morrison Home Corporation | 0,02 | 2 982,36 | 1,12 | 2 705,00 | 0,1970 | -0,0846 | |||
| EXPD / Expeditors International of Washington, Inc. | 0,01 | 3 605,13 | 1,11 | 3 483,87 | 0,1951 | -0,0182 | |||
| JKHY / Jack Henry & Associates, Inc. | 0,01 | 1,08 | 0,1897 | 0,1897 | |||||
| SKY / Champion Homes, Inc. | 0,01 | 3 093,59 | 1,08 | 2 891,67 | 0,1891 | -0,0587 | |||
| FIX / Comfort Systems USA, Inc. | 0,00 | 1 659,87 | 1,06 | 1 510,61 | 0,1866 | -0,2701 | |||
| MAR / Marriott International, Inc. | 0,00 | 3 382,03 | 1,06 | 2 772,97 | 0,1866 | -0,0693 | |||
| VRSK / Verisk Analytics, Inc. | 0,00 | 3 862,22 | 1,06 | 4 128,00 | 0,1855 | 0,0075 | |||
| GRMN / Garmin Ltd. | 0,01 | 2 725,91 | 1,02 | 2 385,37 | 0,1789 | -0,1078 | |||
| ADSK / Autodesk, Inc. | 0,00 | 4 634,67 | 0,97 | 4 130,43 | 0,1709 | 0,0102 | |||
| AMD / Advanced Micro Devices, Inc. | 0,01 | 0,95 | 0,1673 | 0,1673 | |||||
| PSTG / Pure Storage, Inc. | 0,02 | 1 252,25 | 0,90 | 808,08 | 0,1578 | -0,5259 | |||
| MUSA / Murphy USA Inc. | 0,00 | 3 778,26 | 0,89 | 3 765,22 | 0,1561 | -0,0031 | |||
| IBM / International Business Machines Corporation | 0,00 | 0,86 | 0,1514 | 0,1514 | |||||
| AJG / Arthur J. Gallagher & Co. | 0,00 | 0,86 | 0,1504 | 0,1504 | |||||
| VLTO / Veralto Corporation | 0,01 | 4 218,45 | 0,85 | 3 961,90 | 0,1497 | 0,0032 | |||
| LKQ / LKQ Corporation | 0,02 | 4 083,65 | 0,85 | 4 373,68 | 0,1492 | 0,0124 | |||
| ABT / Abbott Laboratories | 0,01 | 0,85 | 0,1488 | 0,1488 | |||||
| DKS / DICK'S Sporting Goods, Inc. | 0,00 | 1 655,51 | 0,84 | 1 295,00 | 0,1469 | -0,2726 | |||
| LNG / Cheniere Energy, Inc. | 0,00 | 0,81 | 0,1416 | 0,1416 | |||||
| HUBB / Hubbell Incorporated | 0,00 | 2 381,93 | 0,75 | 2 037,14 | 0,1313 | -0,1103 | |||
| WSM / Williams-Sonoma, Inc. | 0,00 | 2 682,76 | 0,75 | 1 975,00 | 0,1313 | -0,1218 | |||
| FLR / Fluor Corporation | 0,02 | 2 649,03 | 0,75 | 1 913,51 | 0,1308 | -0,1269 | |||
| BKR / Baker Hughes Company | 0,02 | 4 155,30 | 0,72 | 3 190,91 | 0,1272 | -0,0257 | |||
| FOXA / Fox Corporation | 0,01 | 0,71 | 0,1245 | 0,1245 | |||||
| ABBV / AbbVie Inc. | 0,00 | 2 076,22 | 0,70 | 2 926,09 | 0,1222 | -0,4190 | |||
| ADI / Analog Devices, Inc. | 0,00 | 3 819,78 | 0,70 | 3 557,89 | 0,1220 | -0,0107 | |||
| FSLR / First Solar, Inc. | 0,01 | 0,69 | 0,1211 | 0,1211 | |||||
| CRM / Salesforce, Inc. | 0,00 | 7 128,57 | 0,68 | 7 444,44 | 0,1193 | -0,0205 | |||
| MDT / Medtronic plc | 0,01 | 0,68 | 0,1191 | 0,1191 | |||||
| ECL / Ecolab Inc. | 0,00 | 4 010,77 | 0,67 | 4 093,75 | 0,1179 | 0,0060 | |||
| CACI / CACI International Inc | 0,00 | 3 131,11 | 0,67 | 3 811,76 | 0,1168 | -0,0028 | |||
| AWI / Armstrong World Industries, Inc. | 0,00 | 2 881,51 | 0,63 | 2 768,18 | 0,1108 | -0,0409 | |||
| SM / SM Energy Company | 0,03 | 4 170,12 | 0,63 | 2 516,67 | 0,1103 | -0,0584 | |||
| WM / Waste Management, Inc. | 0,00 | 4 345,00 | 0,62 | 4 684,62 | 0,1092 | 0,0183 | |||
| BRO / Brown & Brown, Inc. | 0,01 | 8 642,62 | 0,59 | 9 716,67 | 0,1035 | 0,0596 | |||
| MMSI / Merit Medical Systems, Inc. | 0,01 | 4 440,15 | 0,59 | 4 092,86 | 0,1031 | 0,0005 | |||
| TENB / Tenable Holdings, Inc. | 0,02 | 4 082,55 | 0,57 | 2 905,26 | 0,1003 | -0,0322 | |||
| EXPE / Expedia Group, Inc. | 0,00 | 0,56 | 0,0980 | 0,0980 | |||||
| ANF / Abercrombie & Fitch Co. | 0,01 | 2 758,33 | 0,55 | 1 609,38 | 0,0961 | -0,1306 | |||
| GWRE / Guidewire Software, Inc. | 0,00 | 4 827,78 | 0,54 | 4 845,45 | 0,0956 | 0,0171 | |||
| ALL / The Allstate Corporation | 0,00 | 0,53 | 0,0929 | 0,0929 | |||||
| ACM / AECOM | 0,01 | 2 382,33 | 0,53 | 2 290,91 | 0,0924 | -0,0636 | |||
| EXLS / ExlService Holdings, Inc. | 0,01 | 4 187,95 | 0,52 | 4 208,33 | 0,0908 | 0,0047 | |||
| TMUS / T-Mobile US, Inc. | 0,00 | 0,50 | 0,0881 | 0,0881 | |||||
| QTWO / Q2 Holdings, Inc. | 0,01 | 4 166,44 | 0,49 | 3 692,31 | 0,0866 | -0,0090 | |||
| NE / Noble Corporation plc | 0,02 | 4 122,39 | 0,48 | 2 918,75 | 0,0849 | -0,0313 | |||
| USFD / US Foods Holding Corp. | 0,01 | 4 265,03 | 0,47 | 4 145,45 | 0,0820 | 0,0024 | |||
| QCOM / QUALCOMM Incorporated | 0,00 | 1 268,61 | 0,45 | 1 158,33 | 0,0795 | -0,3865 | |||
| LRCX / Lam Research Corporation | 0,01 | 1 631,94 | 0,45 | 1 615,38 | 0,0784 | -0,2652 | |||
| SPGI / S&P Global Inc. | 0,00 | 29 566,67 | 0,45 | 44 400,00 | 0,0781 | 0,0521 | |||
| ONTO / Onto Innovation Inc. | 0,00 | 4 634,67 | 0,43 | 2 786,67 | 0,0760 | -0,0297 | |||
| NOC / Northrop Grumman Corporation | 0,00 | 5 431,25 | 0,43 | 6 042,86 | 0,0756 | 0,0219 | |||
| OTIS / Otis Worldwide Corporation | 0,00 | 3 879,46 | 0,43 | 4 190,00 | 0,0753 | 0,0018 | |||
| ALSN / Allison Transmission Holdings, Inc. | 0,00 | 3 914,41 | 0,41 | 3 061,54 | 0,0721 | -0,0176 | |||
| WEC / WEC Energy Group, Inc. | 0,00 | 0,39 | 0,0682 | 0,0682 | |||||
| CTAS / Cintas Corporation | 0,00 | 3 950,00 | 0,38 | 4 612,50 | 0,0662 | 0,0055 | |||
| BDX / Becton, Dickinson and Company | 0,00 | 16 154,55 | 0,37 | 18 400,00 | 0,0650 | 0,0037 | |||
| HALO / Halozyme Therapeutics, Inc. | 0,01 | 0,35 | 0,0618 | 0,0618 | |||||
| CRS / Carpenter Technology Corporation | 0,00 | 931,40 | 0,35 | 951,52 | 0,0609 | -0,1676 | |||
| WAB / Westinghouse Air Brake Technologies Corporation | 0,00 | 4 345,00 | 0,33 | 4 000,00 | 0,0576 | 0,0004 | |||
| TDW / Tidewater Inc. | 0,01 | 2 928,23 | 0,32 | 1 912,50 | 0,0565 | -0,0549 | |||
| DOX / Amdocs Limited | 0,00 | 4 573,68 | 0,31 | 5 133,33 | 0,0552 | 0,0091 | |||
| DECK / Deckers Outdoor Corporation | 0,00 | 577,00 | 0,30 | 328,57 | 0,0527 | -0,4354 | |||
| ICE / Intercontinental Exchange, Inc. | 0,00 | 196,67 | 0,30 | 331,88 | 0,0525 | -1,5531 | |||
| XOM / Exxon Mobil Corporation | 0,00 | 257,45 | 0,30 | 218,28 | 0,0520 | -1,1962 | |||
| CVX / Chevron Corporation | 0,00 | 234,33 | 0,29 | 215,22 | 0,0509 | -1,9980 | |||
| TDC / Teradata Corporation | 0,01 | 4 099,06 | 0,29 | 2 770,00 | 0,0504 | -0,0194 | |||
| APP / AppLovin Corporation | 0,00 | 0,24 | 0,0423 | 0,0423 | |||||
| VST / Vistra Corp. | 0,00 | 0,23 | 0,0407 | 0,0407 | |||||
| ZETA / Zeta Global Holdings Corp. | 0,02 | 4 201,27 | 0,22 | 3 042,86 | 0,0387 | -0,0109 | |||
| AYI / Acuity Inc. | 0,00 | 4 827,78 | 0,22 | 4 220,00 | 0,0379 | -0,0032 | |||
| CHD / Church & Dwight Co., Inc. | 0,00 | 2 367,86 | 0,21 | 2 462,50 | 0,0361 | -0,0248 | |||
| HIG / The Hartford Insurance Group, Inc. | 0,00 | 0,20 | 0,0349 | 0,0349 | |||||
| CMS / CMS Energy Corporation | 0,00 | 0,20 | 0,0346 | 0,0346 | |||||
| ZBH / Zimmer Biomet Holdings, Inc. | 0,00 | 0,18 | 0,0322 | 0,0322 | |||||
| PANW / Palo Alto Networks, Inc. | 0,00 | 4 573,68 | 0,17 | 5 400,00 | 0,0291 | 0,0050 | |||
| DELL / Dell Technologies Inc. | 0,00 | 188,11 | 0,16 | 224,00 | 0,0285 | -0,9290 | |||
| AMG / Affiliated Managers Group, Inc. | 0,00 | 963,04 | 0,16 | 847,06 | 0,0284 | -0,0905 | |||
| MANH / Manhattan Associates, Inc. | 0,00 | 3 950,00 | 0,16 | 3 850,00 | 0,0277 | -0,0038 | |||
| FTI / TechnipFMC plc | 0,01 | 3 891,04 | 0,15 | 3 650,00 | 0,0264 | -0,0013 | |||
| ESNT / Essent Group Ltd. | 0,00 | 633,53 | 0,14 | 626,32 | 0,0243 | -0,1084 | |||
| PAG / Penske Automotive Group, Inc. | 0,00 | 720,00 | 0,13 | 688,24 | 0,0235 | -0,0961 | |||
| JNPR / Juniper Networks, Inc. | 0,00 | 0,13 | 0,0227 | 0,0227 | |||||
| FTNT / Fortinet, Inc. | 0,00 | 5 436,36 | 0,13 | 12 500,00 | 0,0222 | 0,0015 | |||
| CXT / Crane NXT, Co. | 0,00 | 3 833,82 | 0,13 | 3 025,00 | 0,0220 | -0,0079 | |||
| EQT / EQT Corporation | 0,00 | 361,18 | 0,12 | 547,37 | 0,0216 | -0,3387 | |||
| GAP / The Gap, Inc. | 0,00 | 666,95 | 0,10 | 607,14 | 0,0175 | -0,0807 | |||
| GPC / Genuine Parts Company | 0,00 | 1 755,00 | 0,09 | 2 075,00 | 0,0153 | -0,0167 | |||
| KLG / WK Kellogg Co | 0,00 | 4 023,15 | 0,08 | 7 800,00 | 0,0140 | 0,0017 | |||
| AZO / AutoZone, Inc. | 0,00 | 0,00 | 0,02 | 15,38 | 0,0026 | -0,0896 | |||
| ADBE / Adobe Inc. | 0,00 | 0,00 | 0,00 | 0,0001 | -0,0059 | ||||
| HWM / Howmet Aerospace Inc. | 0,00 | -100,00 | 0,00 | -100,00 | -0,3092 | ||||
| PNR / Pentair plc | 0,00 | -100,00 | 0,00 | -100,00 | -0,0392 | ||||
| CSL / Carlisle Companies Incorporated | 0,00 | -100,00 | 0,00 | -100,00 | -0,1099 | ||||
| SP500 MIC EMIN FUTJUN25 / DE (000000000) | -0,00 | -0,0002 | -0,0002 |