Statistiques de base
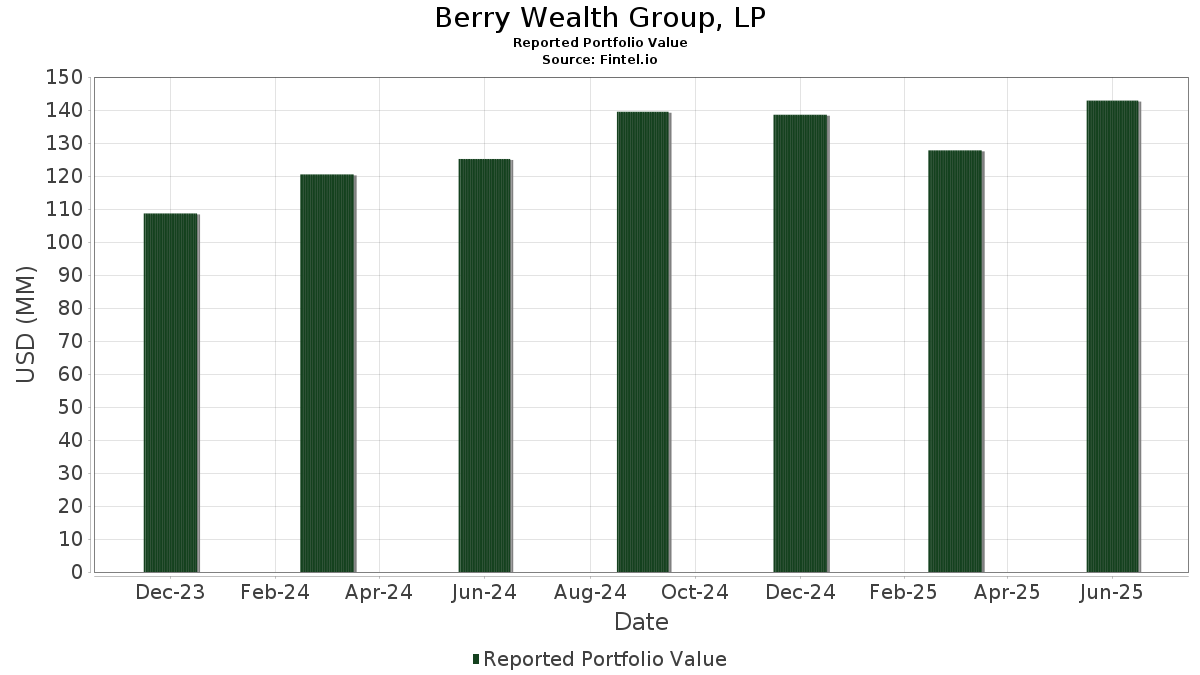
| Valeur du portefeuille | $ 142 919 665 |
| Positions actuelles | 107 |
Dernières positions, performances, ASG (à partir des dépôts 13F, 13D)
Berry Wealth Group, LP a déclaré un total de 107 positions dans ses derniers dépôts auprès de la SEC. La valeur la plus récente du portefeuille est calculée à 142 919 665 USD. Les actifs sous gestion réels (ASG) sont cette valeur plus les liquidités (qui ne sont pas divulguées). Les principales positions de Berry Wealth Group, LP sont Broadcom Inc. (US:AVGO) , Microsoft Corporation (US:MSFT) , JPMorgan Chase & Co. (US:JPM) , Apple Inc. (US:AAPL) , and Eaton Corporation plc (US:ETN) . Les nouvelles positions de Berry Wealth Group, LP incluent JFrog Ltd. (US:FROG) , Mondelez International, Inc. (US:MDLZ) , GE Vernova Inc. (US:GEV) , Amgen Inc. (US:AMGN) , and Williams-Sonoma, Inc. (US:WSM) .
Meilleures augmentations ce trimestre
Nous utilisons la variation de l'allocation du portefeuille car il s'agit de l'indicateur le plus significatif. Les changements peuvent être dus à des transactions ou à des variations de prix des actions.
| Titre | Actions (en millions) |
Valeur ($ en millions) |
% du portefeuille | ΔPortefeuille % |
|---|---|---|---|---|
| 0,05 | 12,73 | 8,9098 | 2,8943 | |
| 0,02 | 3,12 | 2,1825 | 1,7070 | |
| 0,02 | 9,18 | 6,4226 | 1,0384 | |
| 0,02 | 6,91 | 4,8363 | 0,7486 | |
| 0,01 | 1,86 | 1,3044 | 0,3360 | |
| 0,03 | 8,18 | 5,7223 | 0,3136 | |
| 0,02 | 2,53 | 1,7720 | 0,2737 | |
| 0,00 | 1,48 | 1,0382 | 0,2008 | |
| 0,01 | 0,27 | 0,1912 | 0,1912 | |
| 0,00 | 0,27 | 0,1898 | 0,1898 |
Principales baisses ce trimestre
Nous utilisons la variation de l'allocation du portefeuille car il s'agit de l'indicateur le plus significatif. Les changements peuvent être dus à des transactions ou à des variations de prix des actions.
| Titre | Actions (en millions) |
Valeur ($ en millions) |
% du portefeuille | ΔPortefeuille % |
|---|---|---|---|---|
| 0,01 | 1,61 | 1,1253 | -1,1793 | |
| 0,04 | 8,16 | 5,7070 | -1,1393 | |
| 0,02 | 6,82 | 4,7744 | -0,7508 | |
| 0,01 | 3,96 | 2,7689 | -0,4649 | |
| 0,02 | 2,80 | 1,9597 | -0,4526 | |
| 0,01 | 2,51 | 1,7561 | -0,2914 | |
| 0,01 | 4,53 | 3,1666 | -0,2871 | |
| 0,04 | 2,44 | 1,7047 | -0,2584 | |
| 0,05 | 2,04 | 1,4289 | -0,2537 | |
| 0,03 | 2,26 | 1,5788 | -0,2352 |
Déclarations 13F et dépôts de fonds
Ce formulaire a été déposé le 2025-08-13 pour la période de déclaration 2025-06-30. Cliquez sur l'icône du lien pour voir l'historique complet des transactions.
Mettre à niveau pour débloquer les données premium et exporter vers Excel ![]() .
.
| Titre | Type | Prix moyen de l'action | Actions (en millions) |
ΔActions (%) |
ΔActions (%) |
Valeur ($ en millions) |
Portefeuille (%) |
ΔPortefeuille (%) |
|
|---|---|---|---|---|---|---|---|---|---|
| AVGO / Broadcom Inc. | 0,05 | 0,59 | 12,73 | 65,60 | 8,9098 | 2,8943 | |||
| MSFT / Microsoft Corporation | 0,02 | 0,65 | 9,18 | 33,38 | 6,4226 | 1,0384 | |||
| JPM / JPMorgan Chase & Co. | 0,03 | 0,09 | 8,18 | 18,30 | 5,7223 | 0,3136 | |||
| AAPL / Apple Inc. | 0,04 | 0,90 | 8,16 | -6,80 | 5,7070 | -1,1393 | |||
| ETN / Eaton Corporation plc | 0,02 | 0,73 | 6,91 | 32,27 | 4,8363 | 0,7486 | |||
| MSI / Motorola Solutions, Inc. | 0,02 | 0,60 | 6,82 | -3,38 | 4,7744 | -0,7508 | |||
| WMT / Walmart Inc. | 0,06 | 0,06 | 5,72 | 11,45 | 4,0040 | -0,0128 | |||
| MPC / Marathon Petroleum Corporation | 0,03 | 0,16 | 4,55 | 14,20 | 3,1858 | 0,0668 | |||
| HD / The Home Depot, Inc. | 0,01 | 2,47 | 4,53 | 2,51 | 3,1666 | -0,2871 | |||
| CB / Chubb Limited | 0,01 | -0,21 | 3,96 | -4,26 | 2,7689 | -0,4649 | |||
| CME / CME Group Inc. | 0,01 | 1,19 | 3,78 | 5,14 | 2,6463 | -0,1680 | |||
| ABBV / AbbVie Inc. | 0,02 | 479,25 | 3,12 | 413,84 | 2,1825 | 1,7070 | |||
| DRI / Darden Restaurants, Inc. | 0,01 | 2,07 | 3,08 | 7,09 | 2,1552 | -0,0949 | |||
| JNJ / Johnson & Johnson | 0,02 | -1,39 | 2,80 | -9,18 | 1,9597 | -0,4526 | |||
| JCI / Johnson Controls International plc | 0,02 | 0,29 | 2,53 | 32,22 | 1,7720 | 0,2737 | |||
| APD / Air Products and Chemicals, Inc. | 0,01 | 0,26 | 2,51 | -4,13 | 1,7561 | -0,2914 | |||
| ADI / Analog Devices, Inc. | 0,01 | -2,34 | 2,47 | 15,27 | 1,7273 | 0,0519 | |||
| O / Realty Income Corporation | 0,04 | -2,24 | 2,44 | -2,91 | 1,7047 | -0,2584 | |||
| MDT / Medtronic plc | 0,03 | 0,31 | 2,26 | -2,67 | 1,5788 | -0,2352 | |||
| VZ / Verizon Communications Inc. | 0,05 | -0,47 | 2,04 | -5,02 | 1,4289 | -0,2537 | |||
| FIS / Fidelity National Information Services, Inc. | 0,02 | 0,22 | 1,94 | 9,25 | 1,3558 | -0,0317 | |||
| NVDA / NVIDIA Corporation | 0,01 | 3,32 | 1,86 | 50,69 | 1,3044 | 0,3360 | |||
| CMI / Cummins Inc. | 0,01 | 1,22 | 1,77 | 5,73 | 1,2395 | -0,0709 | |||
| CMCSA / Comcast Corporation | 0,05 | -1,14 | 1,74 | -4,39 | 1,2209 | -0,2067 | |||
| PEG / Public Service Enterprise Group Incorporated | 0,02 | 2,26 | 1,69 | 4,64 | 1,1841 | -0,0816 | |||
| UNH / UnitedHealth Group Incorporated | 0,01 | -8,36 | 1,61 | -45,40 | 1,1253 | -1,1793 | |||
| UNP / Union Pacific Corporation | 0,01 | -2,24 | 1,59 | -4,80 | 1,1116 | -0,1938 | |||
| META / Meta Platforms, Inc. | 0,00 | 8,24 | 1,48 | 38,60 | 1,0382 | 0,2008 | |||
| AMZN / Amazon.com, Inc. | 0,01 | -2,78 | 1,34 | 12,10 | 0,9398 | 0,0025 | |||
| XOM / Exxon Mobil Corporation | 0,01 | 0,45 | 1,21 | -9,00 | 0,8498 | -0,1938 | |||
| V / Visa Inc. | 0,00 | 1,52 | 1,19 | 2,77 | 0,8319 | -0,0726 | |||
| BBY / Best Buy Co., Inc. | 0,02 | -4,44 | 1,17 | -12,85 | 0,8211 | -0,2324 | |||
| NEE / NextEra Energy, Inc. | 0,02 | 0,12 | 1,17 | -1,93 | 0,8160 | -0,1146 | |||
| TT / Trane Technologies plc | 0,00 | 4,07 | 1,12 | 35,23 | 0,7817 | 0,1350 | |||
| GOOGL / Alphabet Inc. | 0,01 | 3,04 | 1,03 | 17,50 | 0,7235 | 0,0345 | |||
| TJX / The TJX Companies, Inc. | 0,01 | 19,39 | 0,81 | 21,01 | 0,5687 | 0,0434 | |||
| TXN / Texas Instruments Incorporated | 0,00 | 11,91 | 0,78 | 29,26 | 0,5474 | 0,0741 | |||
| PG / The Procter & Gamble Company | 0,00 | 2,86 | 0,70 | -3,85 | 0,4895 | -0,0796 | |||
| AMD / Advanced Micro Devices, Inc. | 0,00 | 4,71 | 0,58 | 44,61 | 0,4040 | 0,0917 | |||
| TSLA / Tesla, Inc. | 0,00 | 2,61 | 0,57 | 25,88 | 0,4019 | 0,0446 | |||
| CRM / Salesforce, Inc. | 0,00 | -20,92 | 0,55 | -19,71 | 0,3853 | -0,1508 | |||
| IBM / International Business Machines Corporation | 0,00 | 0,93 | 0,51 | 19,63 | 0,3585 | 0,0235 | |||
| VOO / Vanguard Index Funds - Vanguard S&P 500 ETF | 0,00 | -1,83 | 0,46 | 8,55 | 0,3201 | -0,0094 | |||
| GS / The Goldman Sachs Group, Inc. | 0,00 | -7,04 | 0,45 | 20,43 | 0,3140 | 0,0225 | |||
| SPGI / S&P Global Inc. | 0,00 | 3,93 | 0,45 | 7,99 | 0,3122 | -0,0113 | |||
| MCD / McDonald's Corporation | 0,00 | 1,22 | 0,41 | -5,30 | 0,2879 | -0,0521 | |||
| MS / Morgan Stanley | 0,00 | 10,30 | 0,41 | 33,33 | 0,2859 | 0,0459 | |||
| NXPI / NXP Semiconductors N.V. | 0,00 | 4,55 | 0,40 | 20,06 | 0,2810 | 0,0196 | |||
| FI / Fiserv, Inc. | 0,00 | -0,99 | 0,40 | -22,76 | 0,2784 | -0,1243 | |||
| CVX / Chevron Corporation | 0,00 | 20,74 | 0,40 | 3,40 | 0,2765 | -0,0226 | |||
| IUSV / iShares Trust - iShares Core S&P U.S. Value ETF | 0,00 | 14,68 | 0,39 | 17,58 | 0,2720 | 0,0134 | |||
| ORI / Old Republic International Corporation | 0,01 | 9,35 | 0,38 | 7,26 | 0,2690 | -0,0116 | |||
| UL / Unilever PLC - Depositary Receipt (Common Stock) | 0,01 | 8,19 | 0,37 | 11,34 | 0,2611 | -0,0016 | |||
| RTX / RTX Corporation | 0,00 | 41,71 | 0,37 | 56,60 | 0,2576 | 0,0732 | |||
| WMB / The Williams Companies, Inc. | 0,01 | 11,82 | 0,37 | 17,63 | 0,2570 | 0,0125 | |||
| KO / The Coca-Cola Company | 0,01 | 56,05 | 0,36 | 54,24 | 0,2549 | 0,0700 | |||
| FANG / Diamondback Energy, Inc. | 0,00 | 33,20 | 0,36 | 14,51 | 0,2546 | 0,0060 | |||
| PNR / Pentair plc | 0,00 | 11,87 | 0,35 | 31,58 | 0,2450 | 0,0364 | |||
| PAYX / Paychex, Inc. | 0,00 | 8,25 | 0,34 | 2,11 | 0,2377 | -0,0227 | |||
| ARES / Ares Management Corporation | 0,00 | 0,46 | 0,34 | 18,66 | 0,2361 | 0,0137 | |||
| ALL / The Allstate Corporation | 0,00 | 4,66 | 0,33 | 1,83 | 0,2340 | -0,0232 | |||
| HLI / Houlihan Lokey, Inc. | 0,00 | 0,71 | 0,33 | 12,50 | 0,2331 | 0,0008 | |||
| COP / ConocoPhillips | 0,00 | -3,08 | 0,32 | -17,28 | 0,2216 | -0,0775 | |||
| CMG / Chipotle Mexican Grill, Inc. | 0,01 | 2,20 | 0,32 | 14,55 | 0,2205 | 0,0048 | |||
| AXP / American Express Company | 0,00 | -12,89 | 0,31 | 3,38 | 0,2143 | -0,0177 | |||
| WSO / Watsco, Inc. | 0,00 | 8,15 | 0,30 | -6,17 | 0,2132 | -0,0405 | |||
| DUK / Duke Energy Corporation | 0,00 | 16,16 | 0,30 | 12,59 | 0,2131 | 0,0011 | |||
| RJF / Raymond James Financial, Inc. | 0,00 | -6,80 | 0,30 | 2,74 | 0,2104 | -0,0182 | |||
| STE / STERIS plc | 0,00 | 5,30 | 0,30 | 11,52 | 0,2102 | -0,0004 | |||
| CAT / Caterpillar Inc. | 0,00 | -7,84 | 0,29 | 8,18 | 0,2042 | -0,0064 | |||
| LAMR / Lamar Advertising Company | 0,00 | 6,30 | 0,29 | 13,49 | 0,2007 | 0,0028 | |||
| IQV / IQVIA Holdings Inc. | 0,00 | 2,83 | 0,29 | -8,06 | 0,2000 | -0,0433 | |||
| SNA / Snap-on Incorporated | 0,00 | 9,10 | 0,28 | 0,71 | 0,1984 | -0,0218 | |||
| TECH / Bio-Techne Corporation | 0,01 | 43,06 | 0,28 | 25,91 | 0,1941 | 0,0212 | |||
| SO / The Southern Company | 0,00 | 1,69 | 0,28 | 1,47 | 0,1938 | -0,0196 | |||
| FROG / JFrog Ltd. | 0,01 | 0,27 | 0,1912 | 0,1912 | |||||
| MDLZ / Mondelez International, Inc. | 0,00 | 0,27 | 0,1898 | 0,1898 | |||||
| GEV / GE Vernova Inc. | 0,00 | 0,27 | 0,1877 | 0,1877 | |||||
| MANH / Manhattan Associates, Inc. | 0,00 | 0,27 | 0,1864 | 0,1864 | |||||
| KDP / Keurig Dr Pepper Inc. | 0,01 | 9,18 | 0,26 | 5,69 | 0,1819 | -0,0109 | |||
| DXCM / DexCom, Inc. | 0,00 | 0,25 | 0,1755 | 0,1755 | |||||
| BFAM / Bright Horizons Family Solutions Inc. | 0,00 | -0,35 | 0,24 | -2,80 | 0,1701 | -0,0261 | |||
| AMGN / Amgen Inc. | 0,00 | 0,24 | 0,1690 | 0,1690 | |||||
| BIL / SPDR Series Trust - SPDR Bloomberg 1-3 Month T-Bill ETF | 0,00 | -14,95 | 0,24 | -15,25 | 0,1679 | -0,0528 | |||
| SPG / Simon Property Group, Inc. | 0,00 | 9,27 | 0,24 | 5,78 | 0,1670 | -0,0095 | |||
| LECO / Lincoln Electric Holdings, Inc. | 0,00 | 0,17 | 0,24 | 9,72 | 0,1664 | -0,0031 | |||
| COST / Costco Wholesale Corporation | 0,00 | 0,42 | 0,24 | 4,89 | 0,1655 | -0,0105 | |||
| RBC / RBC Bearings Incorporated | 0,00 | -6,69 | 0,24 | 11,85 | 0,1653 | -0,0003 | |||
| EXR / Extra Space Storage Inc. | 0,00 | 9,65 | 0,23 | 8,84 | 0,1641 | -0,0044 | |||
| CTRA / Coterra Energy Inc. | 0,01 | -2,99 | 0,23 | -14,76 | 0,1619 | -0,0506 | |||
| WSM / Williams-Sonoma, Inc. | 0,00 | 0,23 | 0,1612 | 0,1612 | |||||
| SIGI / Selective Insurance Group, Inc. | 0,00 | 0,12 | 0,23 | -5,46 | 0,1579 | -0,0284 | |||
| GOLF / Acushnet Holdings Corp. | 0,00 | 0,68 | 0,23 | 6,64 | 0,1577 | -0,0074 | |||
| EXLS / ExlService Holdings, Inc. | 0,01 | 0,32 | 0,22 | -7,17 | 0,1545 | -0,0311 | |||
| BAC / Bank of America Corporation | 0,00 | 0,22 | 0,1540 | 0,1540 | |||||
| SSD / Simpson Manufacturing Co., Inc. | 0,00 | 0,21 | 0,1502 | 0,1502 | |||||
| MA / Mastercard Incorporated | 0,00 | 0,21 | 0,1478 | 0,1478 | |||||
| GMED / Globus Medical, Inc. | 0,00 | 0,28 | 0,21 | -19,23 | 0,1471 | -0,0563 | |||
| RFG / Invesco Exchange-Traded Fund Trust - Invesco S&P MidCap 400 Pure Growth ETF | 0,00 | 0,21 | 0,1450 | 0,1450 | |||||
| RGA / Reinsurance Group of America, Incorporated | 0,00 | -31,96 | 0,21 | -31,56 | 0,1445 | -0,0912 | |||
| CRAI / CRA International, Inc. | 0,00 | 0,21 | 0,1443 | 0,1443 | |||||
| NFLX / Netflix, Inc. | 0,00 | 0,21 | 0,1443 | 0,1443 | |||||
| GOOG / Alphabet Inc. | 0,00 | -11,23 | 0,20 | 1,00 | 0,1423 | -0,0155 | |||
| EW / Edwards Lifesciences Corporation | 0,00 | 0,20 | 0,1417 | 0,1417 | |||||
| HON / Honeywell International Inc. | 0,00 | 0,20 | 0,1411 | 0,1411 | |||||
| NFJ / Virtus Dividend, Interest & Premium Strategy Fund | 0,01 | 2,11 | 0,14 | 4,51 | 0,0975 | -0,0069 | |||
| NMRK / Newmark Group, Inc. | 0,01 | 0,06 | 0,13 | 0,00 | 0,0889 | -0,0106 | |||
| LHX / L3Harris Technologies, Inc. | 0,00 | -100,00 | 0,00 | 0,0000 | |||||
| MRK / Merck & Co., Inc. | 0,00 | -100,00 | 0,00 | 0,0000 | |||||
| ACN / Accenture plc | 0,00 | -100,00 | 0,00 | 0,0000 | |||||
| CNS / Cohen & Steers, Inc. | 0,00 | -100,00 | 0,00 | 0,0000 |