Statistiques de base
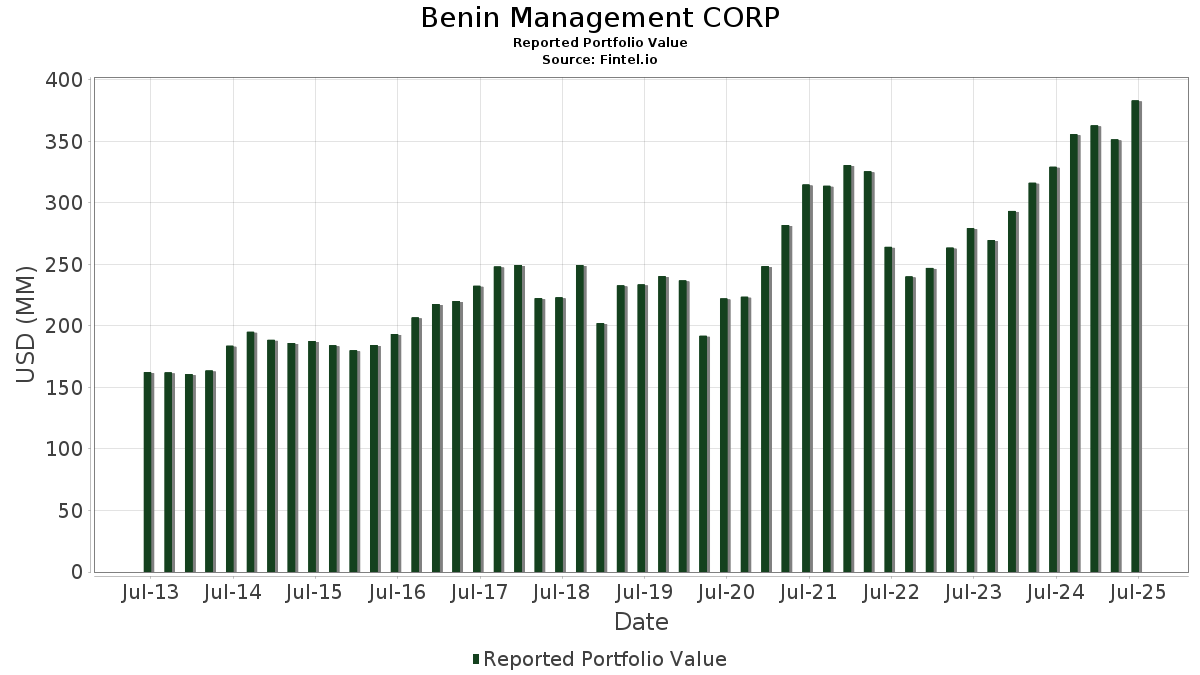
| Valeur du portefeuille | $ 383 059 667 |
| Positions actuelles | 131 |
Dernières positions, performances, ASG (à partir des dépôts 13F, 13D)
Benin Management CORP a déclaré un total de 131 positions dans ses derniers dépôts auprès de la SEC. La valeur la plus récente du portefeuille est calculée à 383 059 667 USD. Les actifs sous gestion réels (ASG) sont cette valeur plus les liquidités (qui ne sont pas divulguées). Les principales positions de Benin Management CORP sont SPDR S&P 500 ETF (US:SPY) , Microsoft Corporation (US:MSFT) , Apple Inc. (US:AAPL) , Visa Inc. (US:V) , and Invesco QQQ Trust, Series 1 (US:QQQ) . Les nouvelles positions de Benin Management CORP incluent Robinhood Markets, Inc. (US:HOOD) , Howmet Aerospace Inc. (US:HWM) , Winchester Bancorp, Inc. (US:WSBK) , .
Meilleures augmentations ce trimestre
Nous utilisons la variation de l'allocation du portefeuille car il s'agit de l'indicateur le plus significatif. Les changements peuvent être dus à des transactions ou à des variations de prix des actions.
| Titre | Actions (en millions) |
Valeur ($ en millions) |
% du portefeuille | ΔPortefeuille % |
|---|---|---|---|---|
| 0,07 | 33,38 | 8,7140 | 1,6276 | |
| 0,20 | 126,58 | 33,0449 | 0,9684 | |
| 0,03 | 5,40 | 1,4103 | 0,4406 | |
| 0,03 | 14,10 | 3,6810 | 0,2645 | |
| 0,02 | 5,45 | 1,4230 | 0,1971 | |
| 0,01 | 2,31 | 0,6030 | 0,1827 | |
| 0,00 | 1,31 | 0,3418 | 0,1553 | |
| 0,02 | 1,92 | 0,5005 | 0,1381 | |
| 0,03 | 3,20 | 0,8367 | 0,1370 | |
| 0,00 | 3,10 | 0,8098 | 0,1188 |
Principales baisses ce trimestre
Nous utilisons la variation de l'allocation du portefeuille car il s'agit de l'indicateur le plus significatif. Les changements peuvent être dus à des transactions ou à des variations de prix des actions.
| Titre | Actions (en millions) |
Valeur ($ en millions) |
% du portefeuille | ΔPortefeuille % |
|---|---|---|---|---|
| 0,13 | 26,97 | 7,0416 | -1,1564 | |
| 0,06 | 8,06 | 2,1029 | -0,5141 | |
| 0,05 | 16,77 | 4,3783 | -0,4053 | |
| 0,03 | 6,28 | 1,6386 | -0,2807 | |
| 0,00 | 2,20 | 0,5754 | -0,2790 | |
| 0,04 | 4,51 | 1,1763 | -0,1996 | |
| 0,02 | 3,68 | 0,9612 | -0,1625 | |
| 0,03 | 11,95 | 3,1207 | -0,1447 | |
| 0,01 | 5,26 | 1,3723 | -0,1376 | |
| 0,03 | 3,32 | 0,8664 | -0,1327 |
Déclarations 13F et dépôts de fonds
Ce formulaire a été déposé le 2025-07-30 pour la période de déclaration 2025-06-30. Cliquez sur l'icône du lien pour voir l'historique complet des transactions.
Mettre à niveau pour débloquer les données premium et exporter vers Excel ![]() .
.
| Titre | Type | Prix moyen de l'action | Actions (en millions) |
ΔActions (%) |
ΔActions (%) |
Valeur ($ en millions) |
Portefeuille (%) |
ΔPortefeuille (%) |
|
|---|---|---|---|---|---|---|---|---|---|
| SPY / SPDR S&P 500 ETF | 0,20 | 1,67 | 126,58 | 12,30 | 33,0449 | 0,9684 | |||
| MSFT / Microsoft Corporation | 0,07 | 1,16 | 33,38 | 34,05 | 8,7140 | 1,6276 | |||
| AAPL / Apple Inc. | 0,13 | 1,37 | 26,97 | -6,37 | 7,0416 | -1,1564 | |||
| V / Visa Inc. | 0,05 | -1,52 | 16,77 | -0,23 | 4,3783 | -0,4053 | |||
| QQQ / Invesco QQQ Trust, Series 1 | 0,03 | -0,16 | 14,10 | 17,45 | 3,6810 | 0,2645 | |||
| DIA / SPDR Dow Jones Industrial Average ETF Trust | 0,03 | -0,73 | 11,95 | 4,17 | 3,1207 | -0,1447 | |||
| PEP / PepsiCo, Inc. | 0,06 | -0,53 | 8,06 | -12,41 | 2,1029 | -0,5141 | |||
| ALL / The Allstate Corporation | 0,03 | -4,27 | 6,28 | -6,94 | 1,6386 | -0,2807 | |||
| AMZN / Amazon.com, Inc. | 0,03 | -5,38 | 6,18 | 9,11 | 1,6128 | 0,0015 | |||
| GOOG / Alphabet Inc. | 0,03 | 1,20 | 5,83 | 14,92 | 1,5220 | 0,0781 | |||
| PNC / The PNC Financial Services Group, Inc. | 0,03 | -0,26 | 5,45 | 5,78 | 1,4240 | -0,0434 | |||
| JPM / JPMorgan Chase & Co. | 0,02 | 7,06 | 5,45 | 26,53 | 1,4230 | 0,1971 | |||
| NVDA / NVIDIA Corporation | 0,03 | 8,75 | 5,40 | 58,56 | 1,4103 | 0,4406 | |||
| COST / Costco Wholesale Corporation | 0,01 | -5,35 | 5,26 | -0,92 | 1,3723 | -0,1376 | |||
| XOM / Exxon Mobil Corporation | 0,04 | 2,82 | 4,51 | -6,79 | 1,1763 | -0,1996 | |||
| FDX / FedEx Corporation | 0,02 | 0,00 | 3,68 | -6,76 | 0,9612 | -0,1625 | |||
| UPS / United Parcel Service, Inc. | 0,03 | 3,01 | 3,32 | -5,47 | 0,8664 | -0,1327 | |||
| CVX / Chevron Corporation | 0,02 | 10,68 | 3,30 | -5,29 | 0,8610 | -0,1297 | |||
| DIS / The Walt Disney Company | 0,03 | 3,75 | 3,20 | 30,35 | 0,8367 | 0,1370 | |||
| META / Meta Platforms, Inc. | 0,00 | -0,24 | 3,10 | 27,76 | 0,8098 | 0,1188 | |||
| ASML / ASML Holding N.V. - Depositary Receipt (Common Stock) | 0,00 | 0,03 | 2,91 | 20,99 | 0,7584 | 0,0750 | |||
| ORCL / Oracle Corporation | 0,01 | 0,00 | 2,31 | 56,33 | 0,6030 | 0,1827 | |||
| CSCO / Cisco Systems, Inc. | 0,03 | -13,41 | 2,30 | -2,66 | 0,6011 | -0,0720 | |||
| JNJ / Johnson & Johnson | 0,01 | 0,00 | 2,25 | -7,89 | 0,5883 | -0,1079 | |||
| BRK.B / Berkshire Hathaway Inc. | 0,00 | -19,51 | 2,20 | -26,58 | 0,5754 | -0,2790 | |||
| GJR / Strats Trust For Procter & Gambel Security - Preferred Security | 0,01 | 0,00 | 2,12 | -6,53 | 0,5528 | -0,0918 | |||
| GLD / SPDR Gold Trust | 0,01 | 11,91 | 2,03 | 18,40 | 0,5293 | 0,0420 | |||
| TRV / The Travelers Companies, Inc. | 0,01 | -0,44 | 2,01 | 0,70 | 0,5241 | -0,0432 | |||
| PRU / Prudential Financial, Inc. | 0,02 | 3,12 | 1,98 | -0,80 | 0,5166 | -0,0510 | |||
| APH / Amphenol Corporation | 0,02 | 0,00 | 1,92 | 50,59 | 0,5005 | 0,1381 | |||
| WMT / Walmart Inc. | 0,02 | -2,30 | 1,86 | 8,81 | 0,4869 | -0,0009 | |||
| SYY / Sysco Corporation | 0,02 | -3,93 | 1,85 | -3,04 | 0,4837 | -0,0601 | |||
| IVV / iShares Trust - iShares Core S&P 500 ETF | 0,00 | 0,00 | 1,79 | 10,54 | 0,4684 | 0,0063 | |||
| PHG / Koninklijke Philips N.V. - Depositary Receipt (Common Stock) | 0,07 | 4,23 | 1,58 | -1,62 | 0,4129 | -0,0445 | |||
| IBM / International Business Machines Corporation | 0,01 | 0,00 | 1,55 | 18,61 | 0,4045 | 0,0325 | |||
| SBUX / Starbucks Corporation | 0,02 | 0,00 | 1,52 | -6,58 | 0,3965 | -0,0662 | |||
| MDT / Medtronic plc | 0,02 | -1,87 | 1,38 | -4,78 | 0,3590 | -0,0521 | |||
| GE / General Electric Company | 0,01 | -0,23 | 1,34 | 28,37 | 0,3485 | 0,0524 | |||
| GEV / GE Vernova Inc. | 0,00 | 15,28 | 1,31 | 99,85 | 0,3418 | 0,1553 | |||
| CAT / Caterpillar Inc. | 0,00 | 0,00 | 1,23 | 17,74 | 0,3208 | 0,0237 | |||
| VTI / Vanguard Index Funds - Vanguard Total Stock Market ETF | 0,00 | 2,30 | 1,22 | 13,12 | 0,3177 | 0,0116 | |||
| STT / State Street Corporation | 0,01 | 0,67 | 1,16 | 19,57 | 0,3031 | 0,0268 | |||
| MCO / Moody's Corporation | 0,00 | 0,00 | 1,15 | 7,71 | 0,2989 | -0,0036 | |||
| LOW / Lowe's Companies, Inc. | 0,01 | -3,79 | 1,13 | -8,46 | 0,2940 | -0,0562 | |||
| GOOGL / Alphabet Inc. | 0,01 | 0,00 | 1,12 | 14,01 | 0,2912 | 0,0127 | |||
| SLB / Schlumberger Limited | 0,03 | -0,16 | 1,05 | -19,31 | 0,2751 | -0,0964 | |||
| AVGO / Broadcom Inc. | 0,00 | 14,30 | 1,01 | 88,29 | 0,2645 | 0,1113 | |||
| ABT / Abbott Laboratories | 0,01 | -22,58 | 0,94 | -20,63 | 0,2452 | -0,0916 | |||
| HPE / Hewlett Packard Enterprise Company | 0,05 | 7,43 | 0,93 | 42,38 | 0,2440 | 0,0572 | |||
| MSCI / MSCI Inc. | 0,00 | 0,00 | 0,92 | 1,99 | 0,2406 | -0,0166 | |||
| HSY / The Hershey Company | 0,01 | 0,93 | 0,90 | -2,08 | 0,2341 | -0,0265 | |||
| TXN / Texas Instruments Incorporated | 0,00 | 0,00 | 0,89 | 15,54 | 0,2331 | 0,0132 | |||
| AXP / American Express Company | 0,00 | -28,01 | 0,88 | -14,63 | 0,2301 | -0,0638 | |||
| SHW / The Sherwin-Williams Company | 0,00 | -2,85 | 0,88 | -4,47 | 0,2288 | -0,0323 | |||
| MCD / McDonald's Corporation | 0,00 | 0,00 | 0,87 | -6,47 | 0,2264 | -0,0375 | |||
| VRSK / Verisk Analytics, Inc. | 0,00 | 0,00 | 0,84 | 4,62 | 0,2189 | -0,0091 | |||
| CME / CME Group Inc. | 0,00 | 0,00 | 0,81 | 3,98 | 0,2115 | -0,0104 | |||
| SO / The Southern Company | 0,01 | 1,19 | 0,78 | 1,04 | 0,2034 | -0,0160 | |||
| ZTS / Zoetis Inc. | 0,00 | 1,98 | 0,76 | -3,41 | 0,1995 | -0,0257 | |||
| LIN / Linde plc | 0,00 | 6,06 | 0,73 | 6,73 | 0,1908 | -0,0038 | |||
| CSX / CSX Corporation | 0,02 | 0,00 | 0,73 | 10,79 | 0,1905 | 0,0032 | |||
| RTX / RTX Corporation | 0,00 | 0,00 | 0,72 | 10,23 | 0,1885 | 0,0021 | |||
| NOBL / ProShares Trust - ProShares S&P 500 Dividend Aristocrats ETF | 0,01 | 0,00 | 0,71 | -1,52 | 0,1866 | -0,0198 | |||
| BAC / Bank of America Corporation | 0,02 | 29,83 | 0,71 | 47,52 | 0,1864 | 0,0484 | |||
| NTRS / Northern Trust Corporation | 0,01 | -34,99 | 0,70 | -16,43 | 0,1820 | -0,0555 | |||
| TROW / T. Rowe Price Group, Inc. | 0,01 | 2,14 | 0,69 | 7,30 | 0,1806 | -0,0029 | |||
| T / AT&T Inc. | 0,02 | 1,72 | 0,68 | 4,15 | 0,1768 | -0,0084 | |||
| NEE / NextEra Energy, Inc. | 0,01 | 13,74 | 0,63 | 11,46 | 0,1651 | 0,0035 | |||
| BK / The Bank of New York Mellon Corporation | 0,01 | -4,66 | 0,63 | 3,62 | 0,1645 | -0,0086 | |||
| RGEN / Repligen Corporation | 0,01 | 0,00 | 0,62 | -2,36 | 0,1624 | -0,0187 | |||
| NFLX / Netflix, Inc. | 0,00 | 0,00 | 0,62 | 43,72 | 0,1615 | 0,0389 | |||
| PM / Philip Morris International Inc. | 0,00 | -4,28 | 0,61 | 9,91 | 0,1594 | 0,0012 | |||
| HD / The Home Depot, Inc. | 0,00 | 1,96 | 0,61 | 2,01 | 0,1590 | -0,0109 | |||
| LLY / Eli Lilly and Company | 0,00 | 0,00 | 0,60 | -5,62 | 0,1577 | -0,0244 | |||
| VUG / Vanguard Index Funds - Vanguard Growth ETF | 0,00 | 0,00 | 0,60 | 18,22 | 0,1561 | 0,0122 | |||
| PLTR / Palantir Technologies Inc. | 0,00 | -1,14 | 0,59 | 59,57 | 0,1548 | 0,0491 | |||
| CVS / CVS Health Corporation | 0,01 | -36,19 | 0,59 | -35,03 | 0,1536 | -0,1041 | |||
| CDW / CDW Corporation | 0,00 | 0,00 | 0,58 | 11,54 | 0,1514 | 0,0033 | |||
| PFE / Pfizer Inc. | 0,02 | 0,87 | 0,57 | -3,37 | 0,1499 | -0,0194 | |||
| PH / Parker-Hannifin Corporation | 0,00 | 0,00 | 0,54 | 14,93 | 0,1409 | 0,0072 | |||
| GS / The Goldman Sachs Group, Inc. | 0,00 | 75,00 | 0,51 | 127,48 | 0,1319 | 0,0685 | |||
| MA / Mastercard Incorporated | 0,00 | -0,57 | 0,49 | 2,07 | 0,1288 | -0,0089 | |||
| FITB / Fifth Third Bancorp | 0,01 | 0,00 | 0,48 | 5,05 | 0,1248 | -0,0049 | |||
| WEX / WEX Inc. | 0,00 | 0,00 | 0,45 | -6,50 | 0,1166 | -0,0193 | |||
| CRM / Salesforce, Inc. | 0,00 | 0,44 | 0,1158 | 0,1158 | |||||
| CMCSA / Comcast Corporation | 0,01 | 0,53 | 0,44 | -2,66 | 0,1147 | -0,0139 | |||
| PFG / Principal Financial Group, Inc. | 0,01 | 0,00 | 0,41 | -5,71 | 0,1078 | -0,0170 | |||
| TSLA / Tesla, Inc. | 0,00 | -2,16 | 0,40 | 19,94 | 0,1052 | 0,0096 | |||
| AMGN / Amgen Inc. | 0,00 | 25,75 | 0,40 | 12,86 | 0,1032 | 0,0034 | |||
| IBIT / iShares Bitcoin Trust ETF | 0,01 | 0,00 | 0,38 | 30,90 | 0,0986 | 0,0164 | |||
| EW / Edwards Lifesciences Corporation | 0,00 | 0,00 | 0,37 | 7,80 | 0,0975 | -0,0010 | |||
| BMY / Bristol-Myers Squibb Company | 0,01 | 0,00 | 0,37 | -24,03 | 0,0974 | -0,0425 | |||
| MRK / Merck & Co., Inc. | 0,00 | 0,00 | 0,36 | -11,79 | 0,0937 | -0,0221 | |||
| INTU / Intuit Inc. | 0,00 | -0,88 | 0,35 | 26,98 | 0,0923 | 0,0132 | |||
| F / Ford Motor Company | 0,03 | -5,88 | 0,35 | 1,76 | 0,0907 | -0,0064 | |||
| FMDE / Fidelity Covington Trust - Fidelity Enhanced Mid Cap ETF | 0,01 | 0,00 | 0,35 | 9,87 | 0,0901 | 0,0007 | |||
| VOO / Vanguard Index Funds - Vanguard S&P 500 ETF | 0,00 | 0,00 | 0,34 | 10,39 | 0,0890 | 0,0012 | |||
| APD / Air Products and Chemicals, Inc. | 0,00 | 0,00 | 0,33 | -4,09 | 0,0856 | -0,0120 | |||
| UNH / UnitedHealth Group Incorporated | 0,00 | -15,82 | 0,33 | -50,00 | 0,0854 | -0,1002 | |||
| SLV / iShares Silver Trust | 0,01 | 0,00 | 0,32 | 5,88 | 0,0848 | -0,0025 | |||
| HON / Honeywell International Inc. | 0,00 | 0,00 | 0,32 | 10,03 | 0,0831 | 0,0007 | |||
| YUM / Yum! Brands, Inc. | 0,00 | 0,32 | 0,0824 | 0,0824 | |||||
| TMO / Thermo Fisher Scientific Inc. | 0,00 | -20,51 | 0,31 | -35,26 | 0,0820 | -0,0560 | |||
| VZ / Verizon Communications Inc. | 0,01 | 2,68 | 0,31 | -2,19 | 0,0817 | -0,0092 | |||
| COF / Capital One Financial Corporation | 0,00 | 0,00 | 0,29 | 18,55 | 0,0769 | 0,0063 | |||
| SCHW / The Charles Schwab Corporation | 0,00 | -29,53 | 0,28 | -17,73 | 0,0739 | -0,0242 | |||
| HOOD / Robinhood Markets, Inc. | 0,00 | 0,28 | 0,0733 | 0,0733 | |||||
| AGG / iShares Trust - iShares Core U.S. Aggregate Bond ETF | 0,00 | 0,00 | 0,28 | 0,00 | 0,0723 | -0,0063 | |||
| CI / The Cigna Group | 0,00 | 0,00 | 0,27 | 0,76 | 0,0695 | -0,0059 | |||
| KKR / KKR & Co. Inc. | 0,00 | 0,00 | 0,27 | 15,15 | 0,0695 | 0,0037 | |||
| EMR / Emerson Electric Co. | 0,00 | -4,77 | 0,27 | 15,72 | 0,0694 | 0,0041 | |||
| FLR / Fluor Corporation | 0,01 | 0,26 | 0,0676 | 0,0676 | |||||
| KO / The Coca-Cola Company | 0,00 | -2,67 | 0,26 | -3,73 | 0,0674 | -0,0090 | |||
| MKC / McCormick & Company, Incorporated | 0,00 | 0,00 | 0,26 | -7,89 | 0,0673 | -0,0123 | |||
| BX / Blackstone Inc. | 0,00 | 0,00 | 0,25 | 6,84 | 0,0654 | -0,0012 | |||
| HWM / Howmet Aerospace Inc. | 0,00 | 0,25 | 0,0647 | 0,0647 | |||||
| ESRT / Empire State Realty Trust, Inc. | 0,03 | 9,16 | 0,24 | 13,15 | 0,0629 | 0,0022 | |||
| OXY / Occidental Petroleum Corporation | 0,01 | -5,21 | 0,23 | -19,37 | 0,0598 | -0,0210 | |||
| UNP / Union Pacific Corporation | 0,00 | 0,00 | 0,23 | -2,60 | 0,0587 | -0,0070 | |||
| DHR / Danaher Corporation | 0,00 | 0,00 | 0,22 | -3,45 | 0,0586 | -0,0077 | |||
| DUK / Duke Energy Corporation | 0,00 | 0,00 | 0,22 | -3,08 | 0,0575 | -0,0073 | |||
| ABBV / AbbVie Inc. | 0,00 | -1,90 | 0,22 | -13,04 | 0,0575 | -0,0146 | |||
| WBS / Webster Financial Corporation | 0,00 | -4,76 | 0,22 | 0,93 | 0,0570 | -0,0046 | |||
| INTC / Intel Corporation | 0,01 | 0,29 | 0,21 | -0,93 | 0,0555 | -0,0057 | |||
| FCX / Freeport-McMoRan Inc. | 0,00 | 0,21 | 0,0554 | 0,0554 | |||||
| MO / Altria Group, Inc. | 0,00 | -4,00 | 0,21 | -6,22 | 0,0551 | -0,0090 | |||
| IWF / iShares Trust - iShares Russell 1000 Growth ETF | 0,00 | -19,97 | 0,20 | -6,05 | 0,0529 | -0,0084 | |||
| SOTK / Sono-Tek Corporation | 0,05 | 0,00 | 0,18 | 3,45 | 0,0470 | -0,0027 | |||
| WSBK / Winchester Bancorp, Inc. | 0,01 | 0,09 | 0,0245 | 0,0245 | |||||
| DNUT / Krispy Kreme, Inc. | 0,02 | 3,94 | 0,06 | -38,38 | 0,0160 | -0,0124 | |||
| HITI / High Tide Inc. | 0,02 | 0,00 | 0,05 | 24,32 | 0,0120 | 0,0013 | |||
| SRBK / SR Bancorp, Inc. | 0,00 | -100,00 | 0,00 | 0,0000 | |||||
| HL / Hecla Mining Company | 0,00 | -100,00 | 0,00 | 0,0000 | |||||
| GPK / Graphic Packaging Holding Company | 0,00 | -100,00 | 0,00 | 0,0000 |