Statistiques de base
| Valeur du portefeuille | $ 154 334 599 |
| Positions actuelles | 86 |
Dernières positions, performances, ASG (à partir des dépôts 13F, 13D)
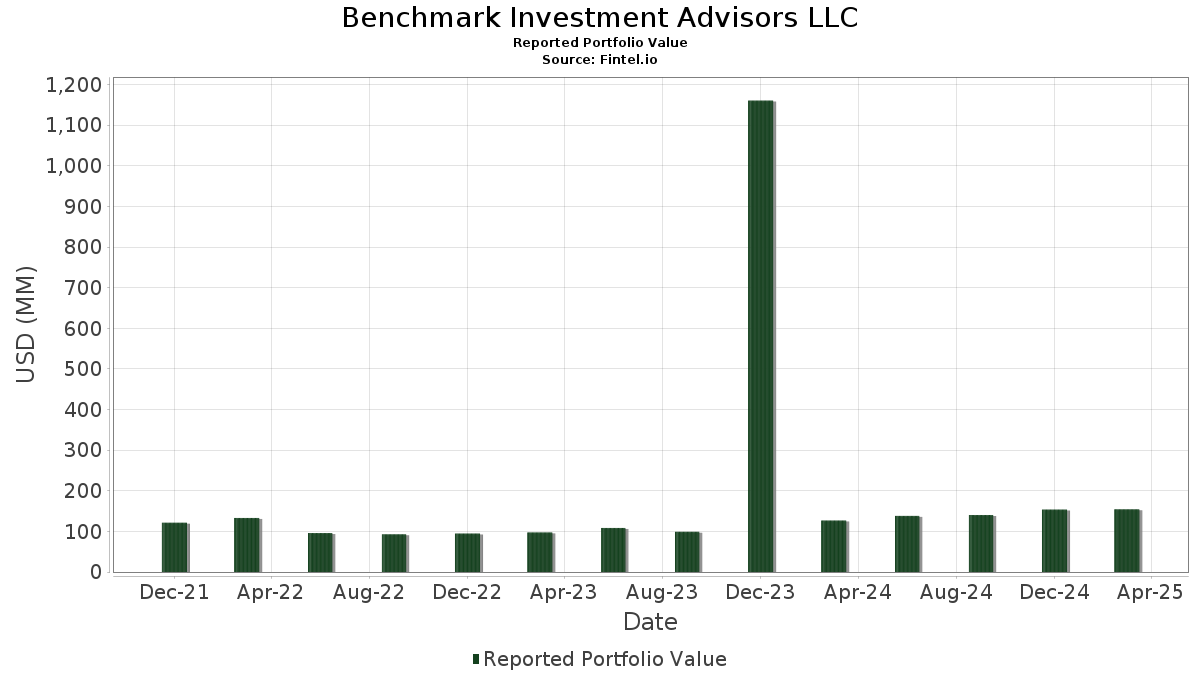
Benchmark Investment Advisors LLC a déclaré un total de 86 positions dans ses derniers dépôts auprès de la SEC. La valeur la plus récente du portefeuille est calculée à 154 334 599 USD. Les actifs sous gestion réels (ASG) sont cette valeur plus les liquidités (qui ne sont pas divulguées). Les principales positions de Benchmark Investment Advisors LLC sont NVIDIA Corporation (US:NVDA) , Meta Platforms, Inc. (US:META) , Microsoft Corporation (US:MSFT) , AppLovin Corporation (US:APP) , and Broadcom Inc. (US:AVGO) . Les nouvelles positions de Benchmark Investment Advisors LLC incluent CyberArk Software Ltd. (US:CYBR) , .
Meilleures augmentations ce trimestre
Nous utilisons la variation de l'allocation du portefeuille car il s'agit de l'indicateur le plus significatif. Les changements peuvent être dus à des transactions ou à des variations de prix des actions.
| Titre | Actions (en millions) |
Valeur ($ en millions) |
% du portefeuille | ΔPortefeuille % |
|---|---|---|---|---|
| 0,01 | 3,61 | 2,3412 | 1,1453 | |
| 0,03 | 2,21 | 1,4341 | 1,1229 | |
| 0,01 | 5,96 | 3,8589 | 1,0623 | |
| 0,01 | 4,27 | 2,7680 | 1,0139 | |
| 0,01 | 1,74 | 1,1273 | 0,8325 | |
| 0,00 | 1,39 | 0,9007 | 0,7091 | |
| 0,00 | 1,06 | 0,6893 | 0,6893 | |
| 0,00 | 1,03 | 0,6653 | 0,6653 | |
| 0,00 | 1,54 | 1,0009 | 0,6636 | |
| 0,02 | 4,74 | 3,0741 | 0,5741 |
Principales baisses ce trimestre
Nous utilisons la variation de l'allocation du portefeuille car il s'agit de l'indicateur le plus significatif. Les changements peuvent être dus à des transactions ou à des variations de prix des actions.
| Titre | Actions (en millions) |
Valeur ($ en millions) |
% du portefeuille | ΔPortefeuille % |
|---|---|---|---|---|
| 0,23 | 24,59 | 15,9348 | -4,9691 | |
| 0,00 | 2,95 | 1,9092 | -0,9687 | |
| 0,02 | 3,73 | 2,4166 | -0,9100 | |
| 0,02 | 5,64 | 3,6563 | -0,5830 | |
| 0,00 | 0,59 | 0,3818 | -0,5803 | |
| 0,04 | 2,86 | 1,8555 | -0,4060 | |
| 0,01 | 0,69 | 0,4440 | -0,3906 | |
| 0,00 | 1,06 | 0,6897 | -0,3733 | |
| 0,03 | 5,39 | 3,4946 | -0,3205 | |
| 0,00 | 2,36 | 1,5294 | -0,2990 |
Déclarations 13F et dépôts de fonds
Ce formulaire a été déposé le 2025-05-15 pour la période de déclaration 2025-03-31. Cliquez sur l'icône du lien pour voir l'historique complet des transactions.
Mettre à niveau pour débloquer les données premium et exporter vers Excel ![]() .
.
| Titre | Type | Prix moyen de l'action | Actions (en millions) |
ΔActions (%) |
ΔActions (%) |
Valeur ($ en millions) |
Portefeuille (%) |
ΔPortefeuille (%) |
|
|---|---|---|---|---|---|---|---|---|---|
| NVDA / NVIDIA Corporation | 0,23 | -5,14 | 24,59 | -23,44 | 15,9348 | -4,9691 | |||
| META / Meta Platforms, Inc. | 0,01 | 40,78 | 5,96 | 38,59 | 3,8589 | 1,0623 | |||
| MSFT / Microsoft Corporation | 0,02 | -2,74 | 5,64 | -13,37 | 3,6563 | -0,5830 | |||
| APP / AppLovin Corporation | 0,02 | 23,55 | 5,57 | 1,09 | 3,6087 | 0,0236 | |||
| AVGO / Broadcom Inc. | 0,03 | 27,38 | 5,39 | -8,00 | 3,4946 | -0,3205 | |||
| AMZN / Amazon.com, Inc. | 0,02 | 42,40 | 4,74 | 23,51 | 3,0741 | 0,5741 | |||
| GOOGL / Alphabet Inc. | 0,03 | 19,63 | 4,58 | -2,28 | 2,9686 | -0,0821 | |||
| V / Visa Inc. | 0,01 | 42,92 | 4,27 | 58,52 | 2,7680 | 1,0139 | |||
| URI / United Rentals, Inc. | 0,01 | 13,70 | 4,03 | 1,16 | 2,6092 | 0,0187 | |||
| PANW / Palo Alto Networks, Inc. | 0,02 | 32,07 | 3,84 | 23,83 | 2,4885 | 0,4705 | |||
| AAPL / Apple Inc. | 0,02 | -17,75 | 3,73 | -27,05 | 2,4166 | -0,9100 | |||
| CRWD / CrowdStrike Holdings, Inc. | 0,01 | 90,80 | 3,61 | 96,68 | 2,3412 | 1,1453 | |||
| TSM / Taiwan Semiconductor Manufacturing Company Limited - Depositary Receipt (Common Stock) | 0,02 | 3,88 | 3,05 | -12,68 | 1,9765 | -0,2969 | |||
| MA / Mastercard Incorporated | 0,01 | 2,13 | 3,00 | 6,31 | 1,9442 | 0,1077 | |||
| XPRO / Expro Group Holdings N.V. | 0,01 | 13,20 | 2,97 | 21,69 | 1,9271 | 0,3366 | |||
| FTXP / Foothills Exploration, Inc. | 0,00 | -38,24 | 2,95 | -33,38 | 1,9092 | -0,9687 | |||
| ANET / Arista Networks Inc | 0,04 | 62,51 | 2,89 | 13,94 | 1,8747 | 0,2220 | |||
| UBER / Uber Technologies, Inc. | 0,04 | -31,78 | 2,86 | -17,61 | 1,8555 | -0,4060 | |||
| JPM / JPMorgan Chase & Co. | 0,01 | 34,76 | 2,40 | 37,92 | 1,5582 | 0,4235 | |||
| EME / EMCOR Group, Inc. | 0,01 | 27,05 | 2,39 | 3,47 | 1,5457 | 0,0451 | |||
| ROP / Roper Technologies, Inc. | 0,00 | -25,92 | 2,36 | -15,98 | 1,5294 | -0,2990 | |||
| VRT / Vertiv Holdings Co | 0,03 | 628,30 | 2,21 | 362,97 | 1,4341 | 1,1229 | |||
| PH / Parker-Hannifin Corporation | 0,00 | -6,97 | 1,90 | -11,11 | 1,2295 | -0,1595 | |||
| AMAT / Applied Materials, Inc. | 0,01 | 7,88 | 1,80 | -3,69 | 1,1657 | -0,0505 | |||
| FIX / Comfort Systems USA, Inc. | 0,01 | 405,43 | 1,74 | 283,89 | 1,1273 | 0,8325 | |||
| CPRT / Copart, Inc. | 0,03 | 13,14 | 1,72 | 11,58 | 1,1113 | 0,1109 | |||
| NFLX / Netflix, Inc. | 0,00 | 29,99 | 1,69 | 35,99 | 1,0949 | 0,2863 | |||
| GWW / W.W. Grainger, Inc. | 0,00 | 14,47 | 1,60 | 7,23 | 1,0379 | 0,0663 | |||
| BKNG / Booking Holdings Inc. | 0,00 | 4,27 | 1,58 | -3,25 | 1,0213 | -0,0390 | |||
| AZO / AutoZone, Inc. | 0,00 | 7,55 | 1,57 | 28,07 | 1,0203 | 0,2202 | |||
| SPOT / Spotify Technology S.A. | 0,00 | 142,36 | 1,54 | 198,07 | 1,0009 | 0,6636 | |||
| NOW / ServiceNow, Inc. | 0,00 | 61,44 | 1,53 | 21,28 | 0,9935 | 0,1705 | |||
| SPGI / S&P Global Inc. | 0,00 | 362,94 | 1,39 | 372,79 | 0,9007 | 0,7091 | |||
| BRO / Brown & Brown, Inc. | 0,01 | -35,63 | 1,32 | -21,52 | 0,8582 | -0,2399 | |||
| DVYE / iShares, Inc. - iShares Emerging Markets Dividend ETF | 0,05 | 5,57 | 1,29 | 11,47 | 0,8383 | 0,0835 | |||
| VOO / Vanguard Index Funds - Vanguard S&P 500 ETF | 0,00 | 0,37 | 1,25 | -4,27 | 0,8128 | -0,0401 | |||
| SNPS / Synopsys, Inc. | 0,00 | -4,91 | 1,19 | -15,98 | 0,7703 | -0,1504 | |||
| MRK / Merck & Co., Inc. | 0,01 | -5,06 | 1,18 | -14,35 | 0,7621 | -0,1314 | |||
| CRM / Salesforce, Inc. | 0,00 | 259,38 | 1,08 | 188,77 | 0,6999 | 0,4563 | |||
| UNH / UnitedHealth Group Incorporated | 0,00 | -37,07 | 1,06 | -34,84 | 0,6897 | -0,3733 | |||
| CYBR / CyberArk Software Ltd. | 0,00 | 1,06 | 0,6893 | 0,6893 | |||||
| TTWO / Take-Two Interactive Software, Inc. | 0,00 | 1,03 | 0,6653 | 0,6653 | |||||
| VGSN.X / Vanguard Specialized Funds - Vanguard Real Estate ETF | 0,01 | -5,14 | 0,98 | -3,64 | 0,6350 | -0,0264 | |||
| GE / General Electric Company | 0,00 | 0,00 | 0,95 | 19,92 | 0,6168 | 0,1006 | |||
| CDW / CDW Corporation | 0,01 | 0,02 | 0,93 | -7,93 | 0,6026 | -0,0545 | |||
| KRE / SPDR Series Trust - SPDR S&P Regional Banking ETF | 0,02 | -1,07 | 0,91 | -6,88 | 0,5883 | -0,0457 | |||
| HD / The Home Depot, Inc. | 0,00 | -10,95 | 0,86 | -16,09 | 0,5544 | -0,1091 | |||
| IVE / iShares Trust - iShares S&P 500 Value ETF | 0,00 | -3,99 | 0,78 | -4,04 | 0,5080 | -0,0241 | |||
| ELV / Elevance Health, Inc. | 0,00 | -24,47 | 0,78 | -11,02 | 0,5028 | -0,0641 | |||
| WELL / Welltower Inc. | 0,01 | 0,00 | 0,78 | 21,66 | 0,5023 | 0,0873 | |||
| RSP / Invesco Exchange-Traded Fund Trust - Invesco S&P 500 Equal Weight ETF | 0,00 | -0,23 | 0,75 | -1,32 | 0,4861 | -0,0088 | |||
| JPC / Nuveen Preferred & Income Opportunities Fund | 0,09 | 0,00 | 0,70 | 1,30 | 0,4539 | 0,0038 | |||
| LRCX / Lam Research Corporation | 0,01 | -46,91 | 0,69 | -46,57 | 0,4440 | -0,3906 | |||
| BRK.A / Berkshire Hathaway Inc. | 0,00 | 0,00 | 0,68 | 17,47 | 0,4403 | 0,0640 | |||
| IWM / iShares Trust - iShares Russell 2000 ETF | 0,00 | -30,79 | 0,67 | -37,59 | 0,4373 | -0,2656 | |||
| INDA / iShares Trust - iShares MSCI India ETF | 0,01 | -7,25 | 0,66 | -9,37 | 0,4270 | -0,0458 | |||
| OXY / Occidental Petroleum Corporation | 0,01 | -4,62 | 0,61 | -4,67 | 0,3966 | -0,0214 | |||
| MCK / McKesson Corporation | 0,00 | -24,19 | 0,60 | -10,43 | 0,3896 | -0,0472 | |||
| GOOG / Alphabet Inc. | 0,00 | -51,42 | 0,59 | -60,15 | 0,3818 | -0,5803 | |||
| NTNX / Nutanix, Inc. | 0,01 | 34,64 | 0,58 | 53,83 | 0,3778 | 0,1308 | |||
| FCX / Freeport-McMoRan Inc. | 0,02 | -6,10 | 0,58 | -6,57 | 0,3778 | -0,0286 | |||
| PUT 100 INVESCO QQQ TR UNIT SER 1 EXP 06-20-25 @474.78 / PUT (99QA4017W) | 0,00 | 0,58 | 0,0000 | ||||||
| HSY / The Hershey Company | 0,00 | 0,51 | 0,3325 | 0,3325 | |||||
| ASML / ASML Holding N.V. - Depositary Receipt (Common Stock) | 0,00 | -28,75 | 0,45 | -31,97 | 0,2916 | -0,1383 | |||
| IAU / iShares Gold Trust | 0,01 | -2,52 | 0,43 | 16,09 | 0,2810 | 0,0379 | |||
| CDNS / Cadence Design Systems, Inc. | 0,00 | -12,11 | 0,42 | -25,61 | 0,2752 | -0,0963 | |||
| O / Realty Income Corporation | 0,01 | 0,00 | 0,42 | 8,53 | 0,2727 | 0,0205 | |||
| JNJ / Johnson & Johnson | 0,00 | -10,48 | 0,40 | 2,59 | 0,2571 | 0,0056 | |||
| ADI / Analog Devices, Inc. | 0,00 | -9,04 | 0,40 | -13,76 | 0,2563 | -0,0418 | |||
| ACN / Accenture plc | 0,00 | 22,30 | 0,39 | 8,38 | 0,2518 | 0,0187 | |||
| NHI / National Health Investors, Inc. | 0,01 | 0,00 | 0,37 | 6,65 | 0,2393 | 0,0138 | |||
| GEV / GE Vernova Inc. | 0,00 | 0,00 | 0,36 | -7,18 | 0,2350 | -0,0193 | |||
| NKE / NIKE, Inc. | 0,01 | 0,36 | 0,2344 | 0,2344 | |||||
| VIG / Vanguard Specialized Funds - Vanguard Dividend Appreciation ETF | 0,00 | 0,11 | 0,35 | -0,85 | 0,2259 | -0,0028 | |||
| LTC / LTC Properties, Inc. | 0,01 | 0,00 | 0,32 | 2,59 | 0,2060 | 0,0044 | |||
| FTNT / Fortinet, Inc. | 0,00 | -0,61 | 0,31 | 1,30 | 0,2018 | 0,0016 | |||
| PFF / iShares Trust - iShares Preferred and Income Securities ETF | 0,01 | -7,77 | 0,31 | -9,71 | 0,1990 | -0,0227 | |||
| CSCO / Cisco Systems, Inc. | 0,00 | -7,01 | 0,30 | -2,94 | 0,1925 | -0,0070 | |||
| ADBE / Adobe Inc. | 0,00 | -48,59 | 0,28 | -55,70 | 0,1817 | -0,2298 | |||
| TMO / Thermo Fisher Scientific Inc. | 0,00 | -11,26 | 0,27 | -15,36 | 0,1753 | -0,0324 | |||
| VRTX / Vertex Pharmaceuticals Incorporated | 0,00 | -95,52 | 0,27 | -94,68 | 0,1747 | -0,2610 | |||
| IWB / iShares Trust - iShares Russell 1000 ETF | 0,00 | 0,00 | 0,26 | -4,80 | 0,1673 | -0,0092 | |||
| ISRG / Intuitive Surgical, Inc. | 0,00 | 3,18 | 0,26 | -1,91 | 0,1666 | -0,0044 | |||
| SYK / Stryker Corporation | 0,00 | 0,00 | 0,23 | 3,17 | 0,1482 | 0,0044 | |||
| XLV / The Select Sector SPDR Trust - The Health Care Select Sector SPDR Fund | 0,00 | -15,66 | 0,21 | -10,46 | 0,1391 | -0,0170 | |||
| LLY / Eli Lilly and Company | 0,00 | 0,21 | 0,1333 | 0,1333 | |||||
| ORCL / Oracle Corporation | 0,00 | -100,00 | 0,00 | 0,0000 | |||||
| RELX / RELX PLC - Depositary Receipt (Common Stock) | 0,00 | -100,00 | 0,00 | 0,0000 | |||||
| CCFLU / CCF Holdings LLC | 0,00 | -100,00 | 0,00 | 0,0000 | |||||
| SRPT / Sarepta Therapeutics, Inc. | 0,00 | -100,00 | 0,00 | 0,0000 | |||||
| XLE / The Select Sector SPDR Trust - The Energy Select Sector SPDR Fund | 0,00 | -100,00 | 0,00 | 0,0000 | |||||
| EA / Electronic Arts Inc. | 0,00 | -100,00 | 0,00 | 0,0000 | |||||
| QQQ / Invesco QQQ Trust, Series 1 | 0,00 | -100,00 | 0,00 | 0,0000 |