Statistiques de base
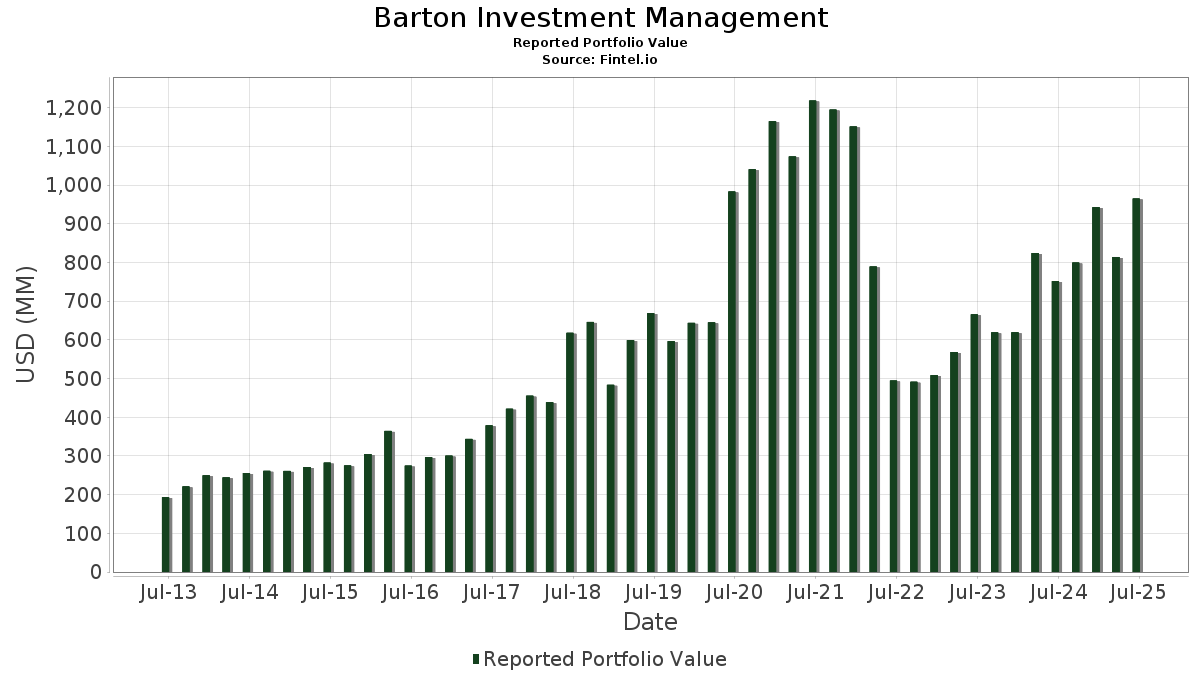
| Valeur du portefeuille | $ 965 132 770 |
| Positions actuelles | 48 |
Dernières positions, performances, ASG (à partir des dépôts 13F, 13D)
Barton Investment Management a déclaré un total de 48 positions dans ses derniers dépôts auprès de la SEC. La valeur la plus récente du portefeuille est calculée à 965 132 770 USD. Les actifs sous gestion réels (ASG) sont cette valeur plus les liquidités (qui ne sont pas divulguées). Les principales positions de Barton Investment Management sont Netflix, Inc. (US:NFLX) , Shopify Inc. (US:SHOP) , Amazon.com, Inc. (US:AMZN) , Blue Owl Capital Inc. (US:OWL) , and Global-E Online Ltd. (US:GLBE) .
Meilleures augmentations ce trimestre
Nous utilisons la variation de l'allocation du portefeuille car il s'agit de l'indicateur le plus significatif. Les changements peuvent être dus à des transactions ou à des variations de prix des actions.
| Titre | Actions (en millions) |
Valeur ($ en millions) |
% du portefeuille | ΔPortefeuille % |
|---|---|---|---|---|
| 0,25 | 328,87 | 34,0755 | 5,4914 | |
| 1,72 | 198,21 | 20,5374 | 0,2659 | |
| 0,03 | 12,82 | 1,3284 | 0,1398 | |
| 0,56 | 25,45 | 2,6370 | 0,1010 | |
| 0,01 | 1,44 | 0,1492 | 0,0361 | |
| 0,00 | 0,30 | 0,0306 | 0,0306 | |
| 0,00 | 0,29 | 0,0297 | 0,0297 | |
| 0,01 | 1,48 | 0,1532 | 0,0185 | |
| 0,00 | 0,62 | 0,0642 | 0,0120 | |
| 0,01 | 0,78 | 0,0808 | 0,0046 |
Principales baisses ce trimestre
Nous utilisons la variation de l'allocation du portefeuille car il s'agit de l'indicateur le plus significatif. Les changements peuvent être dus à des transactions ou à des variations de prix des actions.
| Titre | Actions (en millions) |
Valeur ($ en millions) |
% du portefeuille | ΔPortefeuille % |
|---|---|---|---|---|
| 1,91 | 36,63 | 3,7952 | -0,8988 | |
| 1,08 | 36,20 | 3,7510 | -0,7892 | |
| 0,25 | 25,20 | 2,6109 | -0,7322 | |
| 0,04 | 29,96 | 3,1041 | -0,6646 | |
| 0,52 | 113,30 | 11,7396 | -0,4111 | |
| 0,08 | 18,26 | 1,8923 | -0,3921 | |
| 0,60 | 34,80 | 3,6060 | -0,3606 | |
| 0,17 | 9,85 | 1,0209 | -0,3055 | |
| 0,42 | 21,18 | 2,1942 | -0,2856 | |
| 0,00 | 7,29 | 0,7551 | -0,2257 |
Déclarations 13F et dépôts de fonds
Ce formulaire a été déposé le 2025-07-21 pour la période de déclaration 2025-06-30. Cliquez sur l'icône du lien pour voir l'historique complet des transactions.
Mettre à niveau pour débloquer les données premium et exporter vers Excel ![]() .
.
| Titre | Type | Prix moyen de l'action | Actions (en millions) |
ΔActions (%) |
ΔActions (%) |
Valeur ($ en millions) |
Portefeuille (%) |
ΔPortefeuille (%) |
|
|---|---|---|---|---|---|---|---|---|---|
| NFLX / Netflix, Inc. | 0,25 | -1,58 | 328,87 | 41,33 | 34,0755 | 5,4914 | |||
| SHOP / Shopify Inc. | 1,72 | -0,58 | 198,21 | 20,11 | 20,5374 | 0,2659 | |||
| AMZN / Amazon.com, Inc. | 0,52 | -0,66 | 113,30 | 14,54 | 11,7396 | -0,4111 | |||
| OWL / Blue Owl Capital Inc. | 1,91 | -0,00 | 36,63 | -4,15 | 3,7952 | -0,8988 | |||
| GLBE / Global-E Online Ltd. | 1,08 | 4,11 | 36,20 | -2,05 | 3,7510 | -0,7892 | |||
| AL / Air Lease Corporation | 0,60 | -10,98 | 34,80 | 7,78 | 3,6060 | -0,3606 | |||
| EQIX / Equinix, Inc. | 0,04 | 0,09 | 29,96 | -2,35 | 3,1041 | -0,6646 | |||
| GTLB / GitLab Inc. | 0,56 | 28,44 | 25,45 | 23,28 | 2,6370 | 0,1010 | |||
| OKTA / Okta, Inc. | 0,25 | -2,55 | 25,20 | -7,41 | 2,6109 | -0,7322 | |||
| GFL / GFL Environmental Inc. | 0,42 | 0,43 | 21,18 | 4,90 | 2,1942 | -0,2856 | |||
| AMT / American Tower Corporation | 0,08 | -3,31 | 18,26 | -1,79 | 1,8923 | -0,3921 | |||
| MSFT / Microsoft Corporation | 0,03 | 0,00 | 12,82 | 32,51 | 1,3284 | 0,1398 | |||
| BL / BlackLine, Inc. | 0,17 | -21,96 | 9,85 | -8,75 | 1,0209 | -0,3055 | |||
| PYPL / PayPal Holdings, Inc. | 0,13 | -1,17 | 9,76 | 12,57 | 1,0108 | -0,0537 | |||
| EA / Electronic Arts Inc. | 0,05 | -7,01 | 8,01 | 2,74 | 0,8303 | -0,1277 | |||
| QCOM / QUALCOMM Incorporated | 0,05 | -2,75 | 7,55 | 0,84 | 0,7820 | -0,1375 | |||
| BRK.A / Berkshire Hathaway Inc. | 0,00 | 0,00 | 7,29 | -8,72 | 0,7551 | -0,2257 | |||
| AAPL / Apple Inc. | 0,03 | -1,40 | 5,91 | -8,93 | 0,6119 | -0,1847 | |||
| BRK.B / Berkshire Hathaway Inc. | 0,01 | 0,00 | 5,08 | -8,79 | 0,5260 | -0,1577 | |||
| GOOGL / Alphabet Inc. | 0,02 | 0,00 | 3,40 | 13,96 | 0,3528 | -0,0142 | |||
| VTI / Vanguard Index Funds - Vanguard Total Stock Market ETF | 0,01 | -5,68 | 3,36 | 4,32 | 0,3480 | -0,0475 | |||
| JNJ / Johnson & Johnson | 0,01 | 0,00 | 2,28 | -7,91 | 0,2365 | -0,0679 | |||
| GOOG / Alphabet Inc. | 0,01 | -1,76 | 1,89 | 11,53 | 0,1955 | -0,0123 | |||
| ABBV / AbbVie Inc. | 0,01 | 0,00 | 1,78 | -11,42 | 0,1849 | -0,0625 | |||
| VGSH / Vanguard Scottsdale Funds - Vanguard Short-Term Treasury ETF | 0,03 | 9,91 | 1,61 | 10,05 | 0,1668 | -0,0128 | |||
| TROW / T. Rowe Price Group, Inc. | 0,02 | -4,25 | 1,59 | 0,57 | 0,1644 | -0,0294 | |||
| DASH / DoorDash, Inc. | 0,01 | 0,00 | 1,48 | 34,95 | 0,1532 | 0,0185 | |||
| ORCL / Oracle Corporation | 0,01 | 0,00 | 1,44 | 56,41 | 0,1492 | 0,0361 | |||
| XOM / Exxon Mobil Corporation | 0,01 | 0,00 | 1,35 | -9,38 | 0,1402 | -0,0432 | |||
| ABT / Abbott Laboratories | 0,01 | 0,00 | 1,35 | 2,52 | 0,1394 | -0,0218 | |||
| ADBE / Adobe Inc. | 0,00 | 0,00 | 1,24 | 0,90 | 0,1283 | -0,0225 | |||
| COST / Costco Wholesale Corporation | 0,00 | 0,00 | 1,01 | 4,65 | 0,1050 | -0,0139 | |||
| DIS / The Walt Disney Company | 0,01 | 0,00 | 0,78 | 25,65 | 0,0808 | 0,0046 | |||
| BILL / BILL Holdings, Inc. | 0,01 | 6,17 | 0,68 | 7,08 | 0,0706 | -0,0076 | |||
| MRK / Merck & Co., Inc. | 0,01 | 0,00 | 0,65 | -11,89 | 0,0669 | -0,0230 | |||
| NVDA / NVIDIA Corporation | 0,00 | 0,00 | 0,62 | 45,99 | 0,0642 | 0,0120 | |||
| META / Meta Platforms, Inc. | 0,00 | 0,00 | 0,56 | 28,18 | 0,0585 | 0,0043 | |||
| AXP / American Express Company | 0,00 | 0,00 | 0,55 | 18,67 | 0,0573 | 0,0000 | |||
| SPY / SPDR S&P 500 ETF | 0,00 | 0,00 | 0,52 | 10,45 | 0,0537 | -0,0039 | |||
| ADP / Automatic Data Processing, Inc. | 0,00 | 0,00 | 0,43 | 0,94 | 0,0447 | -0,0078 | |||
| CI / The Cigna Group | 0,00 | 0,00 | 0,36 | 0,56 | 0,0370 | -0,0067 | |||
| CSCO / Cisco Systems, Inc. | 0,00 | 0,00 | 0,30 | 12,17 | 0,0307 | -0,0017 | |||
| VRT / Vertiv Holdings Co | 0,00 | 0,30 | 0,0306 | 0,0306 | |||||
| AVGO / Broadcom Inc. | 0,00 | 0,29 | 0,0297 | 0,0297 | |||||
| NTRS / Northern Trust Corporation | 0,00 | 0,00 | 0,29 | 28,96 | 0,0296 | 0,0023 | |||
| WMT / Walmart Inc. | 0,00 | 0,00 | 0,25 | 11,26 | 0,0257 | -0,0017 | |||
| PFE / Pfizer Inc. | 0,01 | 0,18 | 0,24 | -4,45 | 0,0245 | -0,0058 | |||
| VTV / Vanguard Index Funds - Vanguard Value ETF | 0,00 | 0,00 | 0,22 | 2,35 | 0,0226 | -0,0036 |