Statistiques de base
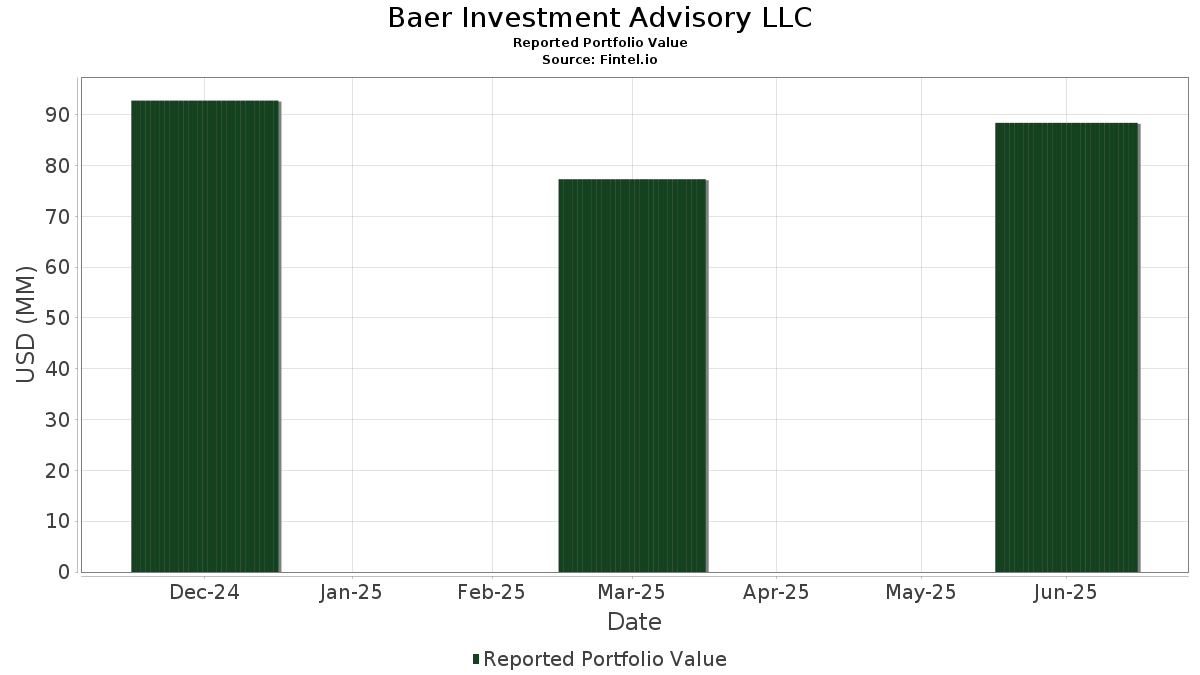
| Valeur du portefeuille | $ 87 945 168 |
| Positions actuelles | 40 |
Dernières positions, performances, ASG (à partir des dépôts 13F, 13D)
Baer Investment Advisory LLC a déclaré un total de 40 positions dans ses derniers dépôts auprès de la SEC. La valeur la plus récente du portefeuille est calculée à 87 945 168 USD. Les actifs sous gestion réels (ASG) sont cette valeur plus les liquidités (qui ne sont pas divulguées). Les principales positions de Baer Investment Advisory LLC sont NVIDIA Corporation (US:NVDA) , Amazon.com, Inc. (US:AMZN) , Amphenol Corporation (US:APH) , Microsoft Corporation (US:MSFT) , and Veeva Systems Inc. (US:VEEV) . Les nouvelles positions de Baer Investment Advisory LLC incluent NVIDIA Corporation (US:NVDA) , Microsoft Corporation (US:MSFT) , Taiwan Semiconductor Manufacturing Company Limited - Depositary Receipt (Common Stock) (US:TSM) , Netflix, Inc. (US:NFLX) , and Shopify Inc. (US:SHOP) .
Meilleures augmentations ce trimestre
Nous utilisons la variation de l'allocation du portefeuille car il s'agit de l'indicateur le plus significatif. Les changements peuvent être dus à des transactions ou à des variations de prix des actions.
| Titre | Actions (en millions) |
Valeur ($ en millions) |
% du portefeuille | ΔPortefeuille % |
|---|---|---|---|---|
| 0,00 | 7,21 | 8,2003 | 8,2003 | |
| 0,00 | 4,00 | 4,5454 | 4,5454 | |
| 0,00 | 3,76 | 4,2789 | 4,2789 | |
| 0,00 | 3,29 | 3,7433 | 3,7433 | |
| 0,00 | 1,67 | 1,9013 | 1,9013 | |
| 0,00 | 1,59 | 1,8125 | 1,8125 | |
| 0,03 | 2,07 | 2,3576 | 1,6265 | |
| 0,00 | 1,21 | 1,3751 | 1,3751 | |
| 0,00 | 1,00 | 1,1323 | 1,1323 | |
| 0,01 | 0,97 | 1,1020 | 1,1020 |
Principales baisses ce trimestre
Nous utilisons la variation de l'allocation du portefeuille car il s'agit de l'indicateur le plus significatif. Les changements peuvent être dus à des transactions ou à des variations de prix des actions.
| Titre | Actions (en millions) |
Valeur ($ en millions) |
% du portefeuille | ΔPortefeuille % |
|---|---|---|---|---|
| 0,02 | 2,38 | 2,7068 | -7,1093 | |
| 0,02 | 0,37 | 0,4208 | -4,0478 | |
| 0,00 | 2,37 | 2,6931 | -2,9593 | |
| 0,00 | 1,82 | 2,0670 | -2,5307 | |
| 0,05 | 3,62 | 4,1131 | -2,2755 | |
| 0,01 | 2,64 | 3,0033 | -1,5692 | |
| 0,00 | 2,48 | 2,8204 | -1,4122 | |
| 0,01 | 3,08 | 3,4970 | -1,3717 | |
| 0,00 | 1,38 | 1,5724 | -1,1575 | |
| 0,00 | 2,13 | 2,4213 | -1,1569 |
Déclarations 13F et dépôts de fonds
Ce formulaire a été déposé le 2025-08-07 pour la période de déclaration 2025-06-30. Cliquez sur l'icône du lien pour voir l'historique complet des transactions.
Mettre à niveau pour débloquer les données premium et exporter vers Excel ![]() .
.
| Titre | Type | Prix moyen de l'action | Actions (en millions) |
ΔActions (%) |
ΔActions (%) |
Valeur ($ en millions) |
Portefeuille (%) |
ΔPortefeuille (%) |
|
|---|---|---|---|---|---|---|---|---|---|
| NVDA / NVIDIA Corporation | Call | 0,00 | 7,21 | 8,2003 | 8,2003 | ||||
| AMZN / Amazon.com, Inc. | 0,03 | -0,17 | 5,29 | -1,56 | 6,0123 | -0,9379 | |||
| APH / Amphenol Corporation | 0,05 | 1,50 | 4,58 | 38,42 | 5,2120 | 0,9270 | |||
| MSFT / Microsoft Corporation | Call | 0,00 | 4,00 | 4,5454 | 4,5454 | ||||
| VEEV / Veeva Systems Inc. | 0,01 | -3,97 | 4,00 | 10,12 | 4,5436 | -0,1507 | |||
| EME / EMCOR Group, Inc. | 0,01 | -1,96 | 3,82 | 22,61 | 4,3476 | 0,3121 | |||
| TSM / Taiwan Semiconductor Manufacturing Company Limited - Depositary Receipt (Common Stock) | Call | 0,00 | 3,76 | 4,2789 | 4,2789 | ||||
| CSGP / CoStar Group, Inc. | 0,05 | -6,46 | 3,62 | -26,74 | 4,1131 | -2,2755 | |||
| INTU / Intuit Inc. | 0,00 | -5,15 | 3,51 | 2,33 | 3,9900 | -0,4480 | |||
| NFLX / Netflix, Inc. | Call | 0,00 | 3,29 | 3,7433 | 3,7433 | ||||
| DE / Deere & Company | 0,01 | -2,10 | 3,16 | -5,11 | 3,5877 | -0,7150 | |||
| CDNS / Cadence Design Systems, Inc. | 0,01 | 9,64 | 3,11 | 3,08 | 3,5348 | -0,3665 | |||
| APD / Air Products and Chemicals, Inc. | 0,01 | -3,23 | 3,08 | -18,26 | 3,4970 | -1,3717 | |||
| ZTS / Zoetis Inc. | 0,02 | 39,14 | 3,05 | 45,59 | 3,4716 | 0,7583 | |||
| AAPL / Apple Inc. | 0,01 | -1,20 | 2,64 | -25,25 | 3,0033 | -1,5692 | |||
| COST / Costco Wholesale Corporation | 0,00 | -3,06 | 2,48 | -24,18 | 2,8204 | -1,4122 | |||
| NVDA / NVIDIA Corporation | 0,02 | -9,02 | 2,38 | -68,63 | 2,7068 | -7,1093 | |||
| NFLX / Netflix, Inc. | 0,00 | -6,00 | 2,37 | -45,79 | 2,6931 | -2,9593 | |||
| URI / United Rentals, Inc. | 0,00 | -3,78 | 2,13 | -23,00 | 2,4213 | -1,1569 | |||
| HD / The Home Depot, Inc. | 0,01 | -1,86 | 2,08 | -2,21 | 2,3614 | -0,3862 | |||
| TTD / The Trade Desk, Inc. | 0,03 | 2 815,88 | 2,07 | 267,55 | 2,3576 | 1,6265 | |||
| EPD / Enterprise Products Partners L.P. - Limited Partnership | 0,06 | 47,42 | 2,01 | 33,71 | 2,2831 | 0,3409 | |||
| MSFT / Microsoft Corporation | 0,00 | -2,24 | 1,82 | -48,86 | 2,0670 | -2,5307 | |||
| SHOP / Shopify Inc. | Call | 0,00 | 1,67 | 1,9013 | 1,9013 | ||||
| TTD / The Trade Desk, Inc. | Call | 0,00 | 1,59 | 1,8125 | 1,8125 | ||||
| TMO / Thermo Fisher Scientific Inc. | 0,00 | -3,46 | 1,38 | -34,47 | 1,5724 | -1,1575 | |||
| ECL / Ecolab Inc. | 0,00 | 1,21 | 1,3751 | 1,3751 | |||||
| URI / United Rentals, Inc. | Call | 0,00 | 1,00 | 1,1323 | 1,1323 | ||||
| TXN / Texas Instruments Incorporated | 0,01 | 0,97 | 1,1020 | 1,1020 | |||||
| INTU / Intuit Inc. | Call | 0,00 | 0,77 | 0,8752 | 0,8752 | ||||
| CSGP / CoStar Group, Inc. | Call | 0,00 | 0,56 | 0,6346 | 0,6346 | ||||
| AMZN / Amazon.com, Inc. | Call | 0,00 | 0,55 | 0,6275 | 0,6275 | ||||
| CDNS / Cadence Design Systems, Inc. | Call | 0,00 | 0,52 | 0,5865 | 0,5865 | ||||
| TMO / Thermo Fisher Scientific Inc. | Call | 0,00 | 0,43 | 0,4941 | 0,4941 | ||||
| AAPL / Apple Inc. | Call | 0,00 | 0,40 | 0,4579 | 0,4579 | ||||
| ADI / Analog Devices, Inc. | 0,02 | -0,79 | 0,37 | -89,28 | 0,4208 | -4,0478 | |||
| DE / Deere & Company | Call | 0,00 | 0,34 | 0,3909 | 0,3909 | ||||
| VEEV / Veeva Systems Inc. | Call | 0,00 | 0,34 | 0,3825 | 0,3825 | ||||
| APD / Air Products and Chemicals, Inc. | Call | 0,00 | 0,31 | 0,3492 | 0,3492 | ||||
| SNAP / Snap Inc. | 0,01 | 0,00 | 0,08 | -7,87 | 0,0932 | -0,0223 |