Statistiques de base
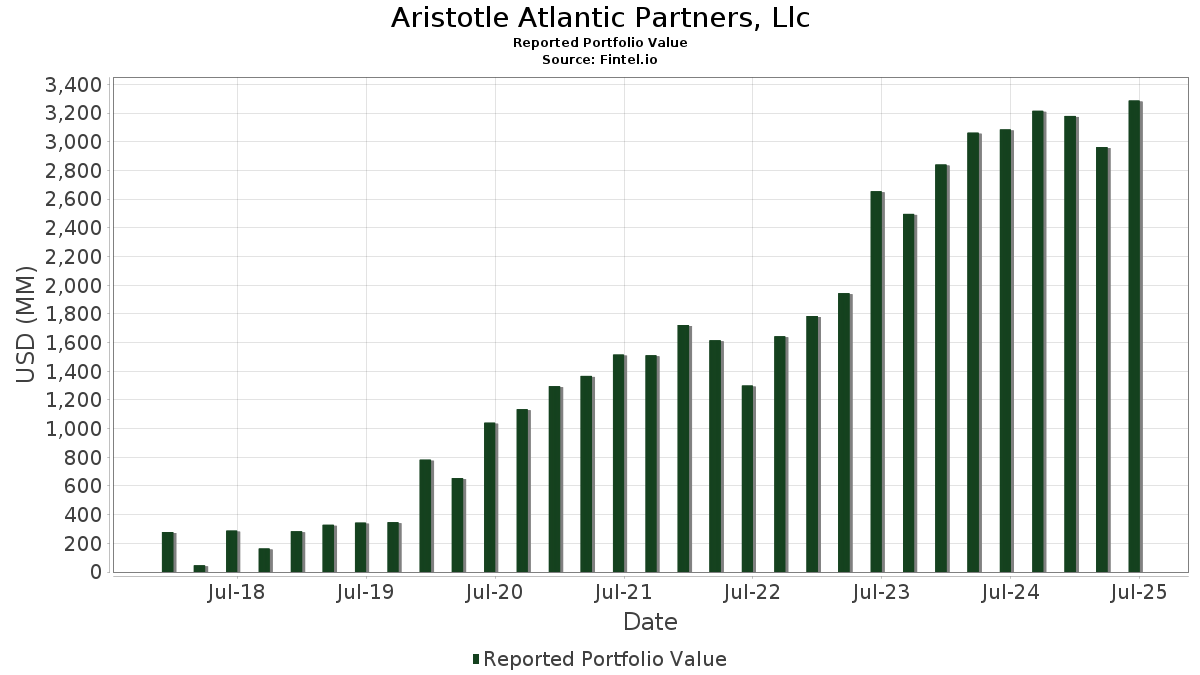
| Valeur du portefeuille | $ 3 287 880 087 |
| Positions actuelles | 85 |
Dernières positions, performances, ASG (à partir des dépôts 13F, 13D)
Aristotle Atlantic Partners, Llc a déclaré un total de 85 positions dans ses derniers dépôts auprès de la SEC. La valeur la plus récente du portefeuille est calculée à 3 287 880 087 USD. Les actifs sous gestion réels (ASG) sont cette valeur plus les liquidités (qui ne sont pas divulguées). Les principales positions de Aristotle Atlantic Partners, Llc sont NVIDIA Corporation (US:NVDA) , Microsoft Corporation (US:MSFT) , Apple Inc. (US:AAPL) , Alphabet Inc. (US:GOOGL) , and Meta Platforms, Inc. (US:META) . Les nouvelles positions de Aristotle Atlantic Partners, Llc incluent HubSpot, Inc. (US:HUBS) , .
Meilleures augmentations ce trimestre
Nous utilisons la variation de l'allocation du portefeuille car il s'agit de l'indicateur le plus significatif. Les changements peuvent être dus à des transactions ou à des variations de prix des actions.
| Titre | Actions (en millions) |
Valeur ($ en millions) |
% du portefeuille | ΔPortefeuille % |
|---|---|---|---|---|
| 0,02 | 11,54 | 0,3510 | 0,3510 | |
| 0,04 | 1,97 | 0,0343 | 0,0087 |
Principales baisses ce trimestre
Nous utilisons la variation de l'allocation du portefeuille car il s'agit de l'indicateur le plus significatif. Les changements peuvent être dus à des transactions ou à des variations de prix des actions.
| Titre | Actions (en millions) |
Valeur ($ en millions) |
% du portefeuille | ΔPortefeuille % |
|---|---|---|---|---|
| 0,95 | 195,20 | 3,4063 | -4,0740 | |
| 0,60 | 299,89 | 5,2330 | -3,0991 | |
| 2,24 | 353,91 | 6,1757 | -2,3798 | |
| 0,34 | 121,23 | 2,1154 | -2,0483 | |
| 0,84 | 148,49 | 2,5912 | -1,9512 | |
| 0,20 | 148,18 | 2,5857 | -1,4172 | |
| 0,45 | 99,57 | 1,7375 | -1,3965 | |
| 0,08 | 79,72 | 1,3912 | -1,2454 | |
| 0,17 | 63,15 | 1,1020 | -1,0085 | |
| 0,29 | 83,05 | 1,4492 | -0,9743 |
Déclarations 13F et dépôts de fonds
Ce formulaire a été déposé le 2025-08-14 pour la période de déclaration 2025-06-30. Cliquez sur l'icône du lien pour voir l'historique complet des transactions.
Mettre à niveau pour débloquer les données premium et exporter vers Excel ![]() .
.
| Titre | Type | Prix moyen de l'action | Actions (en millions) |
ΔActions (%) |
ΔActions (%) |
Valeur ($ en millions) |
Portefeuille (%) |
ΔPortefeuille (%) |
|
|---|---|---|---|---|---|---|---|---|---|
| NVDA / NVIDIA Corporation | 2,24 | -4,24 | 353,91 | 39,59 | 6,1757 | -2,3798 | |||
| MSFT / Microsoft Corporation | 0,60 | -8,34 | 299,89 | 21,45 | 5,2330 | -3,0991 | |||
| AAPL / Apple Inc. | 0,95 | -4,66 | 195,20 | -11,94 | 3,4063 | -4,0740 | |||
| GOOGL / Alphabet Inc. | 0,84 | -3,20 | 148,49 | 10,32 | 2,5912 | -1,9512 | |||
| META / Meta Platforms, Inc. | 0,20 | -2,46 | 148,18 | 24,92 | 2,5857 | -1,4172 | |||
| AVGO / Broadcom Inc. | 0,52 | 2,41 | 144,54 | 68,61 | 2,5222 | -0,3705 | |||
| V / Visa Inc. | 0,34 | -3,02 | 121,23 | -1,75 | 2,1154 | -2,0483 | |||
| AMZN / Amazon.com, Inc. | 0,45 | -7,03 | 99,57 | 7,21 | 1,7375 | -1,3965 | |||
| TT / Trane Technologies plc | 0,22 | -1,85 | 94,07 | 27,43 | 1,6415 | -0,8496 | |||
| NFLX / Netflix, Inc. | 0,07 | -2,53 | 91,36 | 39,98 | 1,5942 | -0,6083 | |||
| JPM / JPMorgan Chase & Co. | 0,29 | -2,16 | 83,05 | 15,64 | 1,4492 | -0,9743 | |||
| COST / Costco Wholesale Corporation | 0,08 | -2,52 | 79,72 | 2,04 | 1,3912 | -1,2454 | |||
| ORCL / Oracle Corporation | 0,32 | 1,88 | 70,54 | 59,32 | 1,2310 | -0,2632 | |||
| HD / The Home Depot, Inc. | 0,17 | 0,93 | 63,15 | 0,98 | 1,1020 | -1,0085 | |||
| TECH / Bio-Techne Corporation | 1,05 | 8,89 | 54,14 | -4,45 | 0,9447 | -0,9672 | |||
| SNPS / Synopsys, Inc. | 0,10 | -2,81 | 51,14 | 16,19 | 0,8923 | -0,5928 | |||
| LLY / Eli Lilly and Company | 0,06 | 44,67 | 48,71 | 36,54 | 0,8500 | -0,3538 | |||
| NSC / Norfolk Southern Corporation | 0,19 | -3,22 | 48,55 | 4,60 | 0,8471 | -0,7190 | |||
| GH / Guardant Health, Inc. | 0,93 | -3,38 | 48,50 | 18,03 | 0,8463 | -0,5402 | |||
| AME / AMETEK, Inc. | 0,24 | -2,82 | 44,27 | 2,16 | 0,7726 | -0,6899 | |||
| SPGI / S&P Global Inc. | 0,08 | -1,39 | 44,11 | 2,34 | 0,7698 | -0,6848 | |||
| DAR / Darling Ingredients Inc. | 1,16 | -3,36 | 44,08 | 17,37 | 0,7693 | -0,4982 | |||
| CRWD / CrowdStrike Holdings, Inc. | 0,08 | -2,70 | 40,45 | 40,56 | 0,7059 | -0,2653 | |||
| MRK / Merck & Co., Inc. | 0,50 | 0,00 | 39,31 | -11,81 | 0,6860 | -0,8182 | |||
| ADI / Analog Devices, Inc. | 0,16 | -3,52 | 38,99 | 13,86 | 0,6803 | -0,4751 | |||
| NOW / ServiceNow, Inc. | 0,04 | -30,42 | 37,95 | -10,15 | 0,6623 | -0,7631 | |||
| CB / Chubb Limited | 0,12 | 26,81 | 34,38 | 21,66 | 0,5999 | -0,3537 | |||
| ICE / Intercontinental Exchange, Inc. | 0,19 | -3,18 | 34,01 | 2,98 | 0,5934 | -0,5210 | |||
| ADPT / Adaptive Biotechnologies Corporation | 2,88 | -2,10 | 33,54 | 53,50 | 0,5853 | -0,1521 | |||
| TMO / Thermo Fisher Scientific Inc. | 0,08 | 15,45 | 30,97 | -5,93 | 0,5404 | -0,5704 | |||
| AMP / Ameriprise Financial, Inc. | 0,06 | -3,17 | 30,75 | 6,75 | 0,5365 | -0,4354 | |||
| ORLY / O'Reilly Automotive, Inc. | 0,34 | 1 324,34 | 30,20 | -10,39 | 0,9186 | -0,2187 | |||
| PLD / Prologis, Inc. | 0,27 | -2,34 | 28,86 | -8,17 | 0,5036 | -0,5569 | |||
| XOM / Exxon Mobil Corporation | 0,25 | 0,00 | 27,11 | -9,36 | 0,4731 | -0,5362 | |||
| KLAC / KLA Corporation | 0,03 | -3,74 | 24,79 | 26,84 | 0,4327 | -0,2270 | |||
| BSX / Boston Scientific Corporation | 0,23 | -3,22 | 24,38 | 3,04 | 0,4254 | -0,3730 | |||
| NEE / NextEra Energy, Inc. | 0,35 | 29,89 | 24,04 | 27,19 | 0,4195 | -0,2183 | |||
| BAC / Bank of America Corporation | 0,49 | -27,94 | 23,12 | -18,29 | 0,4035 | -0,5514 | |||
| MAR / Marriott International, Inc. | 0,08 | -13,53 | 22,89 | -0,82 | 0,3995 | -0,3794 | |||
| UNP / Union Pacific Corporation | 0,09 | -3,60 | 20,93 | -6,12 | 0,3652 | -0,3870 | |||
| VRTX / Vertex Pharmaceuticals Incorporated | 0,05 | -5,44 | 20,20 | -13,17 | 0,3525 | -0,4325 | |||
| PH / Parker-Hannifin Corporation | 0,03 | 0,00 | 19,56 | 14,91 | 0,3413 | -0,2331 | |||
| ROP / Roper Technologies, Inc. | 0,03 | -1,65 | 18,61 | -5,44 | 0,3247 | -0,3394 | |||
| AVY / Avery Dennison Corporation | 0,10 | -3,08 | 17,94 | -4,44 | 0,3131 | -0,3206 | |||
| GTLS / Chart Industries, Inc. | 0,11 | -5,34 | 17,43 | 7,96 | 0,3042 | -0,2407 | |||
| GM / General Motors Company | 0,34 | -3,11 | 16,87 | 1,39 | 0,2944 | -0,2671 | |||
| ADBE / Adobe Inc. | 0,04 | -6,82 | 16,61 | -6,00 | 0,2899 | -0,3065 | |||
| BDX / Becton, Dickinson and Company | 0,09 | -2,99 | 16,33 | -27,05 | 0,2850 | -0,4705 | |||
| LIN / Linde plc | 0,03 | 54,01 | 15,07 | 55,18 | 0,2629 | -0,0647 | |||
| AR / Antero Resources Corporation | 0,36 | 5,06 | 14,46 | 4,65 | 0,2523 | -0,2139 | |||
| CI / The Cigna Group | 0,04 | -3,23 | 14,04 | -2,77 | 0,2450 | -0,2423 | |||
| MUSA / Murphy USA Inc. | 0,03 | -6,79 | 13,97 | -19,29 | 0,2438 | -0,3403 | |||
| UNH / UnitedHealth Group Incorporated | 0,04 | 65,07 | 13,47 | -1,68 | 0,2351 | -0,2273 | |||
| AWK / American Water Works Company, Inc. | 0,10 | 36,71 | 13,38 | 28,92 | 0,2334 | -0,1167 | |||
| UBER / Uber Technologies, Inc. | 0,13 | -5,56 | 12,51 | 20,93 | 0,2184 | -0,1308 | |||
| APH / Amphenol Corporation | 0,12 | -1,63 | 12,15 | 48,10 | 0,2120 | -0,0648 | |||
| HUBS / HubSpot, Inc. | 0,02 | 11,54 | 0,3510 | 0,3510 | |||||
| HON / Honeywell International Inc. | 0,05 | -2,54 | 10,67 | 7,18 | 0,1862 | -0,1498 | |||
| GE / General Electric Company | 0,04 | -2,66 | 10,04 | 25,17 | 0,1752 | -0,0955 | |||
| HAL / Halliburton Company | 0,44 | -2,41 | 9,00 | -21,61 | 0,1571 | -0,2304 | |||
| AMT / American Tower Corporation | 0,04 | 0,00 | 8,84 | 1,56 | 0,1543 | -0,1394 | |||
| AMAT / Applied Materials, Inc. | 0,04 | -1,68 | 7,48 | 24,03 | 0,1305 | -0,0730 | |||
| ARE / Alexandria Real Estate Equities, Inc. | 0,10 | -4,80 | 6,93 | -25,27 | 0,1209 | -0,1920 | |||
| PCH / PotlatchDeltic Corporation | 0,15 | 0,00 | 5,82 | -14,95 | 0,1015 | -0,1294 | |||
| GOOG / Alphabet Inc. | 0,03 | -18,17 | 5,68 | -7,10 | 0,0991 | -0,1072 | |||
| MUR / Murphy Oil Corporation | 0,25 | 0,00 | 5,66 | -20,78 | 0,0987 | -0,1423 | |||
| COO / The Cooper Companies, Inc. | 0,06 | 0,00 | 4,55 | -15,64 | 0,0795 | -0,1027 | |||
| PWR / Quanta Services, Inc. | 0,01 | -18,12 | 4,06 | 21,80 | 0,0708 | -0,0416 | |||
| TEL / TE Connectivity plc | 0,02 | 0,00 | 3,37 | 19,36 | 0,0589 | -0,0365 | |||
| TTWO / Take-Two Interactive Software, Inc. | 0,01 | -17,62 | 3,15 | -3,46 | 0,0550 | -0,0551 | |||
| TSLA / Tesla, Inc. | 0,01 | -18,38 | 2,74 | 0,04 | 0,0832 | -0,0091 | |||
| ABT / Abbott Laboratories | 0,02 | 0,00 | 2,59 | 2,53 | 0,0452 | -0,0401 | |||
| OKLO / Oklo Inc. | 0,04 | 0,00 | 1,97 | 159,16 | 0,0343 | 0,0087 | |||
| PANW / Palo Alto Networks, Inc. | 0,01 | 0,00 | 1,35 | 19,89 | 0,0236 | -0,0144 | |||
| PG / The Procter & Gamble Company | 0,01 | 0,00 | 1,07 | -6,55 | 0,0187 | -0,0200 | |||
| IFF / International Flavors & Fragrances Inc. | 0,01 | -17,65 | 1,00 | -21,93 | 0,0174 | -0,0257 | |||
| KO / The Coca-Cola Company | 0,01 | 0,00 | 0,99 | -1,20 | 0,0173 | -0,0166 | |||
| WEC / WEC Energy Group, Inc. | 0,01 | 0,00 | 0,83 | -4,39 | 0,0144 | -0,0148 | |||
| IBM / International Business Machines Corporation | 0,00 | 0,00 | 0,71 | 18,62 | 0,0123 | -0,0078 | |||
| QCOM / QUALCOMM Incorporated | 0,00 | 0,00 | 0,48 | 3,70 | 0,0083 | -0,0072 | |||
| SPXC / SPX Technologies, Inc. | 0,00 | 0,00 | 0,48 | 30,41 | 0,0083 | -0,0040 | |||
| CRM / Salesforce, Inc. | 0,00 | 0,00 | 0,41 | 1,74 | 0,0071 | -0,0064 | |||
| IDXX / IDEXX Laboratories, Inc. | 0,00 | 0,00 | 0,32 | 27,89 | 0,0056 | -0,0029 | |||
| DOV / Dover Corporation | 0,00 | 0,00 | 0,26 | 4,49 | 0,0045 | -0,0038 | |||
| JNJ / Johnson & Johnson | 0,00 | 0,00 | 0,23 | -7,66 | 0,0040 | -0,0044 | |||
| ERII / Energy Recovery, Inc. | 0,00 | -100,00 | 0,00 | 0,0000 | |||||
| EXPE / Expedia Group, Inc. | 0,00 | -100,00 | 0,00 | 0,0000 | |||||
| ZTS / Zoetis Inc. | 0,00 | -100,00 | 0,00 | 0,0000 | |||||
| BMY / Bristol-Myers Squibb Company | 0,00 | -100,00 | 0,00 | 0,0000 | |||||
| DHR / Danaher Corporation | 0,00 | -100,00 | 0,00 | 0,0000 |