Statistiques de base
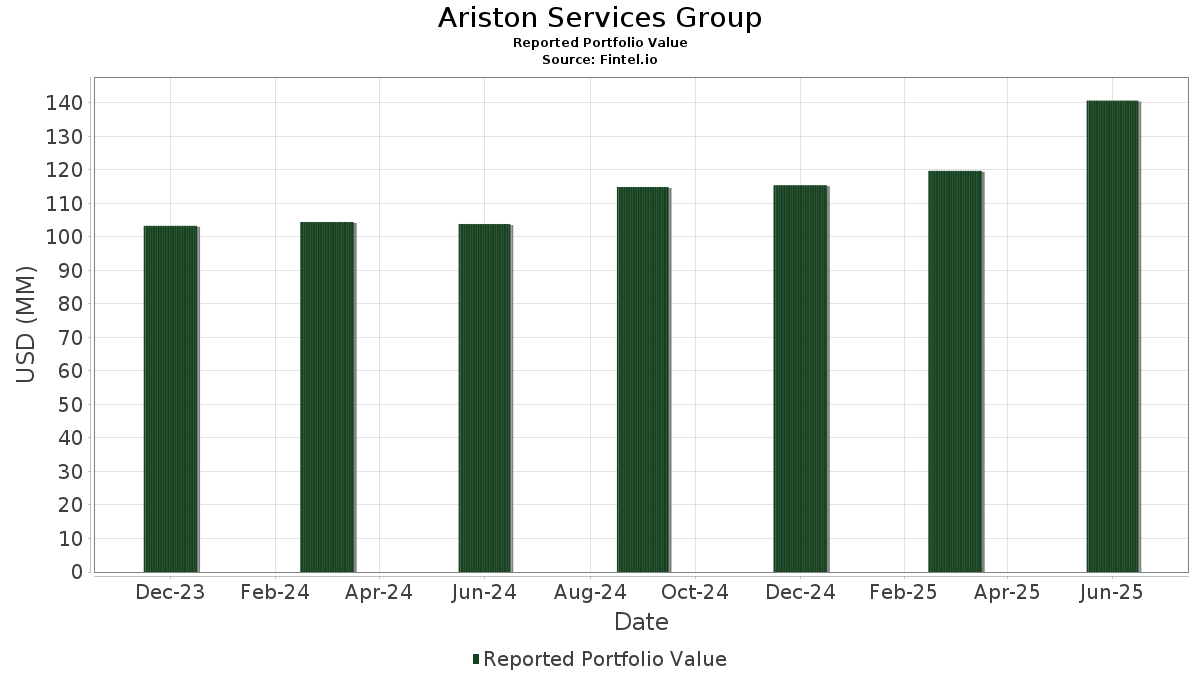
| Valeur du portefeuille | $ 140 638 518 |
| Positions actuelles | 71 |
Dernières positions, performances, ASG (à partir des dépôts 13F, 13D)
Ariston Services Group a déclaré un total de 71 positions dans ses derniers dépôts auprès de la SEC. La valeur la plus récente du portefeuille est calculée à 140 638 518 USD. Les actifs sous gestion réels (ASG) sont cette valeur plus les liquidités (qui ne sont pas divulguées). Les principales positions de Ariston Services Group sont Vanguard Specialized Funds - Vanguard Dividend Appreciation ETF (US:VIG) , Vanguard Whitehall Funds - Vanguard High Dividend Yield ETF (US:VYM) , Tesla, Inc. (US:TSLA) , Vanguard International Equity Index Funds - Vanguard FTSE Emerging Markets ETF (US:VWO) , and iShares Gold Trust (US:IAU) . Les nouvelles positions de Ariston Services Group incluent Blackstone Inc. (US:BX) , .
Meilleures augmentations ce trimestre
Nous utilisons la variation de l'allocation du portefeuille car il s'agit de l'indicateur le plus significatif. Les changements peuvent être dus à des transactions ou à des variations de prix des actions.
| Titre | Actions (en millions) |
Valeur ($ en millions) |
% du portefeuille | ΔPortefeuille % |
|---|---|---|---|---|
| 0,04 | 13,25 | 9,4244 | 9,1537 | |
| 0,01 | 1,29 | 0,9153 | 0,9153 | |
| 0,02 | 4,66 | 3,3101 | 0,8324 | |
| 0,10 | 1,83 | 1,2979 | 0,6081 | |
| 0,00 | 0,26 | 0,1818 | 0,1818 | |
| 0,00 | 0,22 | 0,1559 | 0,1559 | |
| 0,00 | 0,21 | 0,1474 | 0,1474 | |
| 0,01 | 0,95 | 0,6749 | 0,1308 | |
| 0,00 | 1,06 | 0,7513 | 0,1131 | |
| 0,00 | 0,53 | 0,3737 | 0,1122 |
Principales baisses ce trimestre
Nous utilisons la variation de l'allocation du portefeuille car il s'agit de l'indicateur le plus significatif. Les changements peuvent être dus à des transactions ou à des variations de prix des actions.
| Titre | Actions (en millions) |
Valeur ($ en millions) |
% du portefeuille | ΔPortefeuille % |
|---|---|---|---|---|
| 0,13 | 7,88 | 5,6037 | -2,3046 | |
| 0,15 | 19,85 | 14,1143 | -1,9059 | |
| 0,11 | 23,00 | 16,3506 | -1,8610 | |
| 0,02 | 4,66 | 3,3123 | -1,0830 | |
| 0,08 | 6,82 | 4,8463 | -0,9415 | |
| 0,19 | 9,25 | 6,5783 | -0,4957 | |
| 0,08 | 7,34 | 5,2175 | -0,4253 | |
| 0,09 | 6,95 | 4,9435 | -0,3767 | |
| 0,02 | 2,93 | 2,0840 | -0,2872 | |
| 0,00 | 0,00 | -0,2422 |
Déclarations 13F et dépôts de fonds
Ce formulaire a été déposé le 2025-07-29 pour la période de déclaration 2025-06-30. Cliquez sur l'icône du lien pour voir l'historique complet des transactions.
Mettre à niveau pour débloquer les données premium et exporter vers Excel ![]() .
.
| Titre | Type | Prix moyen de l'action | Actions (en millions) |
ΔActions (%) |
ΔActions (%) |
Valeur ($ en millions) |
Portefeuille (%) |
ΔPortefeuille (%) |
|
|---|---|---|---|---|---|---|---|---|---|
| VIG / Vanguard Specialized Funds - Vanguard Dividend Appreciation ETF | 0,11 | 0,00 | 23,00 | 5,51 | 16,3506 | -1,8610 | |||
| VYM / Vanguard Whitehall Funds - Vanguard High Dividend Yield ETF | 0,15 | 0,16 | 19,85 | 3,54 | 14,1143 | -1,9059 | |||
| TSLA / Tesla, Inc. | 0,04 | 3 238,00 | 13,25 | 4 003,41 | 9,4244 | 9,1537 | |||
| VWO / Vanguard International Equity Index Funds - Vanguard FTSE Emerging Markets ETF | 0,19 | 0,00 | 9,25 | 9,29 | 6,5783 | -0,4957 | |||
| IAU / iShares Gold Trust | 0,13 | -21,27 | 7,88 | -16,74 | 5,6037 | -2,3046 | |||
| VIGI / Vanguard Whitehall Funds - Vanguard International Dividend Appreciation ETF | 0,08 | 0,00 | 7,34 | 8,65 | 5,2175 | -0,4253 | |||
| VYMI / Vanguard Whitehall Funds - Vanguard International High Dividend Yield ETF | 0,09 | 0,44 | 6,95 | 9,19 | 4,9435 | -0,3767 | |||
| VNQ / Vanguard Specialized Funds - Vanguard Real Estate ETF | 0,08 | 0,03 | 6,82 | -1,60 | 4,8463 | -0,9415 | |||
| VOO / Vanguard Index Funds - Vanguard S&P 500 ETF | 0,01 | 0,16 | 5,46 | 10,69 | 3,8799 | -0,2387 | |||
| GLD / SPDR Gold Trust | 0,02 | -16,29 | 4,66 | -11,44 | 3,3123 | -1,0830 | |||
| VB / Vanguard Index Funds - Vanguard Small-Cap ETF | 0,02 | 46,90 | 4,66 | 57,00 | 3,3101 | 0,8324 | |||
| IWO / iShares Trust - iShares Russell 2000 Growth ETF | 0,01 | 0,00 | 3,38 | 11,90 | 2,4005 | -0,1211 | |||
| VPU / Vanguard World Fund - Vanguard Utilities ETF | 0,02 | -0,05 | 2,93 | 3,28 | 2,0840 | -0,2872 | |||
| ET / Energy Transfer LP - Limited Partnership | 0,10 | 126,72 | 1,83 | 121,21 | 1,2979 | 0,6081 | |||
| BX / Blackstone Inc. | 0,01 | 1,29 | 0,9153 | 0,9153 | |||||
| NFLX / Netflix, Inc. | 0,00 | -3,66 | 1,06 | 38,40 | 0,7513 | 0,1131 | |||
| NVDA / NVIDIA Corporation | 0,01 | 0,00 | 0,95 | 45,78 | 0,6749 | 0,1308 | |||
| GOOGL / Alphabet Inc. | 0,00 | 0,00 | 0,87 | 13,97 | 0,6208 | -0,0194 | |||
| JPM / JPMorgan Chase & Co. | 0,00 | 0,00 | 0,81 | 18,21 | 0,5727 | 0,0033 | |||
| GOOG / Alphabet Inc. | 0,00 | 0,00 | 0,72 | 13,52 | 0,5140 | -0,0180 | |||
| CMF / iShares Trust - iShares California Muni Bond ETF | 0,01 | 0,00 | 0,72 | -0,97 | 0,5100 | -0,0951 | |||
| XOM / Exxon Mobil Corporation | 0,01 | 25,24 | 0,70 | 13,56 | 0,4944 | -0,0174 | |||
| VTV / Vanguard Index Funds - Vanguard Value ETF | 0,00 | 5,06 | 0,63 | 7,46 | 0,4512 | -0,0421 | |||
| QCOM / QUALCOMM Incorporated | 0,00 | -0,28 | 0,57 | 3,28 | 0,4031 | -0,0551 | |||
| SSP / The E.W. Scripps Company | 0,19 | 0,00 | 0,55 | -0,54 | 0,3926 | -0,0719 | |||
| SRE / Sempra | 0,01 | 0,00 | 0,54 | 6,25 | 0,3869 | -0,0413 | |||
| VTEC / Vanguard California Tax-Free Funds - Vanguard California Tax-Exempt Bond ETF | 0,01 | 0,42 | 0,53 | -0,38 | 0,3779 | -0,0679 | |||
| VTEB / Vanguard Municipal Bond Funds - Vanguard Tax-Exempt Bond ETF | 0,01 | 0,52 | 0,53 | -0,75 | 0,3767 | -0,0690 | |||
| BA / The Boeing Company | 0,00 | 36,68 | 0,53 | 68,27 | 0,3737 | 0,1122 | |||
| VTI / Vanguard Index Funds - Vanguard Total Stock Market ETF | 0,00 | 7,65 | 0,46 | 19,07 | 0,3285 | 0,0042 | |||
| APD / Air Products and Chemicals, Inc. | 0,00 | 0,00 | 0,45 | -4,51 | 0,3171 | -0,0725 | |||
| MCHP / Microchip Technology Incorporated | 0,01 | 4,22 | 0,43 | 51,75 | 0,3088 | 0,0693 | |||
| MCK / McKesson Corporation | 0,00 | 0,00 | 0,42 | 9,11 | 0,2980 | -0,0236 | |||
| ORLY / O'Reilly Automotive, Inc. | 0,00 | 1 400,00 | 0,38 | -5,67 | 0,2730 | -0,0669 | |||
| WMB / The Williams Companies, Inc. | 0,01 | -23,85 | 0,38 | -20,13 | 0,2714 | -0,1271 | |||
| V / Visa Inc. | 0,00 | 0,00 | 0,37 | 1,10 | 0,2631 | -0,0421 | |||
| SCHW / The Charles Schwab Corporation | 0,00 | 0,00 | 0,36 | 16,83 | 0,2568 | -0,0021 | |||
| DE / Deere & Company | 0,00 | 33,65 | 0,35 | 44,67 | 0,2513 | 0,0474 | |||
| PH / Parker-Hannifin Corporation | 0,00 | 0,00 | 0,35 | 15,03 | 0,2503 | -0,0057 | |||
| BRK.B / Berkshire Hathaway Inc. | 0,00 | 17,11 | 0,34 | 6,88 | 0,2435 | -0,0244 | |||
| BAC / Bank of America Corporation | 0,01 | 0,00 | 0,34 | 13,38 | 0,2411 | -0,0088 | |||
| AVGO / Broadcom Inc. | 0,00 | 0,00 | 0,33 | 64,53 | 0,2379 | 0,0681 | |||
| TRV / The Travelers Companies, Inc. | 0,00 | 0,00 | 0,32 | 1,25 | 0,2306 | -0,0373 | |||
| INTC / Intel Corporation | 0,01 | 0,00 | 0,32 | -1,25 | 0,2250 | -0,0431 | |||
| CVS / CVS Health Corporation | 0,00 | 13,14 | 0,31 | 15,07 | 0,2230 | -0,0045 | |||
| UNH / UnitedHealth Group Incorporated | 0,00 | 13,59 | 0,30 | -32,35 | 0,2114 | -0,1558 | |||
| COP / ConocoPhillips | 0,00 | -0,09 | 0,28 | -14,46 | 0,2020 | -0,0761 | |||
| MLM / Martin Marietta Materials, Inc. | 0,00 | 0,00 | 0,28 | 15,04 | 0,2014 | -0,0047 | |||
| XPO / XPO, Inc. | 0,00 | 0,00 | 0,28 | 17,37 | 0,1975 | -0,0002 | |||
| SHW / The Sherwin-Williams Company | 0,00 | 9,14 | 0,27 | 7,45 | 0,1953 | -0,0186 | |||
| BDX / Becton, Dickinson and Company | 0,00 | 0,00 | 0,27 | -25,00 | 0,1927 | -0,1084 | |||
| AXP / American Express Company | 0,00 | -22,75 | 0,27 | -8,47 | 0,1926 | -0,0545 | |||
| MSI / Motorola Solutions, Inc. | 0,00 | 0,00 | 0,26 | -4,00 | 0,1880 | -0,0421 | |||
| HYMB / SPDR Series Trust - SPDR Nuveen ICE High Yield Municipal Bond ETF | 0,01 | 0,71 | 0,26 | -0,76 | 0,1856 | -0,0348 | |||
| CVX / Chevron Corporation | 0,00 | 0,00 | 0,26 | -14,52 | 0,1846 | -0,0688 | |||
| MSFT / Microsoft Corporation | 0,00 | 0,26 | 0,1818 | 0,1818 | |||||
| MMC / Marsh & McLennan Companies, Inc. | 0,00 | 8,25 | 0,26 | -3,04 | 0,1816 | -0,0384 | |||
| JNJ / Johnson & Johnson | 0,00 | 0,00 | 0,25 | -8,00 | 0,1803 | -0,0497 | |||
| WEC / WEC Energy Group, Inc. | 0,00 | 8,01 | 0,25 | 3,31 | 0,1779 | -0,0245 | |||
| NOC / Northrop Grumman Corporation | 0,00 | -25,75 | 0,25 | -27,78 | 0,1763 | -0,1095 | |||
| HD / The Home Depot, Inc. | 0,00 | 8,33 | 0,25 | 8,33 | 0,1762 | -0,0149 | |||
| PFE / Pfizer Inc. | 0,01 | 0,00 | 0,24 | -4,33 | 0,1730 | -0,0395 | |||
| RTX / RTX Corporation | 0,00 | -12,89 | 0,24 | -3,97 | 0,1727 | -0,0386 | |||
| PGR / The Progressive Corporation | 0,00 | 0,00 | 0,24 | -5,88 | 0,1713 | -0,0422 | |||
| COF / Capital One Financial Corporation | 0,00 | -24,65 | 0,23 | -10,67 | 0,1610 | -0,0506 | |||
| META / Meta Platforms, Inc. | 0,00 | 0,22 | 0,1559 | 0,1559 | |||||
| HLN / Haleon plc - Depositary Receipt (Common Stock) | 0,02 | 0,00 | 0,21 | 0,47 | 0,1528 | -0,0254 | |||
| TMO / Thermo Fisher Scientific Inc. | 0,00 | 0,00 | 0,21 | -18,39 | 0,1516 | -0,0671 | |||
| CMCSA / Comcast Corporation | 0,01 | 0,00 | 0,21 | -3,18 | 0,1515 | -0,0326 | |||
| USB / U.S. Bancorp | 0,00 | 0,21 | 0,1474 | 0,1474 | |||||
| F / Ford Motor Company | 0,02 | 0,00 | 0,20 | 7,73 | 0,1393 | -0,0120 | |||
| PEP / PepsiCo, Inc. | 0,00 | -100,00 | 0,00 | -100,00 | -0,2422 | ||||
| EIX / Edison International | 0,00 | -100,00 | 0,00 | 0,0000 |