Statistiques de base
| Valeur du portefeuille | $ 275 809 595 |
| Positions actuelles | 132 |
Dernières positions, performances, ASG (à partir des dépôts 13F, 13D)
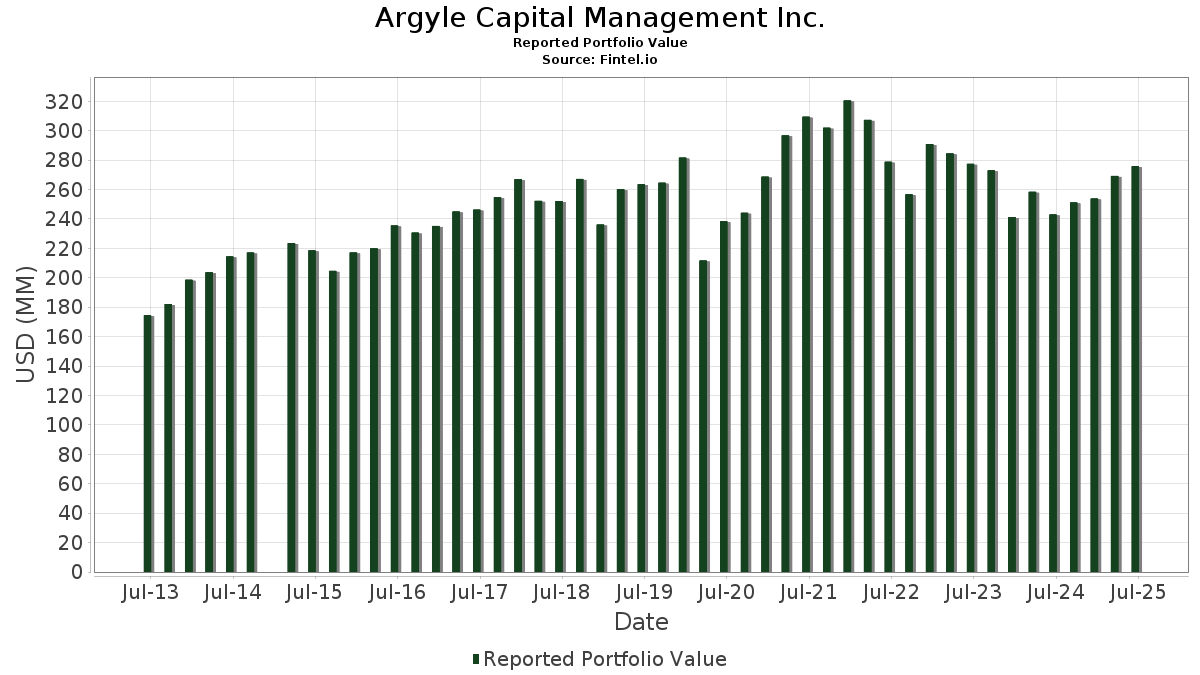
Argyle Capital Management Inc. a déclaré un total de 132 positions dans ses derniers dépôts auprès de la SEC. La valeur la plus récente du portefeuille est calculée à 275 809 595 USD. Les actifs sous gestion réels (ASG) sont cette valeur plus les liquidités (qui ne sont pas divulguées). Les principales positions de Argyle Capital Management Inc. sont Microsoft Corporation (US:MSFT) , Eli Lilly and Company (US:LLY) , JPMorgan Chase & Co. (US:JPM) , McKesson Corporation (US:MCK) , and International Business Machines Corporation (US:IBM) . Les nouvelles positions de Argyle Capital Management Inc. incluent Palantir Technologies Inc. (US:PLTR) , .
Meilleures augmentations ce trimestre
Nous utilisons la variation de l'allocation du portefeuille car il s'agit de l'indicateur le plus significatif. Les changements peuvent être dus à des transactions ou à des variations de prix des actions.
| Titre | Actions (en millions) |
Valeur ($ en millions) |
% du portefeuille | ΔPortefeuille % |
|---|---|---|---|---|
| 0,03 | 13,83 | 5,0138 | 1,0614 | |
| 0,03 | 5,55 | 2,0111 | 0,7169 | |
| 0,03 | 8,63 | 3,1301 | 0,4442 | |
| 0,02 | 6,94 | 2,5154 | 0,3047 | |
| 0,01 | 2,29 | 0,8288 | 0,2984 | |
| 0,15 | 3,08 | 1,1173 | 0,2703 | |
| 0,03 | 4,49 | 1,6266 | 0,2563 | |
| 0,02 | 2,44 | 0,8844 | 0,2264 | |
| 0,01 | 1,48 | 0,5355 | 0,2023 | |
| 0,01 | 4,49 | 1,6284 | 0,1867 |
Principales baisses ce trimestre
Nous utilisons la variation de l'allocation du portefeuille car il s'agit de l'indicateur le plus significatif. Les changements peuvent être dus à des transactions ou à des variations de prix des actions.
| Titre | Actions (en millions) |
Valeur ($ en millions) |
% du portefeuille | ΔPortefeuille % |
|---|---|---|---|---|
| 0,07 | 3,19 | 1,1556 | -0,4018 | |
| 0,01 | 8,67 | 3,1449 | -0,3883 | |
| 0,02 | 2,74 | 0,9935 | -0,3191 | |
| 0,02 | 5,41 | 1,9610 | -0,3038 | |
| 0,03 | 3,77 | 1,3663 | -0,2877 | |
| 0,06 | 4,69 | 1,7020 | -0,2851 | |
| 0,04 | 3,37 | 1,2233 | -0,2613 | |
| 0,01 | 7,84 | 2,8439 | -0,2393 | |
| 0,06 | 1,58 | 0,5730 | -0,1972 | |
| 0,03 | 4,68 | 1,6950 | -0,1829 |
Déclarations 13F et dépôts de fonds
Ce formulaire a été déposé le 2025-07-24 pour la période de déclaration 2025-06-30. Cliquez sur l'icône du lien pour voir l'historique complet des transactions.
Mettre à niveau pour débloquer les données premium et exporter vers Excel ![]() .
.
| Titre | Type | Prix moyen de l'action | Actions (en millions) |
ΔActions (%) |
ΔActions (%) |
Valeur ($ en millions) |
Portefeuille (%) |
ΔPortefeuille (%) |
|
|---|---|---|---|---|---|---|---|---|---|
| MSFT / Microsoft Corporation | 0,03 | -1,92 | 13,83 | 29,96 | 5,0138 | 1,0614 | |||
| LLY / Eli Lilly and Company | 0,01 | -3,39 | 8,67 | -8,82 | 3,1449 | -0,3883 | |||
| JPM / JPMorgan Chase & Co. | 0,03 | 1,02 | 8,63 | 19,39 | 3,1301 | 0,4442 | |||
| MCK / McKesson Corporation | 0,01 | -13,22 | 7,84 | -5,51 | 2,8439 | -0,2393 | |||
| IBM / International Business Machines Corporation | 0,02 | -1,67 | 6,94 | 16,57 | 2,5154 | 0,3047 | |||
| PNC / The PNC Financial Services Group, Inc. | 0,03 | 1,21 | 6,25 | 7,35 | 2,2677 | 0,1034 | |||
| RTX / RTX Corporation | 0,04 | -1,89 | 6,16 | 8,16 | 2,2349 | 0,1178 | |||
| ORCL / Oracle Corporation | 0,03 | 1,81 | 5,55 | 59,18 | 2,0111 | 0,7169 | |||
| DE / Deere & Company | 0,01 | -2,69 | 5,52 | 5,43 | 2,0009 | 0,0565 | |||
| AMGN / Amgen Inc. | 0,02 | -1,02 | 5,41 | -11,30 | 1,9610 | -0,3038 | |||
| CSCO / Cisco Systems, Inc. | 0,08 | -1,04 | 5,39 | 11,27 | 1,9544 | 0,1548 | |||
| MRK / Merck & Co., Inc. | 0,06 | -0,50 | 4,69 | -12,25 | 1,7020 | -0,2851 | |||
| PAYX / Paychex, Inc. | 0,03 | -1,92 | 4,68 | -7,52 | 1,6950 | -0,1829 | |||
| CAT / Caterpillar Inc. | 0,01 | -1,70 | 4,49 | 15,72 | 1,6284 | 0,1867 | |||
| EMR / Emerson Electric Co. | 0,03 | 0,00 | 4,49 | 21,60 | 1,6266 | 0,2563 | |||
| T / AT&T Inc. | 0,15 | -1,25 | 4,40 | 1,06 | 1,5941 | -0,0219 | |||
| BAC / Bank of America Corporation | 0,09 | -1,39 | 4,38 | 11,82 | 1,5877 | 0,1332 | |||
| PHM / PulteGroup, Inc. | 0,04 | -2,37 | 4,34 | 0,16 | 1,5750 | -0,0360 | |||
| JNJ / Johnson & Johnson | 0,03 | -0,38 | 3,96 | -8,26 | 1,4346 | -0,1672 | |||
| CVX / Chevron Corporation | 0,03 | -1,13 | 3,77 | -15,36 | 1,3663 | -0,2877 | |||
| KO / The Coca-Cola Company | 0,05 | -2,69 | 3,70 | -3,87 | 1,3408 | -0,0881 | |||
| DUK / Duke Energy Corporation | 0,03 | -1,56 | 3,59 | -4,75 | 1,3003 | -0,0984 | |||
| VZ / Verizon Communications Inc. | 0,08 | -0,62 | 3,58 | -5,19 | 1,2984 | -0,1048 | |||
| ENB / Enbridge Inc. | 0,08 | -1,71 | 3,57 | 0,54 | 1,2926 | -0,0246 | |||
| GPC / Genuine Parts Company | 0,03 | -1,04 | 3,46 | 0,76 | 1,2540 | -0,0210 | |||
| COP / ConocoPhillips | 0,04 | -1,21 | 3,37 | -15,59 | 1,2233 | -0,2613 | |||
| WFC / Wells Fargo & Company | 0,04 | -2,01 | 3,36 | 9,34 | 1,2182 | 0,0770 | |||
| PFE / Pfizer Inc. | 0,14 | -0,36 | 3,35 | -4,67 | 1,2146 | -0,0909 | |||
| MDT / Medtronic plc | 0,04 | 0,41 | 3,23 | -2,59 | 1,1713 | -0,0607 | |||
| BMY / Bristol-Myers Squibb Company | 0,07 | 0,15 | 3,19 | -23,97 | 1,1556 | -0,4018 | |||
| ALL / The Allstate Corporation | 0,02 | -1,53 | 3,18 | -4,28 | 1,1525 | -0,0808 | |||
| HPE / Hewlett Packard Enterprise Company | 0,15 | 1,96 | 3,08 | 35,13 | 1,1173 | 0,2703 | |||
| MMM / 3M Company | 0,02 | -1,96 | 3,05 | 1,67 | 1,1066 | -0,0088 | |||
| MET / MetLife, Inc. | 0,04 | 1,21 | 3,03 | 1,37 | 1,0979 | -0,0116 | |||
| CB / Chubb Limited | 0,01 | -2,40 | 2,90 | -6,37 | 1,0502 | -0,0989 | |||
| GM / General Motors Company | 0,06 | -1,23 | 2,77 | 3,36 | 1,0048 | 0,0088 | |||
| UPS / United Parcel Service, Inc. | 0,03 | 0,00 | 2,77 | -8,23 | 1,0030 | -0,1167 | |||
| FI / Fiserv, Inc. | 0,02 | -0,68 | 2,74 | -22,45 | 0,9935 | -0,3191 | |||
| INTC / Intel Corporation | 0,12 | -0,17 | 2,64 | -1,56 | 0,9590 | -0,0387 | |||
| WAT / Waters Corporation | 0,01 | -2,58 | 2,64 | -7,74 | 0,9555 | -0,1055 | |||
| WM / Waste Management, Inc. | 0,01 | -1,73 | 2,60 | -2,87 | 0,9439 | -0,0517 | |||
| PSX / Phillips 66 | 0,02 | 2,20 | 2,49 | -1,27 | 0,9026 | -0,0338 | |||
| DELL / Dell Technologies Inc. | 0,02 | 2,37 | 2,44 | 37,72 | 0,8844 | 0,2264 | |||
| SO / The Southern Company | 0,03 | 0,00 | 2,41 | -0,12 | 0,8747 | -0,0226 | |||
| PPL / PPL Corporation | 0,07 | -1,53 | 2,40 | -7,59 | 0,8701 | -0,0944 | |||
| CEG / Constellation Energy Corporation | 0,01 | 0,00 | 2,29 | 60,13 | 0,8288 | 0,2984 | |||
| HSY / The Hershey Company | 0,01 | 0,00 | 2,24 | -2,94 | 0,8129 | -0,0454 | |||
| CMCSA / Comcast Corporation | 0,06 | 0,49 | 2,18 | -2,80 | 0,7918 | -0,0428 | |||
| VRSN / VeriSign, Inc. | 0,01 | -1,33 | 2,15 | 12,24 | 0,7784 | 0,0680 | |||
| TFC / Truist Financial Corporation | 0,05 | 5,11 | 2,12 | 9,83 | 0,7695 | 0,0516 | |||
| CVS / CVS Health Corporation | 0,03 | 0,66 | 2,10 | 2,49 | 0,7607 | 0,0003 | |||
| DD / DuPont de Nemours, Inc. | 0,03 | 1,38 | 2,00 | -6,88 | 0,7261 | -0,0728 | |||
| GJR / Strats Trust For Procter & Gambel Security - Preferred Security | 0,01 | 0,00 | 1,93 | -6,52 | 0,7014 | -0,0672 | |||
| CTVA / Corteva, Inc. | 0,03 | -1,62 | 1,93 | 16,53 | 0,7006 | 0,0846 | |||
| WY / Weyerhaeuser Company | 0,07 | -0,75 | 1,88 | -12,94 | 0,6809 | -0,1201 | |||
| BAX / Baxter International Inc. | 0,06 | 0,17 | 1,76 | -11,40 | 0,6398 | -0,0999 | |||
| GE / General Electric Company | 0,01 | 0,00 | 1,61 | 28,61 | 0,5853 | 0,1190 | |||
| DOW / Dow Inc. | 0,06 | 0,51 | 1,58 | -23,78 | 0,5730 | -0,1972 | |||
| SLB / Schlumberger Limited | 0,05 | 2,42 | 1,58 | -17,19 | 0,5713 | -0,1354 | |||
| FITB / Fifth Third Bancorp | 0,04 | 4,64 | 1,58 | 9,83 | 0,5711 | 0,0382 | |||
| FCX / Freeport-McMoRan Inc. | 0,04 | 1,42 | 1,55 | 16,15 | 0,5606 | 0,0661 | |||
| AVGO / Broadcom Inc. | 0,01 | 0,00 | 1,48 | 64,55 | 0,5355 | 0,2023 | |||
| APD / Air Products and Chemicals, Inc. | 0,01 | 0,00 | 1,47 | -4,37 | 0,5317 | -0,0378 | |||
| GPN / Global Payments Inc. | 0,02 | -0,55 | 1,46 | -18,69 | 0,5283 | -0,1375 | |||
| SON / Sonoco Products Company | 0,03 | -2,10 | 1,42 | -9,74 | 0,5142 | -0,0694 | |||
| EXC / Exelon Corporation | 0,03 | 1,25 | 1,40 | -4,55 | 0,5092 | -0,0376 | |||
| FOUR / Shift4 Payments, Inc. | 0,01 | 7,14 | 1,34 | 29,93 | 0,4851 | 0,1027 | |||
| F / Ford Motor Company | 0,12 | -3,15 | 1,33 | 4,80 | 0,4831 | 0,0107 | |||
| UGI / UGI Corporation | 0,04 | 1,53 | 1,33 | 11,78 | 0,4816 | 0,0404 | |||
| GEHC / GE HealthCare Technologies Inc. | 0,02 | 8,47 | 1,33 | -0,45 | 0,4813 | -0,0140 | |||
| TT / Trane Technologies plc | 0,00 | 0,00 | 1,31 | 29,90 | 0,4758 | 0,1003 | |||
| HRB / H&R Block, Inc. | 0,02 | 0,00 | 1,28 | 0,00 | 0,4624 | -0,0115 | |||
| XOM / Exxon Mobil Corporation | 0,01 | 0,00 | 1,25 | -9,38 | 0,4520 | -0,0589 | |||
| HAL / Halliburton Company | 0,06 | 0,00 | 1,22 | -19,66 | 0,4432 | -0,1220 | |||
| GEV / GE Vernova Inc. | 0,00 | 0,00 | 1,21 | 73,28 | 0,4376 | 0,1790 | |||
| NXPI / NXP Semiconductors N.V. | 0,01 | 8,28 | 1,16 | 24,41 | 0,4198 | 0,0743 | |||
| FLO / Flowers Foods, Inc. | 0,07 | 0,00 | 1,13 | -16,00 | 0,4115 | -0,0900 | |||
| ADM / Archer-Daniels-Midland Company | 0,02 | 0,98 | 1,09 | 10,94 | 0,3937 | 0,0304 | |||
| BRK.B / Berkshire Hathaway Inc. | 0,00 | 0,00 | 1,08 | -8,78 | 0,3921 | -0,0483 | |||
| HPQ / HP Inc. | 0,04 | 4,02 | 1,01 | -8,08 | 0,3669 | -0,0422 | |||
| TRP / TC Energy Corporation | 0,02 | -0,80 | 1,00 | 2,57 | 0,3615 | 0,0003 | |||
| AAPL / Apple Inc. | 0,00 | 0,00 | 0,97 | -7,69 | 0,3530 | -0,0385 | |||
| PEP / PepsiCo, Inc. | 0,01 | 3,03 | 0,90 | -9,30 | 0,3255 | -0,0420 | |||
| MKC / McCormick & Company, Incorporated | 0,01 | 0,00 | 0,80 | -7,95 | 0,2900 | -0,0325 | |||
| TXN / Texas Instruments Incorporated | 0,00 | 0,00 | 0,77 | 15,66 | 0,2785 | 0,0316 | |||
| ADP / Automatic Data Processing, Inc. | 0,00 | 0,00 | 0,77 | 0,92 | 0,2781 | -0,0042 | |||
| BP / BP p.l.c. - Depositary Receipt (Common Stock) | 0,03 | 0,00 | 0,76 | -11,42 | 0,2757 | -0,0432 | |||
| VLO / Valero Energy Corporation | 0,01 | 0,00 | 0,74 | 1,79 | 0,2681 | -0,0018 | |||
| CAG / Conagra Brands, Inc. | 0,04 | 0,57 | 0,72 | -22,81 | 0,2616 | -0,0856 | |||
| MSI / Motorola Solutions, Inc. | 0,00 | 0,00 | 0,71 | -3,90 | 0,2590 | -0,0173 | |||
| MCO / Moody's Corporation | 0,00 | 0,00 | 0,70 | 7,83 | 0,2546 | 0,0124 | |||
| GLW / Corning Incorporated | 0,01 | 0,00 | 0,70 | 14,83 | 0,2530 | 0,0274 | |||
| GWW / W.W. Grainger, Inc. | 0,00 | 0,00 | 0,69 | 5,34 | 0,2508 | 0,0068 | |||
| AEP / American Electric Power Company, Inc. | 0,01 | 0,00 | 0,68 | -5,13 | 0,2483 | -0,0196 | |||
| QCOM / QUALCOMM Incorporated | 0,00 | 4,99 | 0,67 | 8,94 | 0,2430 | 0,0143 | |||
| KHC / The Kraft Heinz Company | 0,03 | 3,23 | 0,66 | -12,37 | 0,2391 | -0,0405 | |||
| ABBV / AbbVie Inc. | 0,00 | 0,00 | 0,65 | -11,46 | 0,2356 | -0,0368 | |||
| NSC / Norfolk Southern Corporation | 0,00 | 0,00 | 0,63 | 8,06 | 0,2285 | 0,0119 | |||
| AMCR / Amcor plc | 0,07 | 0,00 | 0,62 | -5,34 | 0,2253 | -0,0183 | |||
| ITW / Illinois Tool Works Inc. | 0,00 | 0,00 | 0,62 | -0,32 | 0,2232 | -0,0062 | |||
| DXC / DXC Technology Company | 0,04 | -9,08 | 0,61 | -18,51 | 0,2221 | -0,0570 | |||
| TTE / TotalEnergies SE - Depositary Receipt (Common Stock) | 0,01 | 0,00 | 0,60 | -5,06 | 0,2181 | -0,0173 | |||
| KMB / Kimberly-Clark Corporation | 0,00 | 0,00 | 0,60 | -9,27 | 0,2166 | -0,0282 | |||
| NVDA / NVIDIA Corporation | 0,00 | 0,00 | 0,55 | 45,65 | 0,2005 | 0,0596 | |||
| ABT / Abbott Laboratories | 0,00 | 0,00 | 0,53 | 2,71 | 0,1926 | 0,0002 | |||
| MGA / Magna International Inc. | 0,01 | 1,61 | 0,49 | 15,44 | 0,1764 | 0,0198 | |||
| SIGI / Selective Insurance Group, Inc. | 0,01 | 0,00 | 0,47 | -5,39 | 0,1720 | -0,0142 | |||
| CHTR / Charter Communications, Inc. | 0,00 | -3,98 | 0,47 | 6,31 | 0,1715 | 0,0065 | |||
| PEG / Public Service Enterprise Group Incorporated | 0,01 | 18,78 | 0,45 | 21,51 | 0,1641 | 0,0257 | |||
| SWK / Stanley Black & Decker, Inc. | 0,01 | 1,52 | 0,45 | -10,50 | 0,1640 | -0,0238 | |||
| NEE / NextEra Energy, Inc. | 0,01 | 0,00 | 0,45 | -1,97 | 0,1628 | -0,0075 | |||
| LW / Lamb Weston Holdings, Inc. | 0,01 | -4,19 | 0,39 | -6,86 | 0,1430 | -0,0142 | |||
| PNR / Pentair plc | 0,00 | 0,00 | 0,39 | 17,33 | 0,1402 | 0,0178 | |||
| AMZN / Amazon.com, Inc. | 0,00 | 0,00 | 0,38 | 15,45 | 0,1383 | 0,0154 | |||
| PTC / PTC Inc. | 0,00 | 0,00 | 0,36 | 11,49 | 0,1302 | 0,0103 | |||
| CR / Crane Company | 0,00 | 0,00 | 0,34 | 24,19 | 0,1248 | 0,0217 | |||
| EMN / Eastman Chemical Company | 0,00 | 28,86 | 0,33 | 9,18 | 0,1209 | 0,0075 | |||
| CNP / CenterPoint Energy, Inc. | 0,01 | 0,00 | 0,32 | 1,29 | 0,1146 | -0,0012 | |||
| NVT / nVent Electric plc | 0,00 | 0,00 | 0,29 | 39,81 | 0,1044 | 0,0279 | |||
| NVS / Novartis AG - Depositary Receipt (Common Stock) | 0,00 | 0,00 | 0,29 | 8,71 | 0,1042 | 0,0059 | |||
| SOLV / Solventum Corporation | 0,00 | -9,74 | 0,28 | -10,13 | 0,1031 | -0,0142 | |||
| BIL / SPDR Series Trust - SPDR Bloomberg 1-3 Month T-Bill ETF | 0,00 | -1,94 | 0,27 | -2,15 | 0,0993 | -0,0044 | |||
| PLTR / Palantir Technologies Inc. | 0,00 | 0,27 | 0,0989 | 0,0989 | |||||
| TEVA / Teva Pharmaceutical Industries Limited - Depositary Receipt (Common Stock) | 0,02 | 0,00 | 0,27 | 9,27 | 0,0984 | 0,0060 | |||
| AFL / Aflac Incorporated | 0,00 | 0,00 | 0,22 | -5,11 | 0,0811 | -0,0065 | |||
| HSBC / HSBC Holdings plc - Depositary Receipt (Common Stock) | 0,00 | 0,00 | 0,22 | 5,74 | 0,0804 | 0,0026 | |||
| IR / Ingersoll Rand Inc. | 0,00 | 0,00 | 0,22 | 4,27 | 0,0798 | 0,0011 | |||
| DVN / Devon Energy Corporation | 0,01 | 0,00 | 0,22 | -14,90 | 0,0788 | -0,0161 | |||
| MA / Mastercard Incorporated | 0,00 | 0,00 | 0,22 | 2,87 | 0,0780 | 0,0001 | |||
| Labcorp Holdings Inc. / (50540R409) | 0,00 | 0,20 | 0,0000 | ||||||
| WBD / Warner Bros. Discovery, Inc. | 0,01 | 0,00 | 0,12 | 6,48 | 0,0418 | 0,0017 | |||
| NWL / Newell Brands Inc. | 0,01 | 0,00 | 0,06 | -12,68 | 0,0227 | -0,0040 |