Statistiques de base
| Valeur du portefeuille | $ 140 905 156 |
| Positions actuelles | 111 |
Dernières positions, performances, ASG (à partir des dépôts 13F, 13D)
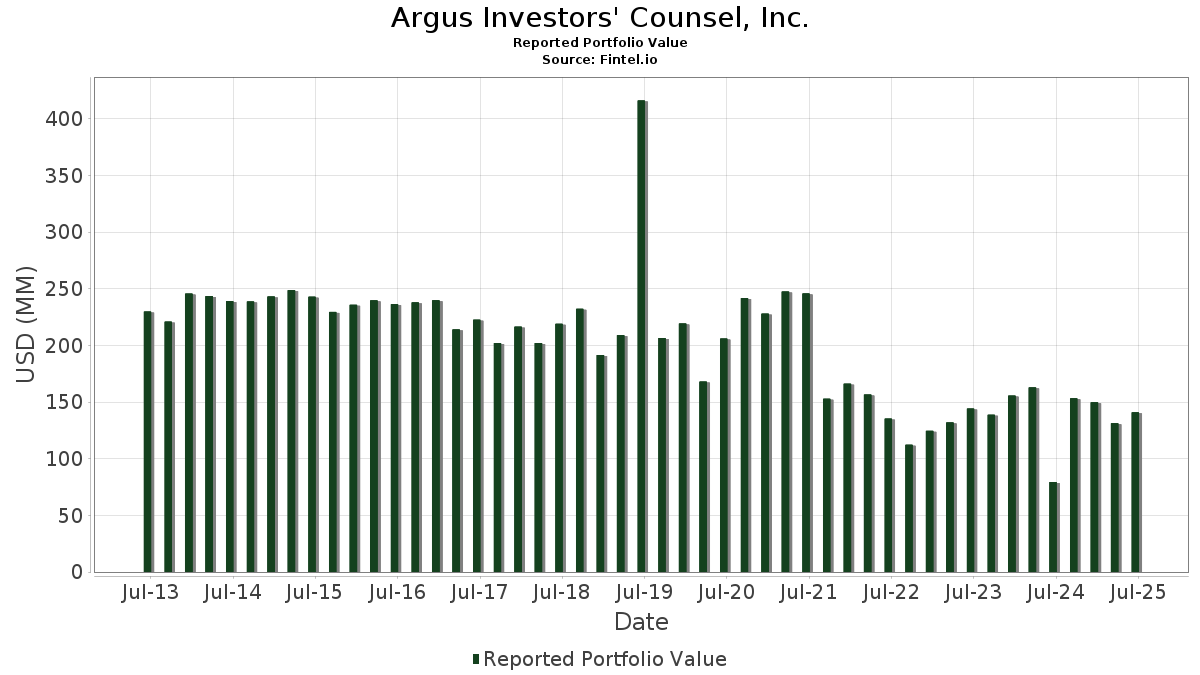
Argus Investors' Counsel, Inc. a déclaré un total de 111 positions dans ses derniers dépôts auprès de la SEC. La valeur la plus récente du portefeuille est calculée à 140 905 156 USD. Les actifs sous gestion réels (ASG) sont cette valeur plus les liquidités (qui ne sont pas divulguées). Les principales positions de Argus Investors' Counsel, Inc. sont Costco Wholesale Corporation (US:COST) , NVIDIA Corporation (US:NVDA) , Meta Platforms, Inc. (US:META) , JPMorgan Chase & Co. (US:JPM) , and Apple Inc. (US:AAPL) . Les nouvelles positions de Argus Investors' Counsel, Inc. incluent General Electric Company (US:GE) , Uber Technologies, Inc. (US:UBER) , Constellation Energy Corporation (US:CEG) , Kimco Realty Corporation (US:KIM) , and .
Meilleures augmentations ce trimestre
Nous utilisons la variation de l'allocation du portefeuille car il s'agit de l'indicateur le plus significatif. Les changements peuvent être dus à des transactions ou à des variations de prix des actions.
| Titre | Actions (en millions) |
Valeur ($ en millions) |
% du portefeuille | ΔPortefeuille % |
|---|---|---|---|---|
| 0,03 | 4,90 | 3,4771 | 0,9183 | |
| 0,00 | 3,65 | 2,5903 | 0,8567 | |
| 0,02 | 3,60 | 2,5554 | 0,8290 | |
| 0,01 | 3,16 | 2,2458 | 0,6502 | |
| 0,01 | 4,78 | 3,3911 | 0,5814 | |
| 0,00 | 0,81 | 0,5750 | 0,5750 | |
| 0,01 | 0,81 | 0,5736 | 0,5736 | |
| 0,01 | 1,89 | 1,3388 | 0,4269 | |
| 0,00 | 1,81 | 1,2830 | 0,3956 | |
| 0,00 | 0,53 | 0,3733 | 0,3733 |
Principales baisses ce trimestre
Nous utilisons la variation de l'allocation du portefeuille car il s'agit de l'indicateur le plus significatif. Les changements peuvent être dus à des transactions ou à des variations de prix des actions.
| Titre | Actions (en millions) |
Valeur ($ en millions) |
% du portefeuille | ΔPortefeuille % |
|---|---|---|---|---|
| 0,02 | 4,08 | 2,8978 | -0,8582 | |
| 0,01 | 5,05 | 3,5809 | -0,6303 | |
| 0,00 | 3,73 | 2,6468 | -0,3887 | |
| 0,01 | 2,36 | 1,6771 | -0,3578 | |
| 0,00 | 1,24 | 0,8819 | -0,2576 | |
| 0,01 | 1,22 | 0,8665 | -0,2449 | |
| 0,00 | 2,58 | 1,8342 | -0,2390 | |
| 0,00 | 1,44 | 1,0223 | -0,2227 | |
| 0,00 | 0,94 | 0,6685 | -0,1993 | |
| 0,00 | 1,12 | 0,7927 | -0,1853 |
Déclarations 13F et dépôts de fonds
Ce formulaire a été déposé le 2025-07-17 pour la période de déclaration 2025-06-30. Cliquez sur l'icône du lien pour voir l'historique complet des transactions.
Mettre à niveau pour débloquer les données premium et exporter vers Excel ![]() .
.
| Titre | Type | Prix moyen de l'action | Actions (en millions) |
ΔActions (%) |
ΔActions (%) |
Valeur ($ en millions) |
Portefeuille (%) |
ΔPortefeuille (%) |
|
|---|---|---|---|---|---|---|---|---|---|
| COST / Costco Wholesale Corporation | 0,01 | -12,78 | 5,05 | -8,72 | 3,5809 | -0,6303 | |||
| NVDA / NVIDIA Corporation | 0,03 | 0,07 | 4,90 | 45,89 | 3,4771 | 0,9183 | |||
| META / Meta Platforms, Inc. | 0,01 | 1,17 | 4,78 | 29,59 | 3,3911 | 0,5814 | |||
| JPM / JPMorgan Chase & Co. | 0,02 | -13,03 | 4,44 | 2,80 | 3,1540 | -0,1399 | |||
| AAPL / Apple Inc. | 0,02 | -10,34 | 4,08 | -17,18 | 2,8978 | -0,8582 | |||
| TT / Trane Technologies plc | 0,01 | -9,91 | 3,73 | 16,95 | 2,6490 | 0,2176 | |||
| LLY / Eli Lilly and Company | 0,00 | -0,83 | 3,73 | -6,40 | 2,6468 | -0,3887 | |||
| AXON / Axon Enterprise, Inc. | 0,00 | 1,90 | 3,65 | 60,40 | 2,5903 | 0,8567 | |||
| ORCL / Oracle Corporation | 0,02 | 1,61 | 3,60 | 58,87 | 2,5554 | 0,8290 | |||
| AMZN / Amazon.com, Inc. | 0,02 | -5,03 | 3,48 | 9,50 | 2,4701 | 0,0486 | |||
| V / Visa Inc. | 0,01 | 0,02 | 3,44 | 1,33 | 2,4389 | -0,1450 | |||
| GOOGL / Alphabet Inc. | 0,02 | -6,22 | 3,24 | 6,90 | 2,2987 | -0,0102 | |||
| PWR / Quanta Services, Inc. | 0,01 | 1,58 | 3,16 | 51,10 | 2,2458 | 0,6502 | |||
| BLK / BlackRock, Inc. | 0,00 | 0,27 | 3,07 | 11,16 | 2,1774 | 0,0747 | |||
| ADI / Analog Devices, Inc. | 0,01 | 0,75 | 3,03 | 18,95 | 2,1519 | 0,2092 | |||
| BSX / Boston Scientific Corporation | 0,03 | 1,57 | 2,89 | 8,13 | 2,0477 | 0,0150 | |||
| SCHW / The Charles Schwab Corporation | 0,03 | -1,81 | 2,63 | 14,45 | 1,8661 | 0,1158 | |||
| SPGI / S&P Global Inc. | 0,00 | -8,50 | 2,58 | -5,03 | 1,8342 | -0,2390 | |||
| MSFT / Microsoft Corporation | 0,01 | -15,78 | 2,57 | 11,60 | 1,8233 | 0,0693 | |||
| URI / United Rentals, Inc. | 0,00 | 1,82 | 2,53 | 22,41 | 1,7953 | 0,2208 | |||
| WFC / Wells Fargo & Company | 0,03 | 1,79 | 2,52 | 13,58 | 1,7867 | 0,0983 | |||
| TRGP / Targa Resources Corp. | 0,01 | 1,88 | 2,36 | -11,53 | 1,6771 | -0,3578 | |||
| ISRG / Intuitive Surgical, Inc. | 0,00 | -1,28 | 2,22 | 8,33 | 1,5789 | 0,0141 | |||
| AVGO / Broadcom Inc. | 0,01 | -12,20 | 1,93 | 44,59 | 1,3672 | 0,3519 | |||
| RCL / Royal Caribbean Cruises Ltd. | 0,01 | 3,40 | 1,89 | 57,69 | 1,3388 | 0,4269 | |||
| NFLX / Netflix, Inc. | 0,00 | 8,09 | 1,81 | 55,24 | 1,2830 | 0,3956 | |||
| NOW / ServiceNow, Inc. | 0,00 | 1,16 | 1,79 | 30,61 | 1,2725 | 0,2268 | |||
| AXP / American Express Company | 0,01 | -2,37 | 1,75 | 15,79 | 1,2385 | 0,0898 | |||
| ADBE / Adobe Inc. | 0,00 | 1,08 | 1,70 | 1,98 | 1,2073 | -0,0638 | |||
| AMAT / Applied Materials, Inc. | 0,01 | 1,14 | 1,68 | 27,60 | 1,1944 | 0,1895 | |||
| WMT / Walmart Inc. | 0,02 | 39,62 | 1,51 | 55,51 | 1,0720 | 0,3320 | |||
| SYK / Stryker Corporation | 0,00 | -17,06 | 1,44 | -11,87 | 1,0223 | -0,2227 | |||
| PYPL / PayPal Holdings, Inc. | 0,02 | 3,73 | 1,31 | 18,16 | 0,9289 | 0,0849 | |||
| TMO / Thermo Fisher Scientific Inc. | 0,00 | 1,96 | 1,24 | -16,92 | 0,8819 | -0,2576 | |||
| XOM / Exxon Mobil Corporation | 0,01 | -7,67 | 1,22 | -16,32 | 0,8665 | -0,2449 | |||
| HD / The Home Depot, Inc. | 0,00 | -10,93 | 1,21 | -10,90 | 0,8589 | -0,1758 | |||
| IWF / iShares Trust - iShares Russell 1000 Growth ETF | 0,00 | -1,89 | 1,19 | 15,41 | 0,8455 | 0,0587 | |||
| TJX / The TJX Companies, Inc. | 0,01 | 71,18 | 1,19 | 73,65 | 0,8424 | 0,3214 | |||
| CRM / Salesforce, Inc. | 0,00 | -14,36 | 1,12 | -13,02 | 0,7927 | -0,1853 | |||
| MA / Mastercard Incorporated | 0,00 | -19,35 | 0,94 | -17,38 | 0,6685 | -0,1993 | |||
| TXN / Texas Instruments Incorporated | 0,00 | 27,64 | 0,84 | 47,38 | 0,5988 | 0,1629 | |||
| PG / The Procter & Gamble Company | 0,01 | -0,06 | 0,83 | -6,50 | 0,5919 | -0,0882 | |||
| GLW / Corning Incorporated | 0,02 | 0,45 | 0,82 | 15,44 | 0,5787 | 0,0404 | |||
| GE / General Electric Company | 0,00 | 0,81 | 0,5750 | 0,5750 | |||||
| UBER / Uber Technologies, Inc. | 0,01 | 0,81 | 0,5736 | 0,5736 | |||||
| ABT / Abbott Laboratories | 0,01 | -11,39 | 0,79 | -9,11 | 0,5595 | -0,1016 | |||
| AMGN / Amgen Inc. | 0,00 | -0,04 | 0,77 | -10,44 | 0,5485 | -0,1087 | |||
| NUE / Nucor Corporation | 0,01 | 5,22 | 0,77 | 13,27 | 0,5452 | 0,0285 | |||
| VZ / Verizon Communications Inc. | 0,02 | 0,00 | 0,76 | -4,62 | 0,5418 | -0,0679 | |||
| ZTS / Zoetis Inc. | 0,00 | -0,15 | 0,73 | -5,41 | 0,5215 | -0,0704 | |||
| DIS / The Walt Disney Company | 0,01 | 2,62 | 0,73 | 28,80 | 0,5179 | 0,0867 | |||
| JNJ / Johnson & Johnson | 0,00 | -5,43 | 0,73 | -12,95 | 0,5159 | -0,1199 | |||
| MS / Morgan Stanley | 0,01 | 0,00 | 0,72 | 20,67 | 0,5098 | 0,0565 | |||
| ADP / Automatic Data Processing, Inc. | 0,00 | -16,06 | 0,71 | -15,37 | 0,5010 | -0,1338 | |||
| CSCO / Cisco Systems, Inc. | 0,01 | 0,00 | 0,69 | 12,34 | 0,4916 | 0,0222 | |||
| CTAS / Cintas Corporation | 0,00 | -6,34 | 0,69 | 1,63 | 0,4864 | -0,0277 | |||
| AMT / American Tower Corporation | 0,00 | 0,00 | 0,68 | 1,49 | 0,4823 | -0,0274 | |||
| CAT / Caterpillar Inc. | 0,00 | 0,00 | 0,68 | 17,74 | 0,4808 | 0,0423 | |||
| USB / U.S. Bancorp | 0,01 | 0,00 | 0,68 | 7,14 | 0,4796 | -0,0008 | |||
| GD / General Dynamics Corporation | 0,00 | 0,00 | 0,66 | 7,01 | 0,4659 | -0,0015 | |||
| EMR / Emerson Electric Co. | 0,00 | 0,00 | 0,65 | 21,56 | 0,4646 | 0,0545 | |||
| KLAC / KLA Corporation | 0,00 | -6,49 | 0,64 | 23,14 | 0,4577 | 0,0589 | |||
| INTU / Intuit Inc. | 0,00 | -6,61 | 0,64 | 19,70 | 0,4576 | 0,0475 | |||
| MAR / Marriott International, Inc. | 0,00 | 0,00 | 0,64 | 14,82 | 0,4566 | 0,0293 | |||
| MCD / McDonald's Corporation | 0,00 | 0,00 | 0,63 | -6,50 | 0,4495 | -0,0664 | |||
| IEI / iShares Trust - iShares 3-7 Year Treasury Bond ETF | 0,01 | 0,00 | 0,63 | 0,80 | 0,4452 | -0,0289 | |||
| ITW / Illinois Tool Works Inc. | 0,00 | 0,00 | 0,61 | -0,17 | 0,4294 | -0,0330 | |||
| BK / The Bank of New York Mellon Corporation | 0,01 | -9,17 | 0,60 | -1,47 | 0,4293 | -0,0377 | |||
| BSV / Vanguard Bond Index Funds - Vanguard Short-Term Bond ETF | 0,01 | 0,00 | 0,60 | 0,50 | 0,4255 | -0,0288 | |||
| APD / Air Products and Chemicals, Inc. | 0,00 | 0,00 | 0,59 | -4,36 | 0,4204 | -0,0515 | |||
| IBM / International Business Machines Corporation | 0,00 | -0,30 | 0,59 | 18,07 | 0,4180 | 0,0383 | |||
| NDAQ / Nasdaq, Inc. | 0,01 | -6,73 | 0,59 | 9,91 | 0,4176 | 0,0098 | |||
| VCIT / Vanguard Scottsdale Funds - Vanguard Intermediate-Term Corporate Bond ETF | 0,01 | 0,00 | 0,57 | 1,43 | 0,4033 | -0,0236 | |||
| UNP / Union Pacific Corporation | 0,00 | -20,79 | 0,56 | -22,88 | 0,4001 | -0,1566 | |||
| XONE / BondBloxx ETF Trust - BondBloxx Bloomberg One Year Target Duration US Treasury ETF | 0,01 | 0,00 | 0,56 | -0,18 | 0,4000 | -0,0302 | |||
| FLOT / iShares Trust - iShares Floating Rate Bond ETF | 0,01 | 1,39 | 0,56 | 1,27 | 0,3956 | -0,0235 | |||
| IP / International Paper Company | 0,01 | 0,00 | 0,55 | -12,10 | 0,3918 | -0,0874 | |||
| EFA / iShares Trust - iShares MSCI EAFE ETF | 0,01 | 8,42 | 0,54 | 18,50 | 0,3825 | 0,0362 | |||
| DUK / Duke Energy Corporation | 0,00 | 0,00 | 0,53 | -3,29 | 0,3760 | -0,0412 | |||
| ECL / Ecolab Inc. | 0,00 | 0,53 | 0,3733 | 0,3733 | |||||
| XHLF / BondBloxx ETF Trust - BondBloxx Bloomberg Six Month Target Duration US Treasury ETF | 0,01 | -18,67 | 0,52 | -18,71 | 0,3673 | -0,1177 | |||
| PH / Parker-Hannifin Corporation | 0,00 | -6,39 | 0,51 | 7,58 | 0,3634 | 0,0007 | |||
| ANET / Arista Networks Inc | 0,00 | 1,23 | 0,51 | 33,77 | 0,3599 | 0,0709 | |||
| J / Jacobs Solutions Inc. | 0,00 | -5,51 | 0,51 | 2,84 | 0,3598 | -0,0161 | |||
| HCA / HCA Healthcare, Inc. | 0,00 | -6,58 | 0,51 | 3,48 | 0,3589 | -0,0131 | |||
| AIG / American International Group, Inc. | 0,01 | -7,84 | 0,49 | -9,33 | 0,3456 | -0,0633 | |||
| SPHQ / Invesco Exchange-Traded Fund Trust - Invesco S&P 500 Quality ETF | 0,01 | 0,00 | 0,48 | 7,35 | 0,3427 | 0,0002 | |||
| PGX / Invesco Exchange-Traded Fund Trust II - Invesco Preferred ETF | 0,04 | 0,00 | 0,48 | -0,83 | 0,3410 | -0,0280 | |||
| MCK / McKesson Corporation | 0,00 | 60,69 | 0,48 | 75,46 | 0,3401 | 0,1314 | |||
| BMI / Badger Meter, Inc. | 0,00 | -6,84 | 0,47 | 19,90 | 0,3339 | 0,0351 | |||
| TSM / Taiwan Semiconductor Manufacturing Company Limited - Depositary Receipt (Common Stock) | 0,00 | -9,35 | 0,47 | 23,54 | 0,3319 | 0,0438 | |||
| IWM / iShares Trust - iShares Russell 2000 ETF | 0,00 | -0,34 | 0,44 | 7,86 | 0,3121 | 0,0013 | |||
| NEE / NextEra Energy, Inc. | 0,01 | -21,74 | 0,44 | -23,33 | 0,3102 | -0,1243 | |||
| BDX / Becton, Dickinson and Company | 0,00 | 19,91 | 0,44 | -9,94 | 0,3093 | -0,0589 | |||
| RJF / Raymond James Financial, Inc. | 0,00 | -6,26 | 0,43 | 3,58 | 0,3080 | -0,0115 | |||
| PEP / PepsiCo, Inc. | 0,00 | -15,89 | 0,41 | -25,90 | 0,2927 | -0,1315 | |||
| SCHD / Schwab Strategic Trust - Schwab U.S. Dividend Equity ETF | 0,01 | 0,00 | 0,38 | -5,24 | 0,2703 | -0,0359 | |||
| AMP / Ameriprise Financial, Inc. | 0,00 | -0,49 | 0,33 | 9,80 | 0,2311 | 0,0050 | |||
| CMG / Chipotle Mexican Grill, Inc. | 0,01 | -26,55 | 0,32 | -17,81 | 0,2296 | -0,0704 | |||
| IVV / iShares Trust - iShares Core S&P 500 ETF | 0,00 | -15,68 | 0,31 | -6,91 | 0,2203 | -0,0335 | |||
| TMUS / T-Mobile US, Inc. | 0,00 | -0,51 | 0,28 | -11,15 | 0,1982 | -0,0412 | |||
| WM / Waste Management, Inc. | 0,00 | -43,79 | 0,27 | -44,49 | 0,1896 | -0,1769 | |||
| VIG / Vanguard Specialized Funds - Vanguard Dividend Appreciation ETF | 0,00 | 0,00 | 0,26 | 5,60 | 0,1878 | -0,0033 | |||
| SO / The Southern Company | 0,00 | -7,08 | 0,26 | -7,14 | 0,1846 | -0,0290 | |||
| NSC / Norfolk Southern Corporation | 0,00 | 0,00 | 0,26 | 8,05 | 0,1817 | 0,0012 | |||
| BX / Blackstone Inc. | 0,00 | -14,70 | 0,25 | -8,70 | 0,1793 | -0,0316 | |||
| CEG / Constellation Energy Corporation | 0,00 | 0,25 | 0,1752 | 0,1752 | |||||
| DKS / DICK'S Sporting Goods, Inc. | 0,00 | 0,54 | 0,22 | -1,35 | 0,1568 | -0,0138 | |||
| TBIL / The RBB Fund, Inc. - F/m US Treasury 3 Month Bill ETF | 0,00 | -37,15 | 0,21 | -37,17 | 0,1513 | -0,1072 | |||
| GEHC / GE HealthCare Technologies Inc. | 0,00 | -0,42 | 0,21 | -8,73 | 0,1487 | -0,0260 | |||
| KIM / Kimco Realty Corporation | 0,01 | 0,20 | 0,1431 | 0,1431 | |||||
| ODFL / Old Dominion Freight Line, Inc. | 0,00 | -100,00 | 0,00 | 0,0000 | |||||
| DELL / Dell Technologies Inc. | 0,00 | -100,00 | 0,00 | 0,0000 | |||||
| SHEL / Shell plc - Depositary Receipt (Common Stock) | 0,00 | -100,00 | 0,00 | 0,0000 | |||||
| PSX / Phillips 66 | 0,00 | -100,00 | 0,00 | 0,0000 | |||||
| UNH / UnitedHealth Group Incorporated | 0,00 | -100,00 | 0,00 | 0,0000 | |||||
| ROP / Roper Technologies, Inc. | 0,00 | -100,00 | 0,00 | 0,0000 | |||||
| LMT / Lockheed Martin Corporation | 0,00 | -100,00 | 0,00 | 0,0000 | |||||
| DHI / D.R. Horton, Inc. | 0,00 | -100,00 | 0,00 | 0,0000 |