Statistiques de base
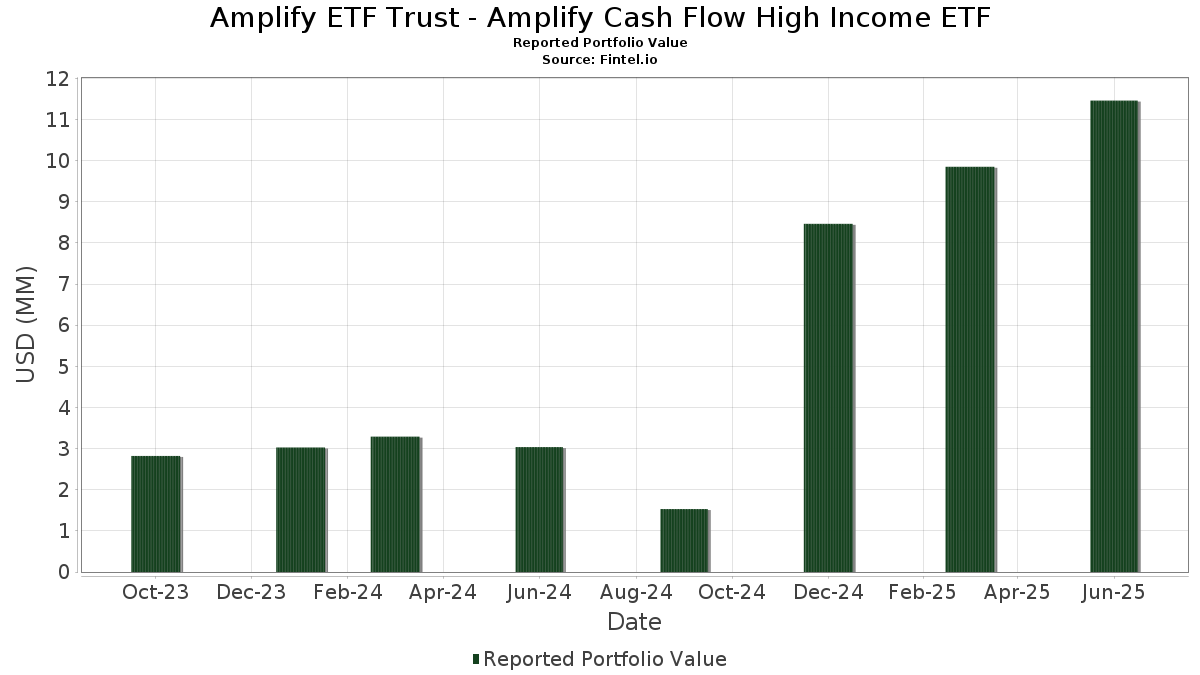
| Valeur du portefeuille | $ 11 460 496 |
| Positions actuelles | 129 |
Dernières positions, performances, ASG (à partir des dépôts 13F, 13D)
Amplify ETF Trust - Amplify Cash Flow High Income ETF a déclaré un total de 129 positions dans ses derniers dépôts auprès de la SEC. La valeur la plus récente du portefeuille est calculée à 11 460 496 USD. Les actifs sous gestion réels (ASG) sont cette valeur plus les liquidités (qui ne sont pas divulguées). Les principales positions de Amplify ETF Trust - Amplify Cash Flow High Income ETF sont Dell Technologies Inc. (US:DELL) , Tapestry, Inc. (US:TPR) , WESCO International, Inc. (US:WCC) , Alcoa Corporation (US:AA) , and FedEx Corporation (US:FDX) . Les nouvelles positions de Amplify ETF Trust - Amplify Cash Flow High Income ETF incluent Dell Technologies Inc. (US:DELL) , WESCO International, Inc. (US:WCC) , Alcoa Corporation (US:AA) , QUALCOMM Incorporated (US:QCOM) , and Bath & Body Works, Inc. (US:BBWI) .
Meilleures augmentations ce trimestre
Nous utilisons la variation de l'allocation du portefeuille car il s'agit de l'indicateur le plus significatif. Les changements peuvent être dus à des transactions ou à des variations de prix des actions.
| Titre | Actions (en millions) |
Valeur ($ en millions) |
% du portefeuille | ΔPortefeuille % |
|---|---|---|---|---|
| 0,00 | 0,32 | 2,7526 | 2,7526 | |
| 0,00 | 0,30 | 2,6031 | 2,6031 | |
| 0,01 | 0,30 | 2,5646 | 2,5646 | |
| 0,00 | 0,29 | 2,4939 | 2,4939 | |
| 0,01 | 0,27 | 2,2798 | 2,2798 | |
| 0,02 | 0,25 | 2,1789 | 2,1789 | |
| 0,00 | 0,24 | 2,0960 | 2,0960 | |
| 0,00 | 0,24 | 2,0873 | 2,0873 | |
| 0,00 | 0,24 | 2,0838 | 2,0838 | |
| 0,01 | 0,23 | 1,9501 | 1,9501 |
Principales baisses ce trimestre
Nous utilisons la variation de l'allocation du portefeuille car il s'agit de l'indicateur le plus significatif. Les changements peuvent être dus à des transactions ou à des variations de prix des actions.
| Titre | Actions (en millions) |
Valeur ($ en millions) |
% du portefeuille | ΔPortefeuille % |
|---|---|---|---|---|
| 0,00 | 0,00 | -2,7138 | ||
| 0,00 | 0,00 | -2,4699 | ||
| 0,00 | 0,00 | -2,3740 | ||
| 0,00 | 0,00 | -2,3662 | ||
| 0,00 | 0,00 | -2,3392 | ||
| 0,00 | 0,00 | -1,9502 | ||
| 0,00 | 0,00 | -1,6115 | ||
| 0,00 | 0,00 | -1,3426 | ||
| 0,00 | 0,00 | -1,3408 | ||
| 0,00 | 0,00 | -1,2466 |
Déclarations 13F et dépôts de fonds
Ce formulaire a été déposé le 2025-08-27 pour la période de déclaration 2025-06-30. Cliquez sur l'icône du lien pour voir l'historique complet des transactions.
Mettre à niveau pour débloquer les données premium et exporter vers Excel ![]() .
.
| Titre | Type | Prix moyen de l'action | Actions (en millions) |
ΔActions (%) |
ΔActions (%) |
Valeur ($ en millions) |
Portefeuille (%) |
ΔPortefeuille (%) |
|
|---|---|---|---|---|---|---|---|---|---|
| DELL / Dell Technologies Inc. | 0,00 | 0,32 | 2,7526 | 2,7526 | |||||
| TPR / Tapestry, Inc. | 0,00 | 3,82 | 0,31 | 29,46 | 2,6831 | 0,2717 | |||
| WCC / WESCO International, Inc. | 0,00 | 0,30 | 2,6031 | 2,6031 | |||||
| AA / Alcoa Corporation | 0,01 | 0,30 | 2,5646 | 2,5646 | |||||
| FDX / FedEx Corporation | 0,00 | 28,59 | 0,30 | 19,92 | 2,5342 | 0,0747 | |||
| FNF / Fidelity National Financial, Inc. | 0,01 | 31,17 | 0,29 | 13,13 | 2,5168 | -0,0751 | |||
| QCOM / QUALCOMM Incorporated | 0,00 | 0,29 | 2,4939 | 2,4939 | |||||
| OC / Owens Corning | 0,00 | 22,48 | 0,29 | 17,89 | 2,4932 | 0,0332 | |||
| MTDR / Matador Resources Company | 0,01 | 16,54 | 0,28 | 8,85 | 2,4313 | -0,1679 | |||
| TAP / Molson Coors Beverage Company | 0,01 | 35,79 | 0,27 | 7,14 | 2,3206 | -0,1966 | |||
| BBWI / Bath & Body Works, Inc. | 0,01 | 0,27 | 2,2798 | 2,2798 | |||||
| WBD / Warner Bros. Discovery, Inc. | 0,02 | 0,25 | 2,1789 | 2,1789 | |||||
| NRG / NRG Energy, Inc. | 0,00 | -41,26 | 0,25 | -1,57 | 2,1524 | -0,3825 | |||
| ANF / Abercrombie & Fitch Co. | 0,00 | 0,24 | 2,0960 | 2,0960 | |||||
| WEX / WEX Inc. | 0,00 | 0,24 | 2,0873 | 2,0873 | |||||
| PVH / PVH Corp. | 0,00 | 0,24 | 2,0838 | 2,0838 | |||||
| SIRI / Sirius XM Holdings Inc. | 0,01 | 17,99 | 0,24 | 19,80 | 2,0319 | 0,0651 | |||
| CMCSA / Comcast Corporation | 0,01 | 44,91 | 0,24 | 40,48 | 2,0274 | 0,3442 | |||
| FOXA / Fox Corporation | 0,00 | 48,69 | 0,24 | 46,88 | 2,0223 | 0,4239 | |||
| LEA / Lear Corporation | 0,00 | 46,51 | 0,24 | 57,72 | 2,0192 | 0,5297 | |||
| GPN / Global Payments Inc. | 0,00 | 87,93 | 0,23 | 53,95 | 2,0084 | 0,4870 | |||
| NXST / Nexstar Media Group, Inc. | 0,00 | 16,15 | 0,23 | 12,02 | 2,0053 | -0,0765 | |||
| TKR / The Timken Company | 0,00 | 81,13 | 0,23 | 82,54 | 1,9767 | 0,7187 | |||
| OMC / Omnicom Group Inc. | 0,00 | 63,53 | 0,23 | 41,61 | 1,9613 | 0,3529 | |||
| MTCH / Match Group, Inc. | 0,01 | 28,85 | 0,23 | 28,09 | 1,9571 | 0,1719 | |||
| GAP / The Gap, Inc. | 0,01 | 0,23 | 1,9501 | 1,9501 | |||||
| EXPE / Expedia Group, Inc. | 0,00 | 38,37 | 0,23 | 38,65 | 1,9456 | 0,3151 | |||
| CROX / Crocs, Inc. | 0,00 | 0,23 | 1,9404 | 1,9404 | |||||
| PR / Permian Resources Corporation | 0,02 | 43,71 | 0,22 | 41,67 | 1,9006 | 0,3356 | |||
| IPG / The Interpublic Group of Companies, Inc. | 0,01 | 82,34 | 0,22 | 64,18 | 1,8926 | 0,5526 | |||
| SLB / Schlumberger Limited | 0,01 | 85,44 | 0,22 | 50,34 | 1,8748 | 0,4199 | |||
| OVV / Ovintiv Inc. | 0,01 | 0,22 | 1,8717 | 1,8717 | |||||
| APA / APA Corporation | 0,01 | 41,60 | 0,22 | 23,30 | 1,8639 | 0,1035 | |||
| NOV / NOV Inc. | 0,02 | 24,83 | 0,22 | 1,89 | 1,8579 | -0,2627 | |||
| FAF / First American Financial Corporation | 0,00 | 62,55 | 0,22 | 52,48 | 1,8511 | 0,4345 | |||
| US8252528851 / Invesco Government & Agency Portfolio, Institutional Class | 0,21 | 101,78 | 0,21 | 100,94 | 1,8345 | 0,7766 | |||
| BBY / Best Buy Co., Inc. | 0,00 | 0,21 | 1,8255 | 1,8255 | |||||
| VFC / V.F. Corporation | 0,02 | 0,21 | 1,8129 | 1,8129 | |||||
| MGY / Magnolia Oil & Gas Corporation | 0,01 | 50,42 | 0,20 | 33,77 | 1,7364 | 0,2270 | |||
| HAL / Halliburton Company | 0,01 | 71,70 | 0,20 | 38,73 | 1,6913 | 0,2644 | |||
| VNT / Vontier Corporation | 0,01 | 45,51 | 0,19 | 63,56 | 1,6604 | 0,4783 | |||
| OSK / Oshkosh Corporation | 0,00 | 23,06 | 0,19 | 48,44 | 1,6368 | 0,3543 | |||
| ALSN / Allison Transmission Holdings, Inc. | 0,00 | 55,84 | 0,19 | 55,74 | 1,6301 | 0,4042 | |||
| NTAP / NetApp, Inc. | 0,00 | 28,67 | 0,19 | 56,78 | 1,5872 | 0,4038 | |||
| CBT / Cabot Corporation | 0,00 | 81,39 | 0,18 | 63,89 | 1,5237 | 0,4402 | |||
| SEE / Sealed Air Corporation | 0,01 | 53,24 | 0,18 | 65,09 | 1,5059 | 0,4409 | |||
| VLO / Valero Energy Corporation | 0,00 | 10,88 | 0,18 | 12,90 | 1,5044 | -0,0469 | |||
| GNTX / Gentex Corporation | 0,01 | 76,61 | 0,17 | 66,67 | 1,4212 | 0,4290 | |||
| EOG / EOG Resources, Inc. | 0,00 | 59,66 | 0,16 | 49,52 | 1,3478 | 0,2946 | |||
| ZBH / Zimmer Biomet Holdings, Inc. | 0,00 | 53,36 | 0,15 | 24,19 | 1,3219 | 0,0773 | |||
| LDOS / Leidos Holdings, Inc. | 0,00 | -100,00 | 0,00 | -100,00 | -1,1688 | ||||
| CF / CF Industries Holdings, Inc. | 0,00 | -100,00 | 0,00 | -100,00 | -2,4699 | ||||
| ENS / EnerSys | 0,00 | -100,00 | 0,00 | -100,00 | -1,0683 | ||||
| VZ / Verizon Communications Inc. | 0,00 | -100,00 | 0,00 | -100,00 | -1,2466 | ||||
| UHS / Universal Health Services, Inc. | 0,00 | -100,00 | 0,00 | -100,00 | -1,3426 | ||||
| HPE / Hewlett Packard Enterprise Company | 0,00 | -100,00 | 0,00 | -100,00 | -1,3408 | ||||
| THO / THOR Industries, Inc. | 0,00 | -100,00 | 0,00 | -100,00 | -2,3740 | ||||
| BC / Brunswick Corporation | 0,00 | -100,00 | 0,00 | -100,00 | -2,3392 | ||||
| BERY / Berry Global Group, Inc. | 0,00 | -100,00 | 0,00 | -100,00 | -1,0498 | ||||
| EME / EMCOR Group, Inc. | 0,00 | -100,00 | 0,00 | -100,00 | -0,9738 | ||||
| OGN / Organon & Co. | 0,00 | -100,00 | 0,00 | -100,00 | -1,9502 | ||||
| AYI / Acuity Inc. | 0,00 | -100,00 | 0,00 | -100,00 | -1,0591 | ||||
| VST / Vistra Corp. | 0,00 | -100,00 | 0,00 | -100,00 | -2,3662 | ||||
| MUR / Murphy Oil Corporation | 0,00 | -100,00 | 0,00 | -100,00 | -1,6115 | ||||
| HCA / HCA Healthcare, Inc. | 0,00 | -100,00 | 0,00 | -100,00 | -2,7138 | ||||
| Halliburton Co / DE (N/A) | -0,00 | -0,0006 | -0,0006 | ||||||
| EOG Resources Inc / DE (N/A) | -0,00 | -0,0006 | -0,0006 | ||||||
| Schlumberger NV / DE (N/A) | -0,00 | -0,0009 | -0,0009 | ||||||
| FedEx Corp / DE (N/A) | -0,00 | -0,0011 | -0,0011 | ||||||
| Zimmer Biomet Holdings Inc / DE (N/A) | -0,00 | -0,0012 | -0,0012 | ||||||
| Permian Resources Corp / DE (N/A) | -0,00 | -0,0014 | -0,0014 | ||||||
| Ovintiv Inc / DE (N/A) | -0,00 | -0,0015 | -0,0015 | ||||||
| Matador Resources Co / DE (N/A) | -0,00 | -0,0015 | -0,0015 | ||||||
| Match Group Inc / DE (N/A) | -0,00 | -0,0017 | -0,0017 | ||||||
| Valero Energy Corp / DE (N/A) | -0,00 | -0,0018 | -0,0018 | ||||||
| Halliburton Co / DE (N/A) | -0,00 | -0,0020 | -0,0020 | ||||||
| Valero Energy Corp / DE (N/A) | -0,00 | -0,0022 | -0,0022 | ||||||
| NetApp Inc / DE (N/A) | -0,00 | -0,0023 | -0,0023 | ||||||
| APA Corp / DE (N/A) | -0,00 | -0,0023 | -0,0023 | ||||||
| Interpublic Group of Cos Inc/The / DE (N/A) | -0,00 | -0,0023 | -0,0023 | ||||||
| EOG Resources Inc / DE (N/A) | -0,00 | -0,0028 | -0,0028 | ||||||
| Fidelity National Financial Inc / DE (N/A) | -0,00 | -0,0032 | -0,0032 | ||||||
| Comcast Corp / DE (N/A) | -0,00 | -0,0034 | -0,0034 | ||||||
| NetApp Inc / DE (N/A) | -0,00 | -0,0034 | -0,0034 | ||||||
| Match Group Inc / DE (N/A) | -0,00 | -0,0037 | -0,0037 | ||||||
| Zimmer Biomet Holdings Inc / DE (N/A) | -0,00 | -0,0038 | -0,0038 | ||||||
| Allison Transmission Holdings Inc / DE (N/A) | -0,00 | -0,0041 | -0,0041 | ||||||
| Schlumberger NV / DE (N/A) | -0,00 | -0,0041 | -0,0041 | ||||||
| Tapestry Inc / DE (N/A) | -0,00 | -0,0047 | -0,0047 | ||||||
| Expedia Group Inc / DE (N/A) | -0,00 | -0,0047 | -0,0047 | ||||||
| Nexstar Media Group Inc / DE (N/A) | -0,00 | -0,0051 | -0,0051 | ||||||
| Best Buy Co Inc / DE (N/A) | -0,00 | -0,0053 | -0,0053 | ||||||
| Permian Resources Corp / DE (N/A) | -0,00 | -0,0055 | -0,0055 | ||||||
| WESCO International Inc / DE (N/A) | -0,00 | -0,0057 | -0,0057 | ||||||
| Omnicom Group Inc / DE (N/A) | -0,00 | -0,0057 | -0,0057 | ||||||
| NOV Inc / DE (N/A) | -0,00 | -0,0060 | -0,0060 | ||||||
| Fox Corp / DE (N/A) | -0,00 | -0,0063 | -0,0063 | ||||||
| Sealed Air Corp / DE (N/A) | -0,00 | -0,0068 | -0,0068 | ||||||
| Matador Resources Co / DE (N/A) | -0,00 | -0,0069 | -0,0069 | ||||||
| Comcast Corp / DE (N/A) | -0,00 | -0,0072 | -0,0072 | ||||||
| Tapestry Inc / DE (N/A) | -0,00 | -0,0075 | -0,0075 | ||||||
| Sirius XM Holdings Inc / DE (N/A) | -0,00 | -0,0079 | -0,0079 | ||||||
| Nexstar Media Group Inc / DE (N/A) | -0,00 | -0,0085 | -0,0085 | ||||||
| Omnicom Group Inc / DE (N/A) | -0,00 | -0,0087 | -0,0087 | ||||||
| APA Corp / DE (N/A) | -0,00 | -0,0089 | -0,0089 | ||||||
| FedEx Corp / DE (N/A) | -0,00 | -0,0089 | -0,0089 | ||||||
| Allison Transmission Holdings Inc / DE (N/A) | -0,00 | -0,0095 | -0,0095 | ||||||
| Best Buy Co Inc / DE (N/A) | -0,00 | -0,0096 | -0,0096 | ||||||
| Vontier Corp / DE (N/A) | -0,00 | -0,0099 | -0,0099 | ||||||
| Bath & Body Works Inc / DE (N/A) | -0,00 | -0,0105 | -0,0105 | ||||||
| Interpublic Group of Cos Inc/The / DE (N/A) | -0,00 | -0,0108 | -0,0108 | ||||||
| Sirius XM Holdings Inc / DE (N/A) | -0,00 | -0,0110 | -0,0110 | ||||||
| NOV Inc / DE (N/A) | -0,00 | -0,0114 | -0,0114 | ||||||
| Molson Coors Beverage Co / DE (N/A) | -0,00 | -0,0116 | -0,0116 | ||||||
| Dell Technologies Inc / DE (N/A) | -0,00 | -0,0122 | -0,0122 | ||||||
| Expedia Group Inc / DE (N/A) | -0,00 | -0,0122 | -0,0122 | ||||||
| Magnolia Oil & Gas Corp / DE (N/A) | -0,00 | -0,0123 | -0,0123 | ||||||
| VF Corp / DE (N/A) | -0,00 | -0,0123 | -0,0123 | ||||||
| Gentex Corp / DE (N/A) | -0,00 | -0,0125 | -0,0125 | ||||||
| Abercrombie & Fitch Co / DE (N/A) | -0,00 | -0,0131 | -0,0131 | ||||||
| Ovintiv Inc / DE (N/A) | -0,00 | -0,0135 | -0,0135 | ||||||
| Lear Corp / DE (N/A) | -0,00 | -0,0137 | -0,0137 | ||||||
| Alcoa Corp / DE (N/A) | -0,00 | -0,0139 | -0,0139 | ||||||
| Cabot Corp / DE (N/A) | -0,00 | -0,0147 | -0,0147 | ||||||
| Timken Co/The / DE (N/A) | -0,00 | -0,0154 | -0,0154 | ||||||
| Timken Co/The / DE (N/A) | -0,00 | -0,0165 | -0,0165 | ||||||
| Dell Technologies Inc / DE (N/A) | -0,00 | -0,0177 | -0,0177 | ||||||
| Gap Inc/The / DE (N/A) | -0,00 | -0,0187 | -0,0187 | ||||||
| WESCO International Inc / DE (N/A) | -0,00 | -0,0192 | -0,0192 | ||||||
| Alcoa Corp / DE (N/A) | -0,00 | -0,0209 | -0,0209 | ||||||
| QUALCOMM Inc / DE (N/A) | -0,00 | -0,0225 | -0,0225 | ||||||
| Owens Corning / DE (N/A) | -0,00 | -0,0226 | -0,0226 | ||||||
| NRG Energy Inc / DE (N/A) | -0,00 | -0,0229 | -0,0229 | ||||||
| Genpact Ltd / DE (N/A) | -0,00 | -0,0239 | -0,0239 | ||||||
| Genpact Ltd / DE (N/A) | 0,01 | -0,00 | -0,0239 | -0,0239 | |||||
| Bath & Body Works Inc / DE (N/A) | -0,00 | -0,0256 | -0,0256 | ||||||
| Warner Bros Discovery Inc / DE (N/A) | -0,00 | -0,0332 | -0,0332 | ||||||
| Crocs Inc / DE (N/A) | -0,00 | -0,0343 | -0,0343 | ||||||
| Oshkosh Corp / DE (N/A) | -0,00 | -0,0362 | -0,0362 | ||||||
| WEX Inc / DE (N/A) | -0,00 | -0,0369 | -0,0369 | ||||||
| Global Payments Inc / DE (N/A) | -0,01 | -0,0459 | -0,0459 | ||||||
| Abercrombie & Fitch Co / DE (N/A) | -0,01 | -0,0489 | -0,0489 | ||||||
| PVH Corp / DE (N/A) | -0,01 | -0,0531 | -0,0531 | ||||||
| First American Financial Corp / DE (N/A) | -0,01 | -0,0612 | -0,0612 |