Statistiques de base
| Valeur du portefeuille | $ 1 244 166 823 |
| Positions actuelles | 143 |
Dernières positions, performances, ASG (à partir des dépôts 13F, 13D)
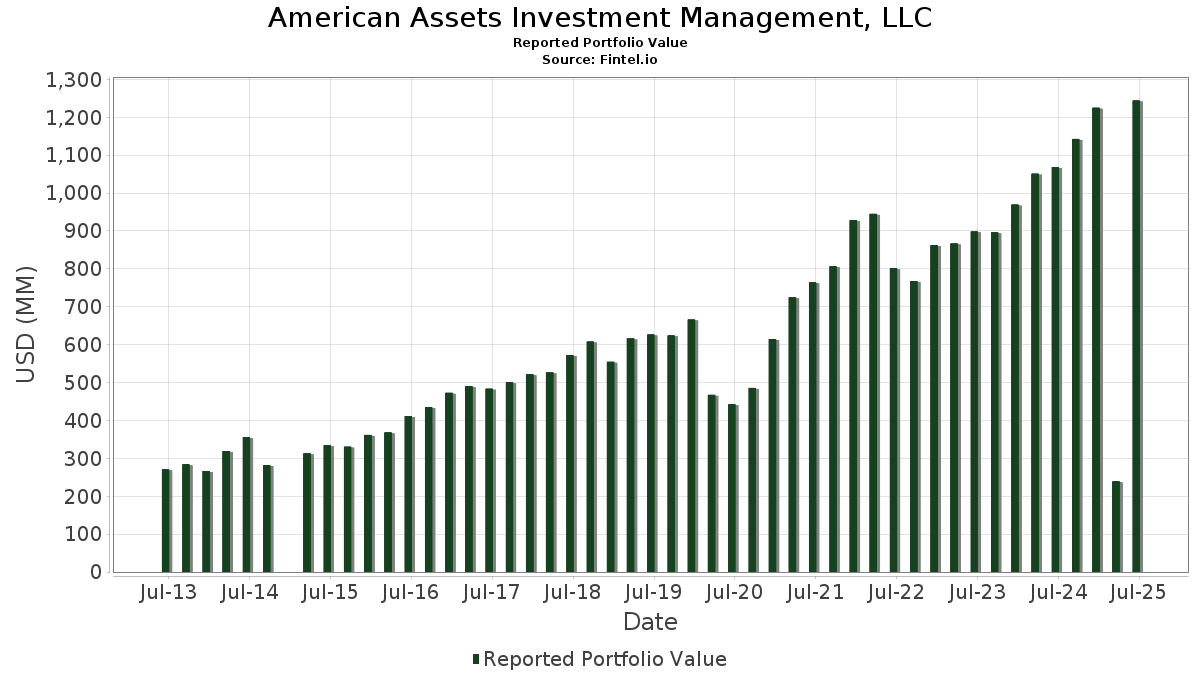
American Assets Investment Management, LLC a déclaré un total de 143 positions dans ses derniers dépôts auprès de la SEC. La valeur la plus récente du portefeuille est calculée à 1 244 166 823 USD. Les actifs sous gestion réels (ASG) sont cette valeur plus les liquidités (qui ne sont pas divulguées). Les principales positions de American Assets Investment Management, LLC sont Wells Fargo & Company (US:WFC) , Bank of America Corporation (US:BAC) , JPMorgan Chase & Co. (US:JPM) , Microsoft Corporation (US:MSFT) , and Rigetti Computing, Inc. (US:RGTI) . Les nouvelles positions de American Assets Investment Management, LLC incluent McDonald's Corporation (US:MCD) , . Les principales industries de American Assets Investment Management, LLC sont "General Merchandise Stores" (sic 53) , "Educational Services" (sic 82) , and "Amusement And Recreation Services" (sic 79) .
Meilleures augmentations ce trimestre
Nous utilisons la variation de l'allocation du portefeuille car il s'agit de l'indicateur le plus significatif. Les changements peuvent être dus à des transactions ou à des variations de prix des actions.
| Titre | Actions (en millions) |
Valeur ($ en millions) |
% du portefeuille | ΔPortefeuille % |
|---|---|---|---|---|
| 0,94 | 75,34 | 6,0558 | 2,5698 | |
| 3,75 | 44,43 | 3,5710 | 0,9751 | |
| 0,09 | 44,59 | 3,5842 | 0,6397 | |
| 0,05 | 38,22 | 3,0718 | 0,4908 | |
| 0,18 | 51,49 | 4,1384 | 0,3267 | |
| 0,03 | 10,76 | 0,8647 | 0,2767 | |
| 0,05 | 8,53 | 0,6859 | 0,2421 | |
| 0,06 | 13,59 | 1,0922 | 0,2208 | |
| 0,01 | 6,95 | 0,5582 | 0,2076 | |
| 0,29 | 20,14 | 1,6185 | 0,2016 |
Principales baisses ce trimestre
Nous utilisons la variation de l'allocation du portefeuille car il s'agit de l'indicateur le plus significatif. Les changements peuvent être dus à des transactions ou à des variations de prix des actions.
| Titre | Actions (en millions) |
Valeur ($ en millions) |
% du portefeuille | ΔPortefeuille % |
|---|---|---|---|---|
| 0,00 | 0,00 | -8,1025 | ||
| 0,00 | 0,00 | -1,7881 | ||
| 0,00 | 0,00 | -1,7373 | ||
| 0,00 | 0,00 | -1,7270 | ||
| 0,41 | 44,20 | 3,5524 | -1,1301 | |
| 0,21 | 43,09 | 3,4630 | -0,6183 | |
| 0,00 | 0,00 | -0,5797 | ||
| 0,18 | 25,77 | 2,0716 | -0,5630 | |
| 0,00 | 0,00 | -0,3160 | ||
| 1,48 | 29,14 | 2,3420 | -0,2578 |
Déclarations 13D/G
Il s'agit d'une liste des déclarations 13D et 13G déposées au cours de la dernière année (le cas échéant). Cliquez sur l'icône du lien pour voir l'historique complet des transactions. Les lignes vertes indiquent de nouvelles positions. Les lignes rouges indiquent des positions fermées.
| Date de dépôt | Formulaire | Titre | Actions précédentes |
Actions actuelles |
ΔActions % | % de participation |
% ΔParticipation | |
|---|---|---|---|---|---|---|---|---|
| 2025-02-13 | RGTI / Rigetti Computing, Inc. | 8 789 169 | 7 221 216 | -17,84 | 2,60 | -56,67 |
Déclarations 13F et dépôts de fonds
Ce formulaire a été déposé le 2025-08-05 pour la période de déclaration 2025-06-30. Cliquez sur l'icône du lien pour voir l'historique complet des transactions.
Mettre à niveau pour débloquer les données premium et exporter vers Excel ![]() .
.
| Titre | Type | Prix moyen de l'action | Actions (en millions) |
ΔActions (%) |
ΔActions (%) |
Valeur ($ en millions) |
Portefeuille (%) |
ΔPortefeuille (%) |
|
|---|---|---|---|---|---|---|---|---|---|
| WFC / Wells Fargo & Company | 0,94 | 69,44 | 75,34 | 89,10 | 6,0558 | 2,5698 | |||
| BAC / Bank of America Corporation | 1,13 | 0,00 | 53,42 | 13,39 | 4,2938 | 0,1719 | |||
| JPM / JPMorgan Chase & Co. | 0,18 | 0,00 | 51,49 | 18,19 | 4,1384 | 0,3267 | |||
| MSFT / Microsoft Corporation | 0,09 | 0,00 | 44,59 | 32,51 | 3,5842 | 0,6397 | |||
| RGTI / Rigetti Computing, Inc. | 3,75 | 0,00 | 44,43 | 49,75 | 3,5710 | 0,9751 | |||
| XOM / Exxon Mobil Corporation | 0,41 | -8,89 | 44,20 | -17,41 | 3,5524 | -1,1301 | |||
| AAPL / Apple Inc. | 0,21 | 0,00 | 43,09 | -7,64 | 3,4630 | -0,6183 | |||
| GS / The Goldman Sachs Group, Inc. | 0,05 | 0,00 | 38,22 | 29,56 | 3,0718 | 0,4908 | |||
| AAT / American Assets Trust, Inc. | 1,48 | 0,00 | 29,14 | -1,94 | 2,3420 | -0,2578 | |||
| CVX / Chevron Corporation | 0,18 | 0,00 | 25,77 | -14,41 | 2,0716 | -0,5630 | |||
| COF / Capital One Financial Corporation | 0,10 | 0,00 | 21,17 | 18,66 | 1,7015 | 0,1406 | |||
| SHEL / Shell plc - Depositary Receipt (Common Stock) | 0,29 | 29,41 | 20,14 | 24,35 | 1,6185 | 0,2016 | |||
| CAT / Caterpillar Inc. | 0,04 | 0,00 | 17,47 | 17,71 | 1,4041 | 0,1056 | |||
| ESS / Essex Property Trust, Inc. | 0,06 | 0,00 | 16,86 | -7,55 | 1,3553 | -0,2407 | |||
| TFC / Truist Financial Corporation | 0,38 | 0,00 | 16,51 | 4,47 | 1,3268 | -0,0557 | |||
| IBM / International Business Machines Corporation | 0,06 | 0,00 | 16,21 | 18,54 | 1,3031 | 0,1065 | |||
| WMT / Walmart Inc. | 0,16 | 0,00 | 15,84 | 11,38 | 1,2732 | 0,0288 | |||
| PSX / Phillips 66 | 0,13 | 0,00 | 15,60 | -3,39 | 1,2542 | -0,1589 | |||
| KR / The Kroger Co. | 0,21 | 0,00 | 14,79 | 5,97 | 1,1885 | -0,0324 | |||
| RY / Royal Bank of Canada | 0,10 | 0,00 | 13,62 | 16,71 | 1,0943 | 0,0736 | |||
| TSM / Taiwan Semiconductor Manufacturing Company Limited - Depositary Receipt (Common Stock) | 0,06 | 0,00 | 13,59 | 36,44 | 1,0922 | 0,2208 | |||
| VGSH / Vanguard Scottsdale Funds - Vanguard Short-Term Treasury ETF | 0,23 | 1,36 | 13,57 | 1,52 | 1,0907 | -0,0789 | |||
| GE / General Electric Company | 0,05 | 0,00 | 13,51 | 28,60 | 1,0861 | 0,1667 | |||
| C / Citigroup Inc. | 0,16 | 0,00 | 13,31 | 19,91 | 1,0700 | 0,0986 | |||
| MS / Morgan Stanley | 0,09 | 0,00 | 12,96 | 20,74 | 1,0416 | 0,1025 | |||
| USB / U.S. Bancorp | 0,27 | 0,00 | 12,22 | 7,18 | 0,9820 | -0,0154 | |||
| TD / The Toronto-Dominion Bank | 0,17 | 0,00 | 12,12 | 22,54 | 0,9741 | 0,1088 | |||
| NVS / Novartis AG - Depositary Receipt (Common Stock) | 0,09 | 0,00 | 11,33 | 8,55 | 0,9105 | -0,0026 | |||
| ABBV / AbbVie Inc. | 0,06 | 0,00 | 11,19 | -11,41 | 0,8995 | -0,2057 | |||
| PNC / The PNC Financial Services Group, Inc. | 0,06 | 0,00 | 11,19 | 6,06 | 0,8990 | -0,0237 | |||
| CEG / Constellation Energy Corporation | 0,03 | 0,00 | 10,76 | 60,09 | 0,8647 | 0,2767 | |||
| BMO / Bank of Montreal | 0,10 | 0,00 | 10,62 | 15,84 | 0,8536 | 0,0514 | |||
| KO / The Coca-Cola Company | 0,15 | 0,00 | 10,62 | -1,22 | 0,8533 | -0,0870 | |||
| BK / The Bank of New York Mellon Corporation | 0,12 | 0,00 | 10,48 | 8,63 | 0,8421 | -0,0017 | |||
| UL / Unilever PLC - Depositary Receipt (Common Stock) | 0,17 | 0,00 | 10,40 | 2,72 | 0,8358 | -0,0499 | |||
| DE / Deere & Company | 0,02 | 0,00 | 10,17 | 8,33 | 0,8174 | -0,0039 | |||
| HSBC / HSBC Holdings plc - Depositary Receipt (Common Stock) | 0,17 | 0,00 | 10,15 | 5,84 | 0,8156 | -0,0232 | |||
| MRK / Merck & Co., Inc. | 0,12 | 0,00 | 9,89 | -11,81 | 0,7953 | -0,1864 | |||
| AMGN / Amgen Inc. | 0,04 | 0,00 | 9,83 | -10,38 | 0,7897 | -0,1695 | |||
| LEN / Lennar Corporation | 0,09 | 0,00 | 9,55 | -3,63 | 0,7679 | -0,0995 | |||
| LLY / Eli Lilly and Company | 0,01 | 0,00 | 9,35 | -5,61 | 0,7519 | -0,1153 | |||
| TTE / TotalEnergies SE - Depositary Receipt (Common Stock) | 0,15 | 0,00 | 9,21 | -5,10 | 0,7401 | -0,1089 | |||
| STT / State Street Corporation | 0,09 | 0,00 | 9,04 | 18,76 | 0,7265 | 0,0607 | |||
| PRU / Prudential Financial, Inc. | 0,08 | 0,00 | 8,64 | -3,80 | 0,6948 | -0,0914 | |||
| GOOGL / Alphabet Inc. | 0,05 | 0,00 | 8,64 | 13,96 | 0,6941 | 0,0311 | |||
| NRG / NRG Energy, Inc. | 0,05 | 0,00 | 8,53 | 68,22 | 0,6859 | 0,2421 | |||
| MET / MetLife, Inc. | 0,10 | 0,00 | 8,31 | 0,16 | 0,6677 | -0,0580 | |||
| FDX / FedEx Corporation | 0,04 | 0,00 | 7,96 | -6,76 | 0,6395 | -0,1071 | |||
| SCHW / The Charles Schwab Corporation | 0,09 | 0,00 | 7,91 | 16,57 | 0,6356 | 0,0420 | |||
| JNJ / Johnson & Johnson | 0,05 | 0,00 | 7,64 | -7,90 | 0,6139 | -0,1116 | |||
| NTRS / Northern Trust Corporation | 0,06 | 0,00 | 7,61 | 28,52 | 0,6114 | 0,0936 | |||
| NOC / Northrop Grumman Corporation | 0,01 | 0,00 | 7,50 | -2,36 | 0,6028 | -0,0692 | |||
| PNW / Pinnacle West Capital Corporation | 0,08 | 0,00 | 7,43 | -6,06 | 0,5969 | -0,0948 | |||
| CB / Chubb Limited | 0,03 | 0,00 | 7,24 | -4,05 | 0,5822 | -0,0784 | |||
| SRE / Sempra | 0,09 | 0,00 | 6,97 | 6,17 | 0,5603 | -0,0141 | |||
| GEV / GE Vernova Inc. | 0,01 | 0,00 | 6,95 | 73,36 | 0,5582 | 0,2076 | |||
| EQR / Equity Residential | 0,10 | 0,00 | 6,75 | -5,71 | 0,5425 | -0,0838 | |||
| COP / ConocoPhillips | 0,07 | 0,00 | 6,28 | -14,56 | 0,5049 | -0,1383 | |||
| MDT / Medtronic plc | 0,07 | 0,00 | 6,24 | -2,98 | 0,5019 | -0,0613 | |||
| AEP / American Electric Power Company, Inc. | 0,06 | 0,00 | 6,23 | -5,05 | 0,5004 | -0,0732 | |||
| HLT / Hilton Worldwide Holdings Inc. | 0,02 | 0,00 | 6,21 | 17,05 | 0,4995 | 0,0350 | |||
| VZ / Verizon Communications Inc. | 0,14 | 0,00 | 6,06 | -4,61 | 0,4869 | -0,0687 | |||
| AMP / Ameriprise Financial, Inc. | 0,01 | 0,00 | 6,00 | 10,25 | 0,4826 | 0,0061 | |||
| BMY / Bristol-Myers Squibb Company | 0,13 | 0,00 | 5,88 | -24,11 | 0,4725 | -0,2052 | |||
| DGX / Quest Diagnostics Incorporated | 0,03 | 0,00 | 5,75 | 6,17 | 0,4620 | -0,0117 | |||
| MCHP / Microchip Technology Incorporated | 0,08 | 0,00 | 5,63 | 45,38 | 0,4525 | 0,1136 | |||
| BNS / The Bank of Nova Scotia | 0,10 | 0,00 | 5,53 | 16,53 | 0,4442 | 0,0293 | |||
| JEF / Jefferies Financial Group Inc. | 0,10 | 0,00 | 5,47 | 2,09 | 0,4396 | -0,0291 | |||
| URI / United Rentals, Inc. | 0,01 | 0,00 | 5,27 | 20,22 | 0,4239 | 0,0401 | |||
| PEP / PepsiCo, Inc. | 0,04 | 0,00 | 5,26 | -11,93 | 0,4224 | -0,0997 | |||
| WEC / WEC Energy Group, Inc. | 0,05 | 0,00 | 5,21 | -4,39 | 0,4188 | -0,0580 | |||
| TM / Toyota Motor Corporation - Depositary Receipt (Common Stock) | 0,03 | 0,00 | 5,17 | -2,42 | 0,4154 | -0,0480 | |||
| EIX / Edison International | 0,10 | 0,00 | 5,16 | -12,42 | 0,4147 | -0,1008 | |||
| PPG / PPG Industries, Inc. | 0,05 | 0,00 | 5,15 | 4,02 | 0,4137 | -0,0192 | |||
| XEL / Xcel Energy Inc. | 0,07 | 0,00 | 4,77 | -3,79 | 0,3831 | -0,0504 | |||
| LH / Labcorp Holdings Inc. | 0,02 | 0,00 | 4,73 | 12,80 | 0,3798 | 0,0132 | |||
| ALLY / Ally Financial Inc. | 0,12 | 0,00 | 4,48 | 6,80 | 0,3600 | -0,0069 | |||
| RTX / RTX Corporation | 0,03 | 0,00 | 4,38 | 10,24 | 0,3521 | 0,0044 | |||
| EXC / Exelon Corporation | 0,10 | 0,00 | 4,34 | -5,77 | 0,3490 | -0,0542 | |||
| AIG / American International Group, Inc. | 0,05 | 0,00 | 4,28 | -1,56 | 0,3440 | -0,0364 | |||
| AMD / Advanced Micro Devices, Inc. | 0,03 | 0,00 | 4,26 | 38,12 | 0,3422 | 0,0725 | |||
| ABT / Abbott Laboratories | 0,03 | 0,00 | 4,15 | 2,55 | 0,3334 | -0,0206 | |||
| MDLZ / Mondelez International, Inc. | 0,06 | 0,00 | 4,11 | -0,60 | 0,3307 | -0,0315 | |||
| ET / Energy Transfer LP - Limited Partnership | 0,23 | 0,00 | 4,09 | -2,48 | 0,3290 | -0,0382 | |||
| CAH / Cardinal Health, Inc. | 0,02 | 0,00 | 3,91 | 21,96 | 0,3143 | 0,0337 | |||
| SNY / Sanofi - Depositary Receipt (Common Stock) | 0,08 | 0,00 | 3,86 | -12,89 | 0,3106 | -0,0776 | |||
| DUK / Duke Energy Corporation | 0,03 | 0,00 | 3,85 | -3,26 | 0,3098 | -0,0388 | |||
| WDC / Western Digital Corporation | 0,06 | 0,00 | 3,84 | 58,31 | 0,3086 | 0,0964 | |||
| DD / DuPont de Nemours, Inc. | 0,05 | 0,00 | 3,70 | -8,17 | 0,2974 | -0,0551 | |||
| KMI / Kinder Morgan, Inc. | 0,12 | 0,00 | 3,67 | 3,06 | 0,2954 | -0,0166 | |||
| PM / Philip Morris International Inc. | 0,02 | 0,00 | 3,64 | 14,74 | 0,2928 | 0,0150 | |||
| SYK / Stryker Corporation | 0,01 | 0,00 | 3,56 | 6,27 | 0,2862 | -0,0069 | |||
| NEE / NextEra Energy, Inc. | 0,05 | 0,00 | 3,47 | -2,06 | 0,2790 | -0,0311 | |||
| IWM / iShares Trust - iShares Russell 2000 ETF | 0,02 | 0,00 | 3,45 | 8,18 | 0,2775 | -0,0018 | |||
| UNP / Union Pacific Corporation | 0,01 | 0,00 | 3,45 | -2,60 | 0,2774 | -0,0327 | |||
| HCA / HCA Healthcare, Inc. | 0,01 | 0,00 | 3,45 | 10,87 | 0,2771 | 0,0050 | |||
| CI / The Cigna Group | 0,01 | 0,00 | 3,32 | 0,48 | 0,2668 | -0,0222 | |||
| UTHR / United Therapeutics Corporation | 0,01 | 0,00 | 2,87 | -6,78 | 0,2310 | -0,0388 | |||
| FE / FirstEnergy Corp. | 0,07 | 0,00 | 2,82 | -0,39 | 0,2265 | -0,0210 | |||
| XLU / The Select Sector SPDR Trust - The Utilities Select Sector SPDR Fund | 0,03 | 0,00 | 2,78 | 3,58 | 0,2232 | -0,0114 | |||
| JCI / Johnson Controls International plc | 0,03 | 0,00 | 2,77 | 31,89 | 0,2224 | 0,0388 | |||
| BABA / Alibaba Group Holding Limited - Depositary Receipt (Common Stock) | 0,02 | 0,00 | 2,72 | -14,25 | 0,2188 | -0,0589 | |||
| PG / The Procter & Gamble Company | 0,02 | 0,00 | 2,71 | -6,52 | 0,2177 | -0,0358 | |||
| GILD / Gilead Sciences, Inc. | 0,02 | 0,00 | 2,55 | -1,05 | 0,2050 | -0,0205 | |||
| PPL / PPL Corporation | 0,07 | 0,00 | 2,37 | -6,13 | 0,1907 | -0,0305 | |||
| PFE / Pfizer Inc. | 0,10 | 0,00 | 2,33 | -4,32 | 0,1870 | -0,0258 | |||
| SO / The Southern Company | 0,03 | 0,00 | 2,30 | -0,13 | 0,1845 | -0,0166 | |||
| AA / Alcoa Corporation | 0,07 | 0,00 | 2,21 | -3,24 | 0,1779 | -0,0223 | |||
| ACI / Albertsons Companies, Inc. | 0,10 | 0,00 | 2,15 | -2,18 | 0,1729 | -0,0195 | |||
| CMCSA / Comcast Corporation | 0,06 | 0,00 | 2,14 | -3,30 | 0,1721 | -0,0216 | |||
| CM / Canadian Imperial Bank of Commerce | 0,03 | 0,00 | 2,12 | 25,75 | 0,1708 | 0,0230 | |||
| KVUE / Kenvue Inc. | 0,10 | 0,00 | 2,09 | -12,72 | 0,1682 | -0,0416 | |||
| MSGS / Madison Square Garden Sports Corp. | 0,01 | 0,00 | 2,09 | 7,29 | 0,1679 | -0,0024 | |||
| WYNN / Wynn Resorts, Limited | 0,02 | 0,00 | 1,87 | 12,16 | 0,1506 | 0,0045 | |||
| DOW / Dow Inc. | 0,07 | 0,00 | 1,83 | -24,18 | 0,1469 | -0,0640 | |||
| WY / Weyerhaeuser Company | 0,07 | 0,00 | 1,80 | -12,25 | 0,1445 | -0,0348 | |||
| BAX / Baxter International Inc. | 0,06 | 0,00 | 1,75 | -11,52 | 0,1407 | -0,0325 | |||
| ALC / Alcon Inc. | 0,02 | 0,00 | 1,65 | -7,03 | 0,1328 | -0,0227 | |||
| ADM / Archer-Daniels-Midland Company | 0,03 | 0,00 | 1,63 | 9,93 | 0,1308 | 0,0013 | |||
| REGN / Regeneron Pharmaceuticals, Inc. | 0,00 | 0,00 | 1,57 | -17,19 | 0,1266 | -0,0399 | |||
| EPD / Enterprise Products Partners L.P. - Limited Partnership | 0,05 | 0,00 | 1,55 | -9,20 | 0,1246 | -0,0247 | |||
| WELL / Welltower Inc. | 0,01 | 0,00 | 1,54 | 0,33 | 0,1236 | -0,0105 | |||
| GSK / GSK plc - Depositary Receipt (Common Stock) | 0,04 | 0,00 | 1,54 | -0,84 | 0,1235 | -0,0121 | |||
| UPS / United Parcel Service, Inc. | 0,01 | 0,00 | 1,51 | -8,19 | 0,1217 | -0,0227 | |||
| PBI / Pitney Bowes Inc. | 0,13 | 0,00 | 1,34 | 13,86 | 0,1076 | 0,0047 | |||
| GEHC / GE HealthCare Technologies Inc. | 0,02 | 0,00 | 1,30 | -8,22 | 0,1042 | -0,0194 | |||
| MCD / McDonald's Corporation | 0,00 | 1,26 | 0,1009 | 0,1009 | |||||
| TLT / iShares Trust - iShares 20+ Year Treasury Bond ETF | 0,01 | 52,63 | 1,25 | 45,25 | 0,1009 | 0,0252 | |||
| MRP / Millrose Properties, Inc. | 0,04 | 0,00 | 1,24 | 7,52 | 0,1001 | -0,0012 | |||
| CTRA / Coterra Energy Inc. | 0,05 | 0,00 | 1,22 | -12,18 | 0,0979 | -0,0235 | |||
| ADBE / Adobe Inc. | 0,00 | 0,00 | 1,16 | 0,87 | 0,0933 | -0,0074 | |||
| BRK.B / Berkshire Hathaway Inc. | 0,00 | 0,00 | 1,09 | -8,85 | 0,0878 | -0,0170 | |||
| BHF / Brighthouse Financial, Inc. | 0,02 | 0,00 | 1,08 | -7,25 | 0,0864 | -0,0150 | |||
| HLN / Haleon plc - Depositary Receipt (Common Stock) | 0,10 | 0,00 | 1,04 | 0,78 | 0,0833 | -0,0067 | |||
| CTVA / Corteva, Inc. | 0,01 | 0,00 | 1,02 | 18,53 | 0,0817 | 0,0066 | |||
| BDX / Becton, Dickinson and Company | 0,01 | 0,00 | 0,95 | -24,78 | 0,0761 | -0,0341 | |||
| CELH / Celsius Holdings, Inc. | 0,03 | -50,00 | 0,95 | -46,83 | 0,0761 | -0,0797 | |||
| SNDK / Sandisk Corporation | 0,02 | 0,00 | 0,91 | -4,73 | 0,0729 | -0,0104 | |||
| JAZZ / Jazz Pharmaceuticals plc | 0,01 | 0,00 | 0,74 | -14,61 | 0,0597 | -0,0163 | |||
| SNOW / Snowflake Inc. | 0,00 | 0,00 | 0,67 | 53,20 | 0,0540 | 0,0156 | |||
| MDGL / Madrigal Pharmaceuticals, Inc. | 0,00 | -55,56 | 0,55 | -63,09 | 0,0442 | -0,0862 | |||
| GIS / General Mills, Inc. | 0,01 | 0,00 | 0,52 | -13,23 | 0,0416 | -0,0107 | |||
| XYZ / Block, Inc. | 0,01 | 0,00 | 0,34 | 25,09 | 0,0273 | 0,0035 | |||
| BCE / BCE Inc. | 0,00 | -100,00 | 0,00 | 0,0000 | |||||
| VTRS / Viatris Inc. | 0,00 | -100,00 | 0,00 | 0,0000 | |||||
| Z / Zillow Group, Inc. | 0,00 | -100,00 | 0,00 | -100,00 | -0,1958 | ||||
| NLY / Annaly Capital Management, Inc. | 0,00 | -100,00 | 0,00 | -100,00 | -1,7373 | ||||
| AGNC / AGNC Investment Corp. | 0,00 | -100,00 | 0,00 | -100,00 | -1,7270 | ||||
| CSGP / CoStar Group, Inc. | 0,00 | -100,00 | 0,00 | -100,00 | -0,3160 | ||||
| AMT / American Tower Corporation | 0,00 | -100,00 | 0,00 | -100,00 | -8,1025 | ||||
| ARE / Alexandria Real Estate Equities, Inc. | 0,00 | -100,00 | 0,00 | -100,00 | -0,2383 | ||||
| CBRE / CBRE Group, Inc. | 0,00 | -100,00 | 0,00 | -100,00 | -0,5797 | ||||
| INVH / Invitation Homes Inc. | 0,00 | -100,00 | 0,00 | -100,00 | -1,7881 | ||||
| WBD / Warner Bros. Discovery, Inc. | 0,00 | -100,00 | 0,00 | 0,0000 | |||||
| SBUX / Starbucks Corporation | 0,00 | -100,00 | 0,00 | 0,0000 |