Statistiques de base
| Valeur du portefeuille | $ 424 990 |
| Positions actuelles | 107 |
Dernières positions, performances, ASG (à partir des dépôts 13F, 13D)
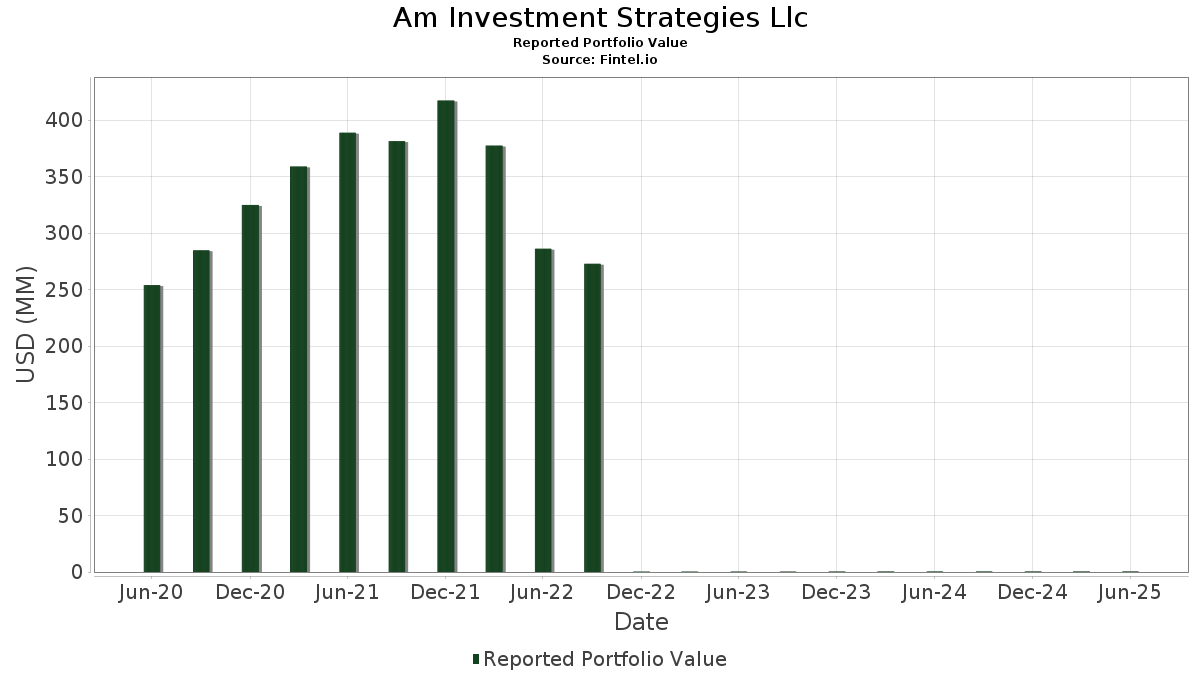
Am Investment Strategies Llc a déclaré un total de 107 positions dans ses derniers dépôts auprès de la SEC. La valeur la plus récente du portefeuille est calculée à 424 990 USD. Les actifs sous gestion réels (ASG) sont cette valeur plus les liquidités (qui ne sont pas divulguées). Les principales positions de Am Investment Strategies Llc sont Apple Inc. (US:AAPL) , Berkshire Hathaway Inc. (US:BRK.B) , Amazon.com, Inc. (US:AMZN) , Meta Platforms, Inc. (US:META) , and Alphabet Inc. (US:GOOG) . Les nouvelles positions de Am Investment Strategies Llc incluent Vertiv Holdings Co (US:VRT) , American Express Company (US:AXP) , .
Meilleures augmentations ce trimestre
Nous utilisons la variation de l'allocation du portefeuille car il s'agit de l'indicateur le plus significatif. Les changements peuvent être dus à des transactions ou à des variations de prix des actions.
| Titre | Actions (en millions) |
Valeur ($ en millions) |
% du portefeuille | ΔPortefeuille % |
|---|---|---|---|---|
| 0,05 | 0,02 | 3,5855 | 1,4242 | |
| 0,01 | 0,01 | 1,7763 | 1,0660 | |
| 0,06 | 0,01 | 2,1838 | 0,8912 | |
| 0,03 | 0,01 | 3,3770 | 0,7804 | |
| 0,06 | 0,02 | 3,5704 | 0,7185 | |
| 0,46 | 0,01 | 3,0438 | 0,6270 | |
| 0,01 | 0,01 | 1,2290 | 0,5017 | |
| 0,09 | 0,02 | 3,7824 | 0,4945 | |
| 0,05 | 0,01 | 1,2151 | 0,4255 | |
| 0,09 | 0,00 | 0,3313 | 0,3313 |
Principales baisses ce trimestre
Nous utilisons la variation de l'allocation du portefeuille car il s'agit de l'indicateur le plus significatif. Les changements peuvent être dus à des transactions ou à des variations de prix des actions.
| Titre | Actions (en millions) |
Valeur ($ en millions) |
% du portefeuille | ΔPortefeuille % |
|---|---|---|---|---|
| 0,30 | 0,06 | 14,4295 | -3,5577 | |
| 0,20 | 0,04 | 10,5748 | -1,3788 | |
| 0,02 | 0,00 | 0,1840 | -1,0897 | |
| 0,01 | 0,00 | 1,0781 | -0,9871 | |
| 0,12 | 0,06 | 14,2620 | -0,8408 | |
| 0,00 | 0,00 | 0,5144 | -0,4543 | |
| 0,12 | 0,00 | 0,8687 | -0,0890 | |
| 0,02 | 0,00 | 0,5122 | -0,0842 | |
| 0,02 | 0,00 | 0,6906 | -0,0793 | |
| 0,01 | 0,00 | 0,5593 | -0,0777 |
Déclarations 13F et dépôts de fonds
Ce formulaire a été déposé le 2025-07-15 pour la période de déclaration 2025-06-30. Cliquez sur l'icône du lien pour voir l'historique complet des transactions.
Mettre à niveau pour débloquer les données premium et exporter vers Excel ![]() .
.
| Titre | Type | Prix moyen de l'action | Actions (en millions) |
ΔActions (%) |
ΔActions (%) |
Valeur ($ en millions) |
Portefeuille (%) |
ΔPortefeuille (%) |
|
|---|---|---|---|---|---|---|---|---|---|
| AAPL / Apple Inc. | 0,30 | -10,43 | 0,06 | -17,57 | 14,4295 | -3,5577 | |||
| BRK.B / Berkshire Hathaway Inc. | 0,12 | 6,77 | 0,06 | -3,23 | 14,2620 | -0,8408 | |||
| AMZN / Amazon.com, Inc. | 0,20 | -20,88 | 0,04 | -10,20 | 10,5748 | -1,3788 | |||
| META / Meta Platforms, Inc. | 0,02 | -16,36 | 0,02 | 6,67 | 3,7841 | 0,1404 | |||
| GOOG / Alphabet Inc. | 0,09 | 4,48 | 0,02 | 23,08 | 3,7824 | 0,4945 | |||
| TSLA / Tesla, Inc. | 0,05 | 39,58 | 0,02 | 87,50 | 3,5855 | 1,4242 | |||
| GE / General Electric Company | 0,06 | 0,40 | 0,02 | 36,36 | 3,5704 | 0,7185 | |||
| MSFT / Microsoft Corporation | 0,03 | 1,23 | 0,01 | 40,00 | 3,3770 | 0,7804 | |||
| SRAD / Sportradar Group AG | 0,46 | 886,70 | 0,01 | 33,33 | 3,0438 | 0,6270 | |||
| USB / U.S. Bancorp | 0,23 | -0,24 | 0,01 | 11,11 | 2,4535 | 0,0871 | |||
| RJF / Raymond James Financial, Inc. | 0,06 | 0,01 | 0,01 | 12,50 | 2,3121 | 0,1527 | |||
| APO / Apollo Global Management, Inc. | 0,07 | 4,75 | 0,01 | 12,50 | 2,2019 | 0,1093 | |||
| NVDA / NVIDIA Corporation | 0,06 | 19,52 | 0,01 | 80,00 | 2,1838 | 0,8912 | |||
| SO / The Southern Company | 0,10 | 1,08 | 0,01 | 12,50 | 2,1356 | -0,0461 | |||
| ASML / ASML Holding N.V. - Depositary Receipt (Common Stock) | 0,01 | 113,24 | 0,01 | 250,00 | 1,7763 | 1,0660 | |||
| JPM / JPMorgan Chase & Co. | 0,03 | -1,05 | 0,01 | 16,67 | 1,7589 | 0,2076 | |||
| GEV / GE Vernova Inc. | 0,01 | 0,55 | 0,01 | 150,00 | 1,2290 | 0,5017 | |||
| FBTC / Fidelity Wise Origin Bitcoin Fund | 0,05 | 21,52 | 0,01 | 66,67 | 1,2151 | 0,4255 | |||
| GS / The Goldman Sachs Group, Inc. | 0,01 | -58,44 | 0,00 | -50,00 | 1,0781 | -0,9871 | |||
| TFC / Truist Financial Corporation | 0,09 | 1,77 | 0,00 | 0,00 | 0,8807 | 0,0263 | |||
| EPD / Enterprise Products Partners L.P. - Limited Partnership | 0,12 | 3,02 | 0,00 | 0,00 | 0,8687 | -0,0890 | |||
| COST / Costco Wholesale Corporation | 0,00 | -1,07 | 0,00 | 0,00 | 0,7784 | 0,0031 | |||
| WMT / Walmart Inc. | 0,03 | 35,76 | 0,00 | 50,00 | 0,7638 | 0,2428 | |||
| MS / Morgan Stanley | 0,02 | 0,62 | 0,00 | 50,00 | 0,7313 | 0,1104 | |||
| JNJ / Johnson & Johnson | 0,02 | 0,45 | 0,00 | -33,33 | 0,6906 | -0,0793 | |||
| ONB / Old National Bancorp | 0,13 | 0,00 | 0,00 | 0,00 | 0,6737 | -0,0162 | |||
| AMGN / Amgen Inc. | 0,01 | 1,06 | 0,00 | 0,00 | 0,5593 | -0,0777 | |||
| BRK.A / Berkshire Hathaway Inc. | 0,00 | -40,00 | 0,00 | -33,33 | 0,5144 | -0,4543 | |||
| UPS / United Parcel Service, Inc. | 0,02 | -3,45 | 0,00 | 0,00 | 0,5122 | -0,0842 | |||
| HD / The Home Depot, Inc. | 0,01 | 5,10 | 0,00 | 0,00 | 0,5087 | 0,0096 | |||
| GEHC / GE HealthCare Technologies Inc. | 0,03 | 26,53 | 0,00 | 100,00 | 0,5068 | 0,0567 | |||
| CAT / Caterpillar Inc. | 0,01 | 21,13 | 0,00 | 100,00 | 0,4899 | 0,1354 | |||
| FHN / First Horizon Corporation | 0,09 | 0,13 | 0,00 | 100,00 | 0,4720 | 0,0267 | |||
| SBCF / Seacoast Banking Corporation of Florida | 0,07 | 16,68 | 0,00 | 0,00 | 0,4610 | 0,0812 | |||
| SPY / SPDR S&P 500 ETF | 0,00 | 37,15 | 0,00 | 0,00 | 0,4421 | 0,1410 | |||
| HSTM / HealthStream, Inc. | 0,06 | 0,00 | 0,00 | 0,00 | 0,3758 | -0,0751 | |||
| MCD / McDonald's Corporation | 0,01 | 0,54 | 0,00 | 0,00 | 0,3715 | -0,0361 | |||
| TSM / Taiwan Semiconductor Manufacturing Company Limited - Depositary Receipt (Common Stock) | 0,01 | 0,03 | 0,00 | 0,00 | 0,3555 | 0,0867 | |||
| KO / The Coca-Cola Company | 0,02 | 0,75 | 0,00 | 0,00 | 0,3532 | -0,0130 | |||
| USLM / United States Lime & Minerals, Inc. | 0,01 | 0,00 | 0,00 | 0,00 | 0,3522 | 0,0305 | |||
| STWD / Starwood Property Trust, Inc. | 0,07 | 25,60 | 0,00 | 0,00 | 0,3433 | 0,0655 | |||
| ARI / Apollo Commercial Real Estate Finance, Inc. | 0,15 | 29,29 | 0,00 | 0,00 | 0,3377 | 0,0715 | |||
| V / Visa Inc. | 0,00 | -1,78 | 0,00 | 0,00 | 0,3372 | -0,0125 | |||
| FLO / Flowers Foods, Inc. | 0,09 | 0,00 | 0,3313 | 0,3313 | |||||
| PNFP / Pinnacle Financial Partners, Inc. | 0,01 | 0,11 | 0,00 | 0,00 | 0,2953 | 0,0031 | |||
| SNV / Synovus Financial Corp. | 0,02 | 27,22 | 0,00 | 0,2934 | 0,0784 | ||||
| QQQ / Invesco QQQ Trust, Series 1 | 0,00 | 15,41 | 0,00 | 0,2887 | 0,0694 | ||||
| MU / Micron Technology, Inc. | 0,01 | 55,87 | 0,00 | 0,2871 | 0,1531 | ||||
| LLY / Eli Lilly and Company | 0,00 | 8,37 | 0,00 | 0,00 | 0,2826 | -0,0025 | |||
| MRK / Merck & Co., Inc. | 0,02 | -7,69 | 0,00 | 0,00 | 0,2826 | -0,0756 | |||
| VZ / Verizon Communications Inc. | 0,03 | -2,72 | 0,00 | 0,00 | 0,2722 | -0,0303 | |||
| RSP / Invesco Exchange-Traded Fund Trust - Invesco S&P 500 Equal Weight ETF | 0,01 | 1,54 | 0,00 | 0,00 | 0,2704 | 0,0085 | |||
| GOOGL / Alphabet Inc. | 0,01 | 0,89 | 0,00 | 0,2685 | 0,0275 | ||||
| DHR / Danaher Corporation | 0,01 | 0,00 | 0,00 | 0,00 | 0,2381 | -0,0169 | |||
| CBL / CBL & Associates Properties, Inc. | 0,04 | 0,00 | 0,00 | -100,00 | 0,2313 | -0,0184 | |||
| BFB / Brown-Forman Corp. - Class B | 0,03 | 113,47 | 0,00 | 0,1991 | 0,0777 | ||||
| DIA / SPDR Dow Jones Industrial Average ETF Trust | 0,00 | 15,90 | 0,00 | 0,1955 | 0,0296 | ||||
| HUT / Hut 8 Corp. | 0,04 | 0,00 | 0,00 | 0,1925 | 0,0685 | ||||
| VIG / Vanguard Specialized Funds - Vanguard Dividend Appreciation ETF | 0,00 | 0,00 | 0,00 | 0,1899 | 0,0043 | ||||
| BMY / Bristol-Myers Squibb Company | 0,02 | -80,36 | 0,00 | -100,00 | 0,1840 | -1,0897 | |||
| ABBV / AbbVie Inc. | 0,00 | 3,66 | 0,00 | 0,1833 | -0,0225 | ||||
| CVX / Chevron Corporation | 0,01 | 6,65 | 0,00 | 0,1826 | -0,0237 | ||||
| GPN / Global Payments Inc. | 0,01 | -1,89 | 0,00 | 0,1762 | -0,0504 | ||||
| CIFR / Cipher Mining Inc. | 0,15 | 0,00 | 0,00 | 0,1741 | 0,0875 | ||||
| IBM / International Business Machines Corporation | 0,00 | 0,53 | 0,00 | 0,1713 | 0,0230 | ||||
| PLTR / Palantir Technologies Inc. | 0,00 | 25,14 | 0,00 | 0,1421 | 0,0696 | ||||
| STT / State Street Corporation | 0,01 | 0,09 | 0,00 | 0,1400 | 0,0184 | ||||
| MSTR / Strategy Inc | 0,00 | -1,17 | 0,00 | 0,1362 | 0,0348 | ||||
| JEF / Jefferies Financial Group Inc. | 0,01 | 0,00 | 0,00 | 0,1285 | -0,0016 | ||||
| WM / Waste Management, Inc. | 0,00 | 0,00 | 0,00 | 0,1275 | -0,0054 | ||||
| SLF / Sun Life Financial Inc. | 0,01 | 0,21 | 0,00 | 0,1266 | 0,0142 | ||||
| LULU / lululemon athletica inc. | 0,00 | 0,00 | 0,00 | 0,1252 | -0,0289 | ||||
| CHWY / Chewy, Inc. | 0,01 | -2,48 | 0,00 | 0,1242 | 0,0238 | ||||
| IVV / iShares Trust - iShares Core S&P 500 ETF | 0,00 | 0,12 | 0,00 | 0,1235 | 0,0083 | ||||
| DIS / The Walt Disney Company | 0,00 | -35,63 | 0,00 | 0,1184 | -0,0335 | ||||
| CSCO / Cisco Systems, Inc. | 0,01 | 0,67 | 0,00 | 0,1172 | 0,0104 | ||||
| UBER / Uber Technologies, Inc. | 0,01 | 0,34 | 0,00 | 0,1153 | 0,0226 | ||||
| ESLT / Elbit Systems Ltd. | 0,00 | 6,90 | 0,00 | 0,1129 | 0,0198 | ||||
| ET / Energy Transfer LP - Limited Partnership | 0,02 | 5 825,75 | 0,00 | 0,1009 | 0,0056 | ||||
| DUK / Duke Energy Corporation | 0,00 | 0,61 | 0,00 | 0,1002 | -0,0060 | ||||
| PFF / iShares Trust - iShares Preferred and Income Securities ETF | 0,01 | 0,88 | 0,00 | 0,0986 | -0,0024 | ||||
| MCK / McKesson Corporation | 0,00 | 0,00 | 0,00 | 0,0856 | 0,0046 | ||||
| BX / Blackstone Inc. | 0,00 | -2,16 | 0,00 | 0,0781 | 0,0012 | ||||
| BA / The Boeing Company | 0,00 | 0,00 | 0,0746 | 0,0746 | |||||
| VRT / Vertiv Holdings Co | 0,00 | 0,00 | 0,0744 | 0,0744 | |||||
| RTX / RTX Corporation | 0,00 | 14,25 | 0,00 | 0,0715 | 0,0128 | ||||
| XOM / Exxon Mobil Corporation | 0,00 | 14,24 | 0,00 | 0,0704 | 0,0002 | ||||
| NFLX / Netflix, Inc. | 0,00 | 2,33 | 0,00 | 0,0692 | 0,0206 | ||||
| PG / The Procter & Gamble Company | 0,00 | 37,07 | 0,00 | 0,0689 | 0,0134 | ||||
| PANW / Palo Alto Networks, Inc. | 0,00 | 0,00 | 0,0624 | 0,0624 | |||||
| AMD / Advanced Micro Devices, Inc. | 0,00 | 0,00 | 0,0621 | 0,0621 | |||||
| FNCL / Fidelity Covington Trust - Fidelity MSCI Financials Index ETF | 0,00 | 0,22 | 0,00 | 0,0621 | 0,0019 | ||||
| EMR / Emerson Electric Co. | 0,00 | -13,16 | 0,00 | 0,0619 | 0,0012 | ||||
| BABA / Alibaba Group Holding Limited - Depositary Receipt (Common Stock) | 0,00 | 0,00 | 0,00 | 0,0619 | -0,0126 | ||||
| UNP / Union Pacific Corporation | 0,00 | 0,00 | 0,0598 | 0,0598 | |||||
| RF / Regions Financial Corporation | 0,01 | 0,00 | 0,00 | 0,0576 | 0,0026 | ||||
| BUD / Anheuser-Busch InBev SA/NV - Depositary Receipt (Common Stock) | 0,00 | 0,27 | 0,00 | 0,0529 | 0,0039 | ||||
| ASTE / Astec Industries, Inc. | 0,01 | 0,00 | 0,0520 | 0,0520 | |||||
| NEE / NextEra Energy, Inc. | 0,00 | 0,36 | 0,00 | 0,0496 | -0,0028 | ||||
| AFL / Aflac Incorporated | 0,00 | 0,00 | 0,00 | 0,0494 | -0,0045 | ||||
| AXP / American Express Company | 0,00 | 0,00 | 0,0492 | 0,0492 | |||||
| ZBH / Zimmer Biomet Holdings, Inc. | 0,00 | 0,27 | 0,00 | 0,0473 | -0,0131 | ||||
| VIPS / Vipshop Holdings Limited - Depositary Receipt (Common Stock) | 0,01 | 0,00 | 0,00 | 0,0353 | -0,0028 | ||||
| REAL / The RealReal, Inc. | 0,03 | 0,00 | 0,00 | 0,0311 | -0,0051 | ||||
| WULF / TeraWulf Inc. | 0,03 | 0,00 | 0,00 | 0,0294 | 0,0105 | ||||
| NRDY / Nerdy, Inc. | 0,03 | 3,80 | 0,00 | 0,0118 | 0,0013 | ||||
| ATNM / Actinium Pharmaceuticals, Inc. | 0,03 | 0,00 | 0,00 | 0,0101 | -0,0020 | ||||
| C / Citigroup Inc. | 0,00 | -100,00 | 0,00 | 0,0000 | |||||
| AVGO / Broadcom Inc. | 0,00 | -100,00 | 0,00 | 0,0000 | |||||
| SBUX / Starbucks Corporation | 0,00 | -100,00 | 0,00 | 0,0000 | -0,0510 | ||||
| T / AT&T Inc. | 0,00 | -100,00 | 0,00 | 0,0000 | -0,0602 | ||||
| TDG / TransDigm Group Incorporated | 0,00 | -100,00 | 0,00 | 0,0000 | |||||
| PGR / The Progressive Corporation | 0,00 | -100,00 | 0,00 | 0,0000 | |||||
| SMR / NuScale Power Corporation | 0,00 | -100,00 | 0,00 | 0,0000 |