Statistiques de base
| Valeur du portefeuille | $ 73 847 695 |
| Positions actuelles | 73 |
Dernières positions, performances, ASG (à partir des dépôts 13F, 13D)
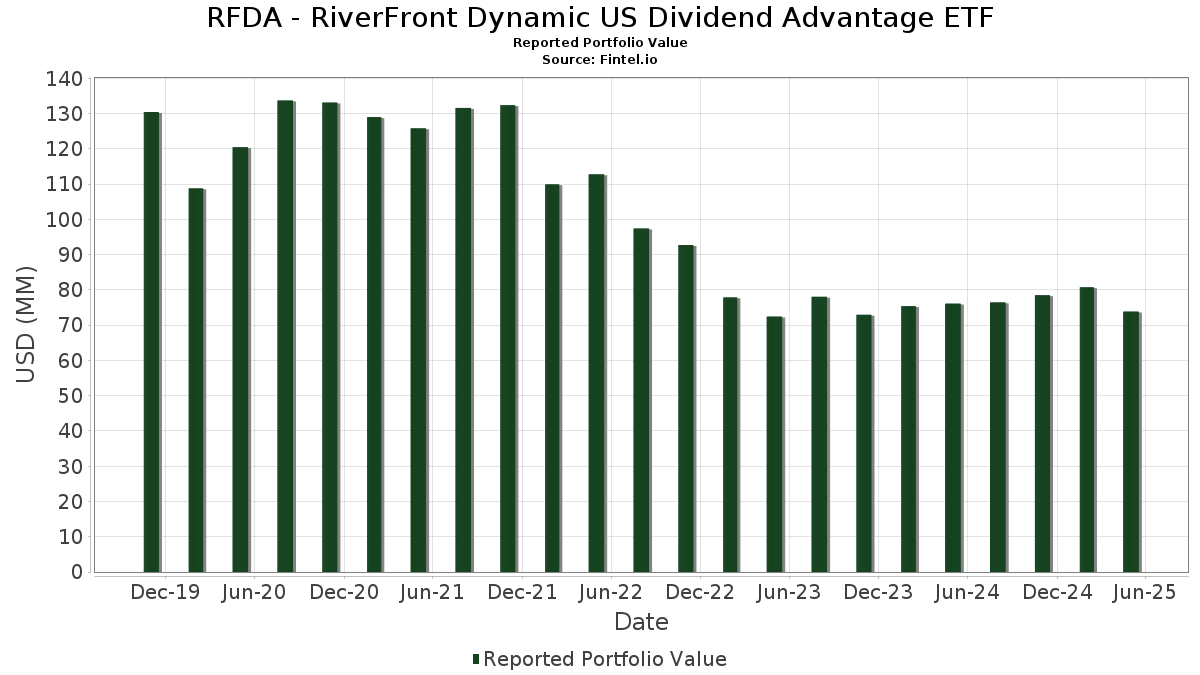
RFDA - RiverFront Dynamic US Dividend Advantage ETF a déclaré un total de 73 positions dans ses derniers dépôts auprès de la SEC. La valeur la plus récente du portefeuille est calculée à 73 847 695 USD. Les actifs sous gestion réels (ASG) sont cette valeur plus les liquidités (qui ne sont pas divulguées). Les principales positions de RFDA - RiverFront Dynamic US Dividend Advantage ETF sont NVIDIA Corporation (US:NVDA) , Microsoft Corporation (US:MSFT) , Apple Inc. (US:AAPL) , Amazon.com, Inc. (US:AMZN) , and Perdoceo Education Corporation (US:PRDO) . Les nouvelles positions de RFDA - RiverFront Dynamic US Dividend Advantage ETF incluent Trane Technologies plc (US:TT) , .
Meilleures augmentations ce trimestre
Nous utilisons la variation de l'allocation du portefeuille car il s'agit de l'indicateur le plus significatif. Les changements peuvent être dus à des transactions ou à des variations de prix des actions.
| Titre | Actions (en millions) |
Valeur ($ en millions) |
% du portefeuille | ΔPortefeuille % |
|---|---|---|---|---|
| 0,01 | 6,53 | 8,8325 | 1,3482 | |
| 0,06 | 7,52 | 10,1771 | 0,9333 | |
| 0,00 | 0,69 | 0,9313 | 0,9313 | |
| 0,07 | 2,35 | 3,1760 | 0,8292 | |
| 0,04 | 0,97 | 1,3169 | 0,2595 | |
| 0,08 | 1,56 | 2,1088 | 0,2388 | |
| 0,01 | 1,14 | 1,5397 | 0,1881 | |
| 0,04 | 1,25 | 1,6885 | 0,1778 | |
| 0,06 | 0,79 | 1,0738 | 0,1626 | |
| 0,02 | 1,28 | 1,7301 | 0,1030 |
Principales baisses ce trimestre
Nous utilisons la variation de l'allocation du portefeuille car il s'agit de l'indicateur le plus significatif. Les changements peuvent être dus à des transactions ou à des variations de prix des actions.
| Titre | Actions (en millions) |
Valeur ($ en millions) |
% du portefeuille | ΔPortefeuille % |
|---|---|---|---|---|
| 0,03 | 5,43 | 7,3394 | -1,3432 | |
| 0,08 | 0,64 | 0,8691 | -0,4153 | |
| 0,10 | 0,44 | 0,5973 | -0,3339 | |
| 0,09 | 0,60 | 0,8155 | -0,2931 | |
| 0,07 | 1,13 | 1,5270 | -0,1930 | |
| 0,03 | 0,82 | 1,1027 | -0,1860 | |
| 0,01 | 0,91 | 1,2376 | -0,1841 | |
| 0,10 | 0,47 | 0,6375 | -0,1711 | |
| 0,01 | 0,52 | 0,6993 | -0,1530 | |
| 0,12 | 0,38 | 0,5116 | -0,1227 |
Déclarations 13F et dépôts de fonds
Ce formulaire a été déposé le 2025-07-30 pour la période de déclaration 2025-05-31. Cliquez sur l'icône du lien pour voir l'historique complet des transactions.
Mettre à niveau pour débloquer les données premium et exporter vers Excel ![]() .
.
| Titre | Type | Prix moyen de l'action | Actions (en millions) |
ΔActions (%) |
ΔActions (%) |
Valeur ($ en millions) |
Portefeuille (%) |
ΔPortefeuille (%) |
|
|---|---|---|---|---|---|---|---|---|---|
| NVDA / NVIDIA Corporation | 0,06 | -6,90 | 7,52 | 0,71 | 10,1771 | 0,9333 | |||
| MSFT / Microsoft Corporation | 0,01 | -6,91 | 6,53 | 7,95 | 8,8325 | 1,3482 | |||
| AAPL / Apple Inc. | 0,03 | -6,89 | 5,43 | -22,68 | 7,3394 | -1,3432 | |||
| AMZN / Amazon.com, Inc. | 0,02 | -6,89 | 3,28 | -10,09 | 4,4373 | -0,0768 | |||
| PRDO / Perdoceo Education Corporation | 0,07 | -6,90 | 2,35 | 23,79 | 3,1760 | 0,8292 | |||
| GOOG / Alphabet Inc. | 0,01 | -6,89 | 1,77 | -6,51 | 2,3908 | 0,0506 | |||
| IBM / International Business Machines Corporation | 0,01 | -6,88 | 1,67 | -4,41 | 2,2570 | 0,0964 | |||
| AM / Antero Midstream Corporation | 0,08 | -6,90 | 1,56 | 3,11 | 2,1088 | 0,2388 | |||
| CSCO / Cisco Systems, Inc. | 0,02 | -6,90 | 1,48 | -8,43 | 1,9985 | 0,0016 | |||
| US8574928623 / State Street Institutional Treasury Plus Money Market Fund | 1,43 | -6,80 | 1,43 | -6,78 | 1,9362 | 0,0358 | |||
| PBI / Pitney Bowes Inc. | 0,14 | -6,90 | 1,42 | -11,41 | 1,9226 | -0,0636 | |||
| ORI / Old Republic International Corporation | 0,03 | -6,90 | 1,28 | -8,64 | 1,7312 | -0,0017 | |||
| HRB / H&R Block, Inc. | 0,02 | -6,90 | 1,28 | -2,74 | 1,7301 | 0,1030 | |||
| CWEN / Clearway Energy, Inc. | 0,04 | -6,90 | 1,25 | 2,30 | 1,6885 | 0,1778 | |||
| KMI / Kinder Morgan, Inc. | 0,04 | -6,90 | 1,18 | -3,67 | 1,5997 | 0,0806 | |||
| V / Visa Inc. | 0,00 | -6,93 | 1,18 | -6,29 | 1,5928 | 0,0379 | |||
| FIS / Fidelity National Information Services, Inc. | 0,01 | -6,90 | 1,14 | 4,21 | 1,5397 | 0,1881 | |||
| HPE / Hewlett Packard Enterprise Company | 0,07 | -6,90 | 1,13 | -18,79 | 1,5270 | -0,1930 | |||
| USB / U.S. Bancorp | 0,03 | -6,90 | 1,12 | -13,45 | 1,5157 | -0,0866 | |||
| PEG / Public Service Enterprise Group Incorporated | 0,01 | -6,89 | 1,03 | -7,01 | 1,3994 | 0,0226 | |||
| TJX / The TJX Companies, Inc. | 0,01 | -6,89 | 1,01 | -5,32 | 1,3724 | 0,0467 | |||
| UVE / Universal Insurance Holdings, Inc. | 0,04 | -6,89 | 0,97 | 13,93 | 1,3169 | 0,2595 | |||
| EOG / EOG Resources, Inc. | 0,01 | -6,90 | 0,91 | -20,38 | 1,2376 | -0,1841 | |||
| UHT / Universal Health Realty Income Trust | 0,02 | -6,88 | 0,86 | -7,44 | 1,1619 | 0,0144 | |||
| HAFC / Hanmi Financial Corporation | 0,04 | -6,90 | 0,83 | -11,17 | 1,1197 | -0,0328 | |||
| THFF / First Financial Corporation | 0,02 | -6,89 | 0,83 | -6,67 | 1,1186 | 0,0224 | |||
| FHN / First Horizon Corporation | 0,04 | -6,90 | 0,82 | -14,01 | 1,1039 | -0,0713 | |||
| SKT / Tanger Inc. | 0,03 | -6,89 | 0,82 | -21,71 | 1,1027 | -0,1860 | |||
| MYE / Myers Industries, Inc. | 0,06 | -6,89 | 0,79 | 7,74 | 1,0738 | 0,1626 | |||
| QCOM / QUALCOMM Incorporated | 0,01 | -6,87 | 0,79 | -13,99 | 1,0651 | -0,0673 | |||
| XOM / Exxon Mobil Corporation | 0,01 | -6,88 | 0,74 | -14,42 | 1,0041 | -0,0693 | |||
| MO / Altria Group, Inc. | 0,01 | -6,87 | 0,70 | 1,02 | 0,9410 | 0,0893 | |||
| TT / Trane Technologies plc | 0,00 | 0,69 | 0,9313 | 0,9313 | |||||
| CRGY / Crescent Energy Company | 0,08 | -6,90 | 0,64 | -38,09 | 0,8691 | -0,4153 | |||
| HTBK / Heritage Commerce Corp | 0,07 | -6,90 | 0,64 | -18,73 | 0,8639 | -0,1086 | |||
| TRST / TrustCo Bank Corp NY | 0,02 | -6,89 | 0,63 | -12,53 | 0,8508 | -0,0382 | |||
| WASH / Washington Trust Bancorp, Inc. | 0,02 | -6,90 | 0,62 | -19,90 | 0,8401 | -0,1184 | |||
| GOOGL / Alphabet Inc. | 0,00 | -6,93 | 0,61 | -6,16 | 0,8243 | 0,0210 | |||
| GMRE / Global Medical REIT Inc. | 0,09 | -6,90 | 0,60 | -32,74 | 0,8155 | -0,2931 | |||
| PAYX / Paychex, Inc. | 0,00 | -6,91 | 0,59 | -3,14 | 0,7938 | 0,0446 | |||
| OMF / OneMain Holdings, Inc. | 0,01 | -6,89 | 0,58 | -10,19 | 0,7886 | -0,0146 | |||
| NRC / National Research Corporation | 0,04 | -6,90 | 0,56 | -13,89 | 0,7559 | -0,0462 | |||
| KO / The Coca-Cola Company | 0,01 | -6,86 | 0,55 | -5,78 | 0,7507 | 0,0225 | |||
| DLX / Deluxe Corporation | 0,04 | -6,90 | 0,54 | -19,37 | 0,7274 | -0,0970 | |||
| AMGN / Amgen Inc. | 0,00 | -6,86 | 0,53 | -12,95 | 0,7197 | -0,0359 | |||
| APOG / Apogee Enterprises, Inc. | 0,01 | -6,90 | 0,52 | -25,00 | 0,6993 | -0,1530 | |||
| GNK / Genco Shipping & Trading Limited | 0,04 | -6,90 | 0,50 | -13,69 | 0,6747 | -0,0403 | |||
| METC / Ramaco Resources, Inc. | 0,05 | -6,90 | 0,50 | -5,89 | 0,6709 | 0,0190 | |||
| LMT / Lockheed Martin Corporation | 0,00 | -6,91 | 0,49 | -0,40 | 0,6683 | 0,0552 | |||
| PM / Philip Morris International Inc. | 0,00 | -6,94 | 0,48 | 8,05 | 0,6548 | 0,1013 | |||
| CURB / Curbline Properties Corp. | 0,02 | -6,90 | 0,48 | -14,23 | 0,6525 | -0,0435 | |||
| FULT / Fulton Financial Corporation | 0,03 | -6,90 | 0,48 | -19,02 | 0,6464 | -0,0833 | |||
| CPT / Camden Property Trust | 0,00 | -6,91 | 0,47 | -11,90 | 0,6421 | -0,0242 | |||
| VLY / Valley National Bancorp | 0,05 | -6,90 | 0,47 | -17,02 | 0,6409 | -0,0648 | |||
| VBTX / Veritex Holdings, Inc. | 0,02 | -6,89 | 0,47 | -14,34 | 0,6386 | -0,0443 | |||
| MPW / Medical Properties Trust, Inc. | 0,10 | -6,89 | 0,47 | -27,87 | 0,6375 | -0,1711 | |||
| EVRG / Evergy, Inc. | 0,01 | -6,90 | 0,47 | -10,40 | 0,6302 | -0,0123 | |||
| INVH / Invitation Homes Inc. | 0,01 | -6,88 | 0,46 | -7,58 | 0,6266 | 0,0054 | |||
| TGNA / TEGNA Inc. | 0,03 | -6,90 | 0,46 | -14,55 | 0,6206 | -0,0431 | |||
| BGS / B&G Foods, Inc. | 0,10 | -6,90 | 0,44 | -41,36 | 0,5973 | -0,3339 | |||
| MSM / MSC Industrial Direct Co., Inc. | 0,01 | -6,88 | 0,42 | -5,80 | 0,5711 | 0,0159 | |||
| ETD / Ethan Allen Interiors Inc. | 0,02 | -6,89 | 0,42 | -14,66 | 0,5674 | -0,0406 | |||
| GEFB / Greif Inc - Class B | 0,01 | -6,92 | 0,40 | -7,66 | 0,5398 | 0,0062 | |||
| FNB / F.N.B. Corporation | 0,03 | -6,90 | 0,40 | -12,94 | 0,5379 | -0,0276 | |||
| EGY / VAALCO Energy, Inc. | 0,12 | -6,90 | 0,38 | -26,17 | 0,5116 | -0,1227 | |||
| WU / The Western Union Company | 0,04 | -6,90 | 0,38 | -20,21 | 0,5081 | -0,0745 | |||
| UPBD / Upbound Group, Inc. | 0,01 | -6,90 | 0,32 | -17,14 | 0,4318 | -0,0458 | |||
| STWD / Starwood Property Trust, Inc. | 0,02 | -6,88 | 0,31 | -10,47 | 0,4177 | -0,0086 | |||
| DVN / Devon Energy Corporation | 0,01 | -6,91 | 0,25 | -22,36 | 0,3395 | -0,0598 | |||
| PDM / Piedmont Realty Trust, Inc. | 0,03 | -6,89 | 0,24 | -12,64 | 0,3180 | -0,0151 | |||
| RC / Ready Capital Corporation | 0,04 | -6,90 | 0,17 | -40,00 | 0,2280 | -0,1193 | |||
| SITC / SITE Centers Corp. | 0,01 | -6,89 | 0,12 | -21,02 | 0,1683 | -0,0260 | |||
| METCB / Ramaco Resources, Inc. | 0,00 | 97,79 | 0,01 | 57,14 | 0,0162 | 0,0073 | |||
| State Street Navigator Securities Lending Government Money Market Portfolio / STIV (N/A) | 0,00 | 0,00 | 0,0000 | 0,0000 |