Statistiques de base
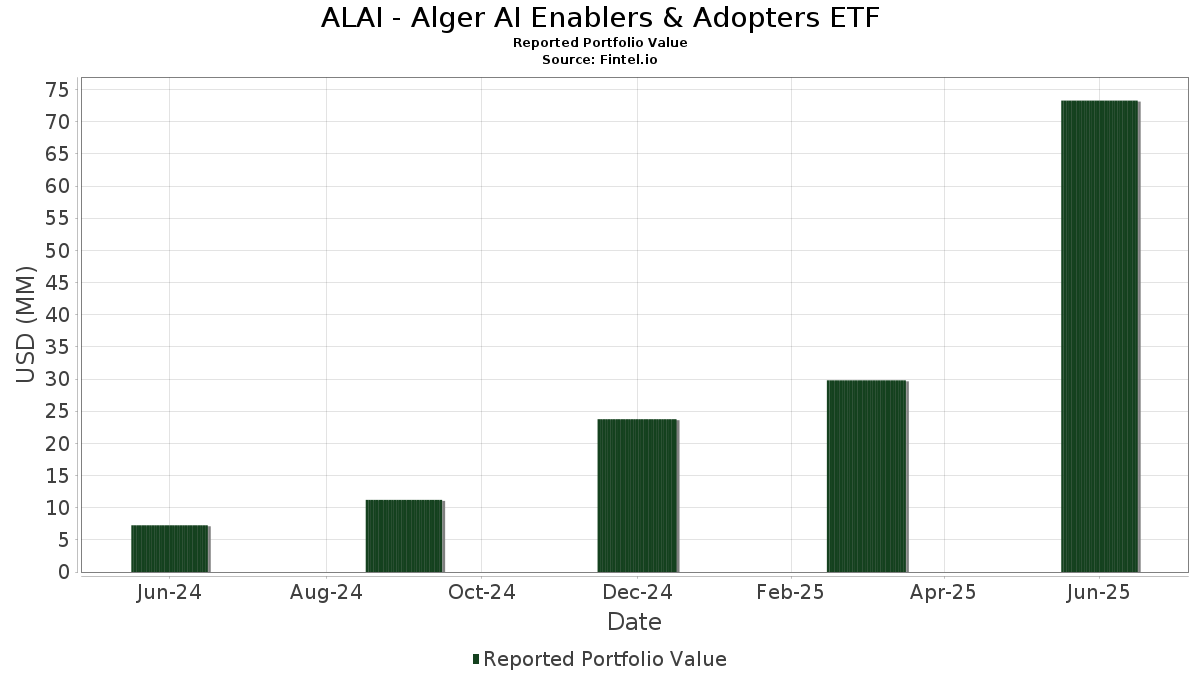
| Valeur du portefeuille | $ 73 282 525 |
| Positions actuelles | 51 |
Dernières positions, performances, ASG (à partir des dépôts 13F, 13D)
ALAI - Alger AI Enablers & Adopters ETF a déclaré un total de 51 positions dans ses derniers dépôts auprès de la SEC. La valeur la plus récente du portefeuille est calculée à 73 282 525 USD. Les actifs sous gestion réels (ASG) sont cette valeur plus les liquidités (qui ne sont pas divulguées). Les principales positions de ALAI - Alger AI Enablers & Adopters ETF sont NVIDIA Corporation (US:NVDA) , Amazon.com, Inc. (US:AMZN) , Microsoft Corporation (US:MSFT) , Meta Platforms, Inc. (US:META) , and AppLovin Corporation (US:APP) . Les nouvelles positions de ALAI - Alger AI Enablers & Adopters ETF incluent Snowflake Inc. (US:SNOW) , Oracle Corporation (US:ORCL) , Trip.com Group Limited - Depositary Receipt (Common Stock) (US:TCOM) , .
Meilleures augmentations ce trimestre
Nous utilisons la variation de l'allocation du portefeuille car il s'agit de l'indicateur le plus significatif. Les changements peuvent être dus à des transactions ou à des variations de prix des actions.
| Titre | Actions (en millions) |
Valeur ($ en millions) |
% du portefeuille | ΔPortefeuille % |
|---|---|---|---|---|
| 0,07 | 10,76 | 15,0561 | 3,4238 | |
| 0,01 | 2,89 | 4,0417 | 2,5419 | |
| 0,03 | 1,76 | 2,4563 | 2,1631 | |
| 0,02 | 7,63 | 10,6701 | 1,9065 | |
| 0,04 | 7,87 | 11,0117 | 1,6051 | |
| 0,01 | 1,97 | 2,7545 | 1,5825 | |
| 0,01 | 2,63 | 3,6837 | 1,4408 | |
| 0,01 | 2,93 | 4,0933 | 1,4363 | |
| 0,00 | 0,94 | 1,3083 | 1,2918 | |
| 0,05 | 0,88 | 1,2326 | 1,2326 |
Principales baisses ce trimestre
Nous utilisons la variation de l'allocation du portefeuille car il s'agit de l'indicateur le plus significatif. Les changements peuvent être dus à des transactions ou à des variations de prix des actions.
| Titre | Actions (en millions) |
Valeur ($ en millions) |
% du portefeuille | ΔPortefeuille % |
|---|---|---|---|---|
| 0,01 | 3,17 | 4,4362 | -2,6679 | |
| 0,03 | 1,37 | 1,9142 | -1,7222 | |
| 0,00 | 1,65 | 2,3131 | -1,3837 | |
| 0,01 | 1,49 | 2,0845 | -1,3057 | |
| 0,00 | 0,43 | 0,5966 | -1,1857 | |
| 0,00 | 0,07 | 0,1010 | -0,6571 | |
| 0,00 | 0,00 | -0,4504 | ||
| 0,01 | 5,37 | 7,5103 | -0,4389 | |
| 0,00 | 0,04 | 0,0618 | -0,3428 | |
| 0,00 | 0,34 | 0,4811 | -0,3335 |
Déclarations 13F et dépôts de fonds
Ce formulaire a été déposé le 2025-08-28 pour la période de déclaration 2025-06-30. Cliquez sur l'icône du lien pour voir l'historique complet des transactions.
Mettre à niveau pour débloquer les données premium et exporter vers Excel ![]() .
.
| Titre | Type | Prix moyen de l'action | Actions (en millions) |
ΔActions (%) |
ΔActions (%) |
Valeur ($ en millions) |
Portefeuille (%) |
ΔPortefeuille (%) |
|
|---|---|---|---|---|---|---|---|---|---|
| NVDA / NVIDIA Corporation | 0,07 | 115,28 | 10,76 | 213,82 | 15,0561 | 3,4238 | |||
| AMZN / Amazon.com, Inc. | 0,04 | 146,15 | 7,87 | 183,92 | 11,0117 | 1,6051 | |||
| MSFT / Microsoft Corporation | 0,02 | 122,79 | 7,63 | 195,20 | 10,6701 | 1,9065 | |||
| META / Meta Platforms, Inc. | 0,01 | 78,88 | 5,37 | 129,05 | 7,5103 | -0,4389 | |||
| APP / AppLovin Corporation | 0,01 | 14,60 | 3,17 | 51,43 | 4,4362 | -2,6679 | |||
| TSM / Taiwan Semiconductor Manufacturing Company Limited - Depositary Receipt (Common Stock) | 0,01 | 88,24 | 3,01 | 156,87 | 4,2082 | 0,2355 | |||
| TLN / Talen Energy Corporation | 0,01 | 156,50 | 2,93 | 273,69 | 4,0933 | 1,4363 | |||
| VST / Vistra Corp. | 0,01 | 295,91 | 2,89 | 553,62 | 4,0417 | 2,5419 | |||
| TSLA / Tesla, Inc. | 0,01 | 224,88 | 2,63 | 298,34 | 3,6837 | 1,4408 | |||
| GOOG / Alphabet Inc. | 0,01 | 665,13 | 1,97 | 613,41 | 2,7545 | 1,5825 | |||
| NBIS / Nebius Group N.V. | 0,03 | 674,90 | 1,76 | 1 941,86 | 2,4563 | 2,1631 | |||
| NFLX / Netflix, Inc. | 0,00 | 5,65 | 1,65 | 51,65 | 2,3131 | -1,3837 | |||
| AVGO / Broadcom Inc. | 0,01 | 30,10 | 1,59 | 114,13 | 2,2265 | -0,2939 | |||
| HOOD / Robinhood Markets, Inc. | 0,02 | 3,22 | 1,56 | 132,39 | 2,1883 | -0,0965 | |||
| SE / Sea Limited - Depositary Receipt (Common Stock) | 0,01 | 21,63 | 1,49 | 49,15 | 2,0845 | -1,3057 | |||
| VRT / Vertiv Holdings Co | 0,01 | 44,49 | 1,49 | 157,34 | 2,0841 | 0,1177 | |||
| GFL / GFL Environmental Inc. | 0,03 | 22,19 | 1,37 | 27,61 | 1,9142 | -1,7222 | |||
| SPOT / Spotify Technology S.A. | 0,00 | 167,59 | 1,19 | 273,04 | 1,6657 | 0,5838 | |||
| RBLX / Roblox Corporation | 0,01 | 372,29 | 0,95 | 759,09 | 1,3218 | 0,9458 | |||
| CEG / Constellation Energy Corporation | 0,00 | 11 975,00 | 0,94 | 23 275,00 | 1,3083 | 1,2918 | |||
| SB Technology, Inc. Series E Preferred Stock / EP (000000000) | 0,05 | 0,88 | 1,2326 | 1,2326 | |||||
| SB Technology, Inc. Series E Preferred Stock / EP (000000000) | 0,05 | 0,88 | 1,2326 | 1,2326 | |||||
| NTRA / Natera, Inc. | 0,00 | 105,54 | 0,76 | 145,66 | 1,0699 | 0,0135 | |||
| MELI / MercadoLibre, Inc. | 0,00 | 45,86 | 0,69 | 95,18 | 0,9651 | -0,2324 | |||
| ALAB / Astera Labs, Inc. | 0,01 | 60,42 | 0,62 | 142,80 | 0,8740 | 0,0023 | |||
| Databricks, Inc. Series J / EC (000000000) | 0,01 | 0,61 | 0,8589 | 0,8589 | |||||
| Databricks, Inc. Series J / EC (000000000) | 0,01 | 0,61 | 0,8589 | 0,8589 | |||||
| SNOW / Snowflake Inc. | 0,00 | 0,52 | 0,7286 | 0,7286 | |||||
| JPM / JPMorgan Chase & Co. | 0,00 | 126,84 | 0,51 | 167,89 | 0,7128 | 0,0681 | |||
| AAPL / Apple Inc. | 0,00 | -12,13 | 0,43 | -18,86 | 0,5966 | -1,1857 | |||
| ITRI / Itron, Inc. | 0,00 | 106,77 | 0,43 | 160,74 | 0,5958 | 0,0398 | |||
| COHR / Coherent Corp. | 0,00 | 143,87 | 0,39 | 236,21 | 0,5459 | 0,1508 | |||
| ETN / Eaton Corporation plc | 0,00 | 206,04 | 0,36 | 231,19 | 0,5058 | 0,0399 | |||
| ISRG / Intuitive Surgical, Inc. | 0,00 | 30,52 | 0,34 | 42,92 | 0,4811 | -0,3335 | |||
| PINS / Pinterest, Inc. | 0,01 | 69,48 | 0,27 | 96,40 | 0,3829 | -0,0907 | |||
| ORCL / Oracle Corporation | 0,00 | 0,26 | 0,3624 | 0,3624 | |||||
| DASH / DoorDash, Inc. | 0,00 | 571,24 | 0,25 | 837,04 | 0,3541 | 0,2593 | |||
| MRVL / Marvell Technology, Inc. | 0,00 | 223,78 | 0,22 | 249,21 | 0,3081 | -0,2515 | |||
| SHOP / Shopify Inc. | 0,00 | 363,12 | 0,22 | 411,90 | 0,3019 | 0,1197 | |||
| NET / Cloudflare, Inc. | 0,00 | 14,72 | 0,22 | 100,93 | 0,3010 | -0,0651 | |||
| DKNG / DraftKings Inc. | 0,00 | 80,01 | 0,21 | 133,71 | 0,2912 | -0,0125 | |||
| UAL / United Airlines Holdings, Inc. | 0,00 | 47,94 | 0,19 | 71,68 | 0,2715 | -0,1144 | |||
| ADSK / Autodesk, Inc. | 0,00 | 45,24 | 0,19 | 72,48 | 0,2641 | -0,1088 | |||
| INDI / indie Semiconductor, Inc. | 0,05 | -19,59 | 0,18 | 40,31 | 0,2540 | -0,1838 | |||
| CORZ / Core Scientific, Inc. | 0,01 | -54,47 | 0,15 | 7,04 | 0,2133 | -0,2685 | |||
| TCOM / Trip.com Group Limited - Depositary Receipt (Common Stock) | 0,00 | 0,14 | 0,1896 | 0,1896 | |||||
| GLBE / Global-E Online Ltd. | 0,00 | 45,28 | 0,13 | 37,11 | 0,1871 | -0,1448 | |||
| MU / Micron Technology, Inc. | 0,00 | 15,18 | 0,13 | 64,20 | 0,1870 | -0,0905 | |||
| WMT / Walmart Inc. | 0,00 | 79,48 | 0,13 | 100,00 | 0,1794 | -0,0382 | |||
| SPGI / S&P Global Inc. | 0,00 | -68,86 | 0,07 | -67,71 | 0,1010 | -0,6571 | |||
| NOW / ServiceNow, Inc. | 0,00 | -52,22 | 0,04 | -53,68 | 0,0618 | -0,3428 | |||
| PLTR / Palantir Technologies Inc. | 0,00 | -100,00 | 0,00 | -100,00 | -0,1016 | ||||
| GRAB / Grab Holdings Limited | 0,00 | -100,00 | 0,00 | -100,00 | -0,2696 | ||||
| Z / Zillow Group, Inc. | 0,00 | -100,00 | 0,00 | -100,00 | -0,4504 |