Statistiques de base
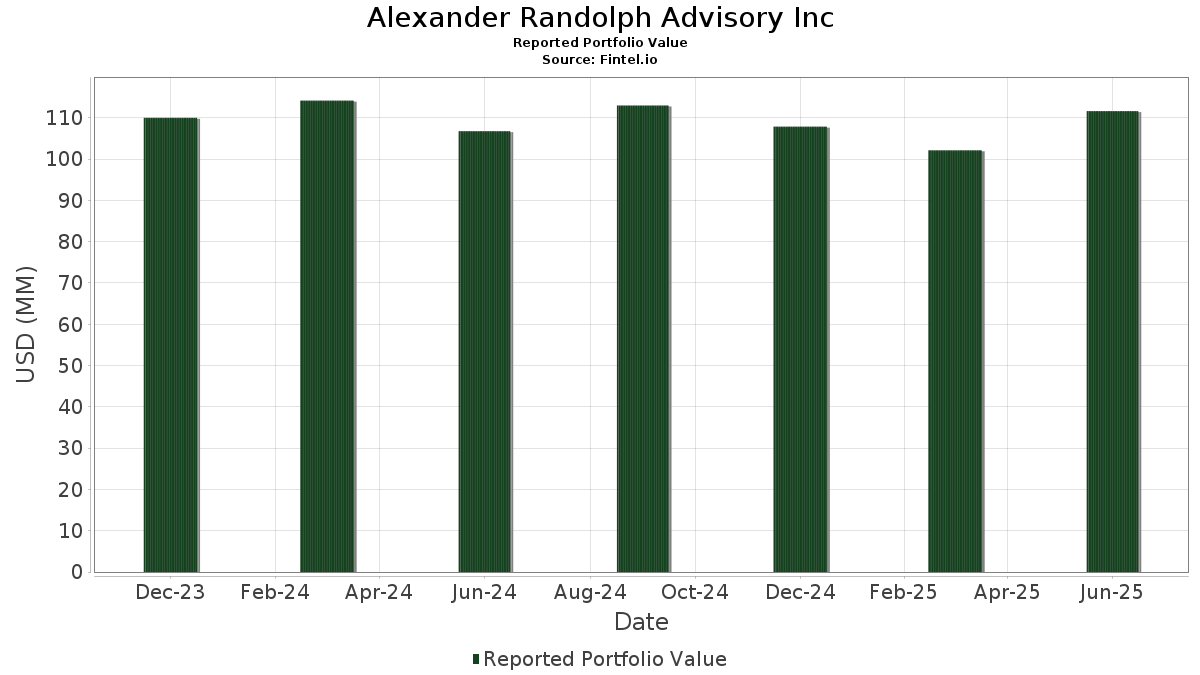
| Valeur du portefeuille | $ 111 621 922 |
| Positions actuelles | 53 |
Dernières positions, performances, ASG (à partir des dépôts 13F, 13D)
Alexander Randolph Advisory Inc a déclaré un total de 53 positions dans ses derniers dépôts auprès de la SEC. La valeur la plus récente du portefeuille est calculée à 111 621 922 USD. Les actifs sous gestion réels (ASG) sont cette valeur plus les liquidités (qui ne sont pas divulguées). Les principales positions de Alexander Randolph Advisory Inc sont iShares U.S. ETF Trust - iShares Short Duration Bond Active ETF (US:NEAR) , iShares Trust - iShares Core 1-5 Year USD Bond ETF (US:ISTB) , Royce Micro-Cap Trust, Inc. (US:RMT) , Morgan Stanley Emerging Markets Domestic Debt Fund, Inc. (US:EDD) , and Warner Bros. Discovery, Inc. (US:WBD) .
Meilleures augmentations ce trimestre
Nous utilisons la variation de l'allocation du portefeuille car il s'agit de l'indicateur le plus significatif. Les changements peuvent être dus à des transactions ou à des variations de prix des actions.
| Titre | Actions (en millions) |
Valeur ($ en millions) |
% du portefeuille | ΔPortefeuille % |
|---|---|---|---|---|
| 0,36 | 18,64 | 16,7036 | 2,0224 | |
| 0,03 | 1,51 | 1,3520 | 1,0325 | |
| 0,25 | 12,19 | 10,9175 | 0,9926 | |
| 0,01 | 3,73 | 3,3378 | 0,4359 | |
| 0,03 | 2,45 | 2,1968 | 0,2096 | |
| 0,09 | 2,06 | 1,8477 | 0,2082 | |
| 0,00 | 0,56 | 0,5020 | 0,1531 | |
| 0,01 | 0,65 | 0,5811 | 0,1473 | |
| 0,01 | 0,56 | 0,5011 | 0,1028 | |
| 0,13 | 1,93 | 1,7253 | 0,0838 |
Principales baisses ce trimestre
Nous utilisons la variation de l'allocation du portefeuille car il s'agit de l'indicateur le plus significatif. Les changements peuvent être dus à des transactions ou à des variations de prix des actions.
| Titre | Actions (en millions) |
Valeur ($ en millions) |
% du portefeuille | ΔPortefeuille % |
|---|---|---|---|---|
| 0,03 | 1,30 | 1,1660 | -0,6781 | |
| 0,04 | 2,76 | 2,4769 | -0,6191 | |
| 0,02 | 3,64 | 3,2573 | -0,5540 | |
| 0,04 | 1,24 | 1,1117 | -0,5522 | |
| 0,43 | 3,10 | 2,7731 | -0,5326 | |
| 0,01 | 2,96 | 2,6474 | -0,4099 | |
| 0,01 | 1,84 | 1,6467 | -0,3972 | |
| 0,06 | 3,92 | 3,5076 | -0,2795 | |
| 0,01 | 0,50 | 0,4441 | -0,2526 | |
| 0,01 | 2,38 | 2,1338 | -0,2216 |
Déclarations 13F et dépôts de fonds
Ce formulaire a été déposé le 2025-08-05 pour la période de déclaration 2025-06-30. Cliquez sur l'icône du lien pour voir l'historique complet des transactions.
Mettre à niveau pour débloquer les données premium et exporter vers Excel ![]() .
.
| Titre | Type | Prix moyen de l'action | Actions (en millions) |
ΔActions (%) |
ΔActions (%) |
Valeur ($ en millions) |
Portefeuille (%) |
ΔPortefeuille (%) |
|
|---|---|---|---|---|---|---|---|---|---|
| NEAR / iShares U.S. ETF Trust - iShares Short Duration Bond Active ETF | 0,36 | 23,79 | 18,64 | 24,34 | 16,7036 | 2,0224 | |||
| ISTB / iShares Trust - iShares Core 1-5 Year USD Bond ETF | 0,25 | 19,48 | 12,19 | 20,22 | 10,9175 | 0,9926 | |||
| RMT / Royce Micro-Cap Trust, Inc. | 0,96 | -1,87 | 8,92 | 7,68 | 7,9878 | -0,1204 | |||
| EDD / Morgan Stanley Emerging Markets Domestic Debt Fund, Inc. | 1,44 | -0,45 | 7,35 | 8,44 | 6,5882 | -0,0513 | |||
| WBD / Warner Bros. Discovery, Inc. | 0,38 | -1,16 | 4,40 | 5,56 | 3,9462 | -0,1395 | |||
| GOOGL / Alphabet Inc. | 0,02 | -2,91 | 4,17 | 10,64 | 3,7364 | 0,0456 | |||
| CVS / CVS Health Corporation | 0,06 | -0,58 | 3,92 | 1,24 | 3,5076 | -0,2795 | |||
| MSFT / Microsoft Corporation | 0,01 | -5,13 | 3,73 | 25,72 | 3,3378 | 0,4359 | |||
| ALL / The Allstate Corporation | 0,02 | -3,92 | 3,64 | -6,60 | 3,2573 | -0,5540 | |||
| RLJ / RLJ Lodging Trust | 0,43 | -0,63 | 3,10 | -8,32 | 2,7731 | -0,5326 | |||
| VTRS / Viatris Inc. | 0,33 | -0,64 | 2,96 | 1,90 | 2,6483 | -0,1931 | |||
| JPM / JPMorgan Chase & Co. | 0,01 | -19,92 | 2,96 | -5,35 | 2,6474 | -0,4099 | |||
| CSCO / Cisco Systems, Inc. | 0,04 | -22,23 | 2,76 | -12,56 | 2,4769 | -0,6191 | |||
| OMC / Omnicom Group Inc. | 0,03 | 39,25 | 2,45 | 20,85 | 2,1968 | 0,2096 | |||
| CI / The Cigna Group | 0,01 | -1,46 | 2,38 | -1,00 | 2,1338 | -0,2216 | |||
| BEN / Franklin Resources, Inc. | 0,09 | -0,59 | 2,06 | 23,18 | 1,8477 | 0,2082 | |||
| EMF / Templeton Emerging Markets Fund | 0,13 | 1,17 | 1,93 | 14,86 | 1,7253 | 0,0838 | |||
| AMGN / Amgen Inc. | 0,01 | -1,75 | 1,84 | -11,93 | 1,6467 | -0,3972 | |||
| MEAR / iShares U.S. ETF Trust - iShares Short Maturity Municipal Bond Active ETF | 0,03 | 362,20 | 1,51 | 362,88 | 1,3520 | 1,0325 | |||
| PVH / PVH Corp. | 0,02 | -0,63 | 1,41 | 5,48 | 1,2601 | -0,0458 | |||
| MAN / ManpowerGroup Inc. | 0,03 | -0,99 | 1,30 | -30,91 | 1,1660 | -0,6781 | |||
| CRI / Carter's, Inc. | 0,04 | -0,88 | 1,24 | -27,02 | 1,1117 | -0,5522 | |||
| VSH / Vishay Intertechnology, Inc. | 0,07 | -0,62 | 1,12 | -0,71 | 0,9992 | -0,1010 | |||
| AXP / American Express Company | 0,00 | -6,03 | 1,11 | 11,42 | 0,9968 | 0,0189 | |||
| QRVO / Qorvo, Inc. | 0,01 | -0,88 | 1,11 | 16,19 | 0,9906 | 0,0592 | |||
| MDT / Medtronic plc | 0,01 | -1,18 | 1,10 | -4,12 | 0,9814 | -0,1375 | |||
| LH / Labcorp Holdings Inc. | 0,00 | -2,37 | 1,08 | 10,07 | 0,9699 | 0,0073 | |||
| BWG / Legg Mason BW Global Income Opportunities Fund Inc. | 0,13 | -0,21 | 1,06 | -0,65 | 0,9524 | -0,0958 | |||
| SWKS / Skyworks Solutions, Inc. | 0,01 | -0,83 | 0,89 | 14,34 | 0,7935 | 0,0350 | |||
| QQQ / Invesco QQQ Trust, Series 1 | 0,00 | -1,12 | 0,68 | 16,27 | 0,6089 | 0,0368 | |||
| EFA / iShares Trust - iShares MSCI EAFE ETF | 0,01 | 33,85 | 0,65 | 46,28 | 0,5811 | 0,1473 | |||
| AEF / abrdn Emerging Markets ex-China Fund, Inc. | 0,10 | 0,00 | 0,59 | 19,76 | 0,5327 | 0,0466 | |||
| SPY / SPDR S&P 500 ETF | 0,00 | 42,39 | 0,56 | 57,30 | 0,5020 | 0,1531 | |||
| IJR / iShares Trust - iShares Core S&P Small-Cap ETF | 0,01 | 31,57 | 0,56 | 37,68 | 0,5011 | 0,1028 | |||
| VEA / Vanguard Tax-Managed Funds - Vanguard FTSE Developed Markets ETF | 0,01 | 0,00 | 0,52 | 12,12 | 0,4648 | 0,0119 | |||
| PID / Invesco Exchange-Traded Fund Trust - Invesco International Dividend Achievers ETF | 0,03 | 0,04 | 0,52 | 7,48 | 0,4638 | -0,0075 | |||
| C / Citigroup Inc. | 0,01 | -41,89 | 0,50 | -30,38 | 0,4441 | -0,2526 | |||
| RVT / Royce Small-Cap Trust, Inc. | 0,03 | 2,00 | 0,49 | 8,02 | 0,4346 | -0,0060 | |||
| VGT / Vanguard World Fund - Vanguard Information Technology ETF | 0,00 | 0,00 | 0,44 | 22,22 | 0,3946 | 0,0419 | |||
| EEM / iShares, Inc. - iShares MSCI Emerging Markets ETF | 0,01 | 0,00 | 0,36 | 10,59 | 0,3183 | 0,0032 | |||
| QCOM / QUALCOMM Incorporated | 0,00 | 0,00 | 0,31 | 3,36 | 0,2768 | -0,0150 | |||
| ILF / iShares Trust - iShares Latin America 40 ETF | 0,01 | 0,00 | 0,30 | 11,15 | 0,2687 | 0,0048 | |||
| DNP / DNP Select Income Fund Inc. | 0,03 | 0,00 | 0,29 | -0,69 | 0,2589 | -0,0270 | |||
| AAPL / Apple Inc. | 0,00 | -13,25 | 0,28 | -19,89 | 0,2527 | -0,0920 | |||
| VWO / Vanguard International Equity Index Funds - Vanguard FTSE Emerging Markets ETF | 0,01 | 0,00 | 0,28 | 9,52 | 0,2474 | -0,0000 | |||
| NHI / National Health Investors, Inc. | 0,00 | 0,00 | 0,27 | -5,21 | 0,2454 | -0,0371 | |||
| IJH / iShares Trust - iShares Core S&P Mid-Cap ETF | 0,00 | 0,00 | 0,26 | 6,05 | 0,2365 | -0,0067 | |||
| IVE / iShares Trust - iShares S&P 500 Value ETF | 0,00 | 0,00 | 0,26 | 2,73 | 0,2360 | -0,0155 | |||
| VNQ / Vanguard Specialized Funds - Vanguard Real Estate ETF | 0,00 | 0,00 | 0,26 | -1,89 | 0,2335 | -0,0259 | |||
| IWN / iShares Trust - iShares Russell 2000 Value ETF | 0,00 | 0,00 | 0,25 | 4,70 | 0,2198 | -0,0101 | |||
| PSA / Public Storage | 0,00 | -0,86 | 0,24 | -2,89 | 0,2111 | -0,0263 | |||
| XLE / The Select Sector SPDR Trust - The Energy Select Sector SPDR Fund | 0,00 | 0,00 | 0,23 | -9,30 | 0,2101 | -0,0429 | |||
| MDY / SPDR S&P MidCap 400 ETF Trust | 0,00 | 0,00 | 0,23 | 6,05 | 0,2050 | -0,0060 |