Statistiques de base
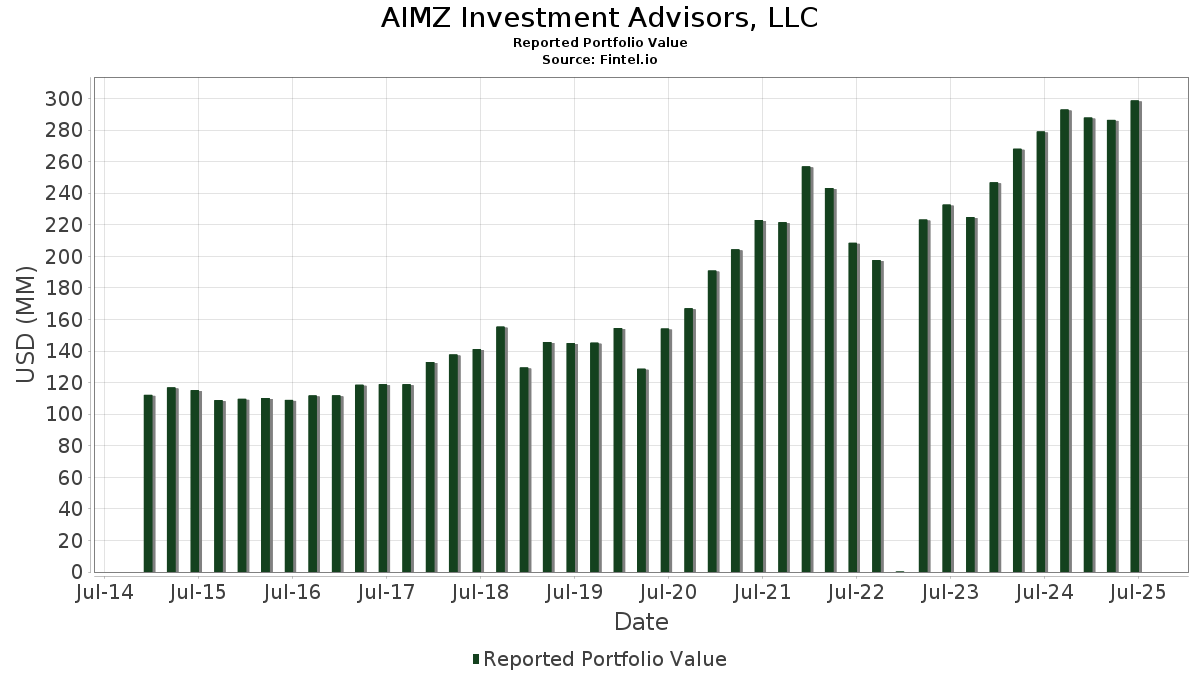
| Valeur du portefeuille | $ 298 691 462 |
| Positions actuelles | 130 |
Dernières positions, performances, ASG (à partir des dépôts 13F, 13D)
AIMZ Investment Advisors, LLC a déclaré un total de 130 positions dans ses derniers dépôts auprès de la SEC. La valeur la plus récente du portefeuille est calculée à 298 691 462 USD. Les actifs sous gestion réels (ASG) sont cette valeur plus les liquidités (qui ne sont pas divulguées). Les principales positions de AIMZ Investment Advisors, LLC sont Meta Platforms, Inc. (US:META) , Apple Inc. (US:AAPL) , Microsoft Corporation (US:MSFT) , QUALCOMM Incorporated (US:QCOM) , and Vertex Pharmaceuticals Incorporated (US:VRTX) . Les nouvelles positions de AIMZ Investment Advisors, LLC incluent Ubiquiti Inc. (US:UI) , .
Meilleures augmentations ce trimestre
Nous utilisons la variation de l'allocation du portefeuille car il s'agit de l'indicateur le plus significatif. Les changements peuvent être dus à des transactions ou à des variations de prix des actions.
| Titre | Actions (en millions) |
Valeur ($ en millions) |
% du portefeuille | ΔPortefeuille % |
|---|---|---|---|---|
| 0,03 | 14,38 | 4,8151 | 0,9722 | |
| 0,03 | 19,34 | 6,4749 | 0,9696 | |
| 0,01 | 5,69 | 1,9035 | 0,3850 | |
| 0,01 | 3,01 | 1,0066 | 0,2963 | |
| 0,06 | 6,14 | 2,0551 | 0,2686 | |
| 0,00 | 2,78 | 0,9307 | 0,2548 | |
| 0,04 | 3,14 | 1,0501 | 0,2499 | |
| 0,05 | 8,53 | 2,8567 | 0,2330 | |
| 0,02 | 3,03 | 1,0151 | 0,2089 | |
| 0,02 | 5,37 | 1,7963 | 0,1859 |
Principales baisses ce trimestre
Nous utilisons la variation de l'allocation du portefeuille car il s'agit de l'indicateur le plus significatif. Les changements peuvent être dus à des transactions ou à des variations de prix des actions.
| Titre | Actions (en millions) |
Valeur ($ en millions) |
% du portefeuille | ΔPortefeuille % |
|---|---|---|---|---|
| 0,09 | 17,60 | 5,8921 | -0,7946 | |
| 0,02 | 9,23 | 3,0892 | -0,4571 | |
| 0,01 | 5,17 | 1,7320 | -0,4500 | |
| 0,03 | 2,78 | 0,9301 | -0,3330 | |
| 0,05 | 2,45 | 0,8190 | -0,3082 | |
| 0,01 | 5,18 | 1,7333 | -0,2735 | |
| 0,01 | 3,66 | 1,2265 | -0,2114 | |
| 0,07 | 7,21 | 2,4135 | -0,1871 | |
| 0,01 | 2,52 | 0,8428 | -0,1773 | |
| 0,02 | 2,92 | 0,9760 | -0,1726 |
Déclarations 13F et dépôts de fonds
Ce formulaire a été déposé le 2025-08-12 pour la période de déclaration 2025-06-30. Cliquez sur l'icône du lien pour voir l'historique complet des transactions.
Mettre à niveau pour débloquer les données premium et exporter vers Excel ![]() .
.
| Titre | Type | Prix moyen de l'action | Actions (en millions) |
ΔActions (%) |
ΔActions (%) |
Valeur ($ en millions) |
Portefeuille (%) |
ΔPortefeuille (%) |
|
|---|---|---|---|---|---|---|---|---|---|
| META / Meta Platforms, Inc. | 0,03 | -4,23 | 19,34 | 22,65 | 6,4749 | 0,9696 | |||
| AAPL / Apple Inc. | 0,09 | -0,51 | 17,60 | -8,11 | 5,8921 | -0,7946 | |||
| MSFT / Microsoft Corporation | 0,03 | -1,39 | 14,38 | 30,67 | 4,8151 | 0,9722 | |||
| QCOM / QUALCOMM Incorporated | 0,06 | -0,93 | 9,25 | 2,72 | 3,0983 | -0,0473 | |||
| VRTX / Vertex Pharmaceuticals Incorporated | 0,02 | -1,07 | 9,23 | -9,16 | 3,0892 | -0,4571 | |||
| GOOG / Alphabet Inc. | 0,05 | 0,00 | 8,53 | 13,55 | 2,8567 | 0,2330 | |||
| GOOGL / Alphabet Inc. | 0,04 | -1,51 | 7,47 | 12,25 | 2,5004 | 0,1773 | |||
| GILD / Gilead Sciences, Inc. | 0,07 | -2,19 | 7,21 | -3,22 | 2,4135 | -0,1871 | |||
| NTAP / NetApp, Inc. | 0,06 | -1,10 | 6,14 | 19,95 | 2,0551 | 0,2686 | |||
| CTAS / Cintas Corporation | 0,03 | -1,88 | 5,82 | 6,40 | 1,9473 | 0,0387 | |||
| ADBE / Adobe Inc. | 0,01 | 29,59 | 5,69 | 30,72 | 1,9035 | 0,3850 | |||
| INFY / Infosys Limited - Depositary Receipt (Common Stock) | 0,31 | -0,65 | 5,66 | 0,87 | 1,8947 | -0,0641 | |||
| IBM / International Business Machines Corporation | 0,02 | -1,88 | 5,37 | 16,33 | 1,7963 | 0,1859 | |||
| CHKP / Check Point Software Technologies Ltd. | 0,02 | -0,49 | 5,18 | -3,41 | 1,7351 | -0,1380 | |||
| BRK.B / Berkshire Hathaway Inc. | 0,01 | -1,25 | 5,18 | -9,93 | 1,7333 | -0,2735 | |||
| REGN / Regeneron Pharmaceuticals, Inc. | 0,01 | 0,00 | 5,17 | -17,22 | 1,7320 | -0,4500 | |||
| CSCO / Cisco Systems, Inc. | 0,07 | -1,12 | 4,87 | 11,17 | 1,6292 | 0,1009 | |||
| TROW / T. Rowe Price Group, Inc. | 0,05 | -1,16 | 4,74 | 3,81 | 1,5878 | -0,0071 | |||
| INCY / Incyte Corporation | 0,07 | -0,98 | 4,65 | 11,36 | 1,5560 | 0,0990 | |||
| WMT / Walmart Inc. | 0,05 | -3,60 | 4,63 | 7,37 | 1,5503 | 0,0445 | |||
| EXPD / Expeditors International of Washington, Inc. | 0,04 | -0,89 | 4,40 | -5,84 | 1,4737 | -0,1584 | |||
| CHRW / C.H. Robinson Worldwide, Inc. | 0,04 | -0,58 | 4,06 | -6,84 | 1,3587 | -0,1623 | |||
| PYPL / PayPal Holdings, Inc. | 0,05 | -1,51 | 4,01 | 12,16 | 1,3431 | 0,0945 | |||
| AZN / AstraZeneca PLC - Depositary Receipt (Common Stock) | 0,06 | -0,46 | 4,01 | -5,36 | 1,3413 | -0,1367 | |||
| EPAM / EPAM Systems, Inc. | 0,02 | -0,53 | 3,95 | 4,17 | 1,3219 | -0,0015 | |||
| TEVA / Teva Pharmaceutical Industries Limited - Depositary Receipt (Common Stock) | 0,22 | -0,62 | 3,76 | 8,38 | 1,2600 | 0,0475 | |||
| AMGN / Amgen Inc. | 0,01 | -0,75 | 3,66 | -11,05 | 1,2265 | -0,2114 | |||
| SYK / Stryker Corporation | 0,01 | -0,09 | 3,61 | 6,20 | 1,2095 | 0,0217 | |||
| GMAB / Genmab A/S - Depositary Receipt (Common Stock) | 0,17 | -1,13 | 3,43 | 4,32 | 1,1474 | 0,0004 | |||
| URBN / Urban Outfitters, Inc. | 0,04 | -1,14 | 3,14 | 36,88 | 1,0501 | 0,2499 | |||
| CI / The Cigna Group | 0,01 | -1,09 | 3,10 | -0,61 | 1,0387 | -0,0511 | |||
| NVDA / NVIDIA Corporation | 0,02 | -9,92 | 3,03 | 31,31 | 1,0151 | 0,2089 | |||
| ORCL / Oracle Corporation | 0,01 | -5,50 | 3,01 | 47,79 | 1,0066 | 0,2963 | |||
| ABBV / AbbVie Inc. | 0,02 | 0,03 | 2,92 | -11,37 | 0,9760 | -0,1726 | |||
| NFLX / Netflix, Inc. | 0,00 | 0,00 | 2,78 | 43,67 | 0,9307 | 0,2548 | |||
| GLOB / Globant S.A. | 0,03 | -0,49 | 2,78 | -23,20 | 0,9301 | -0,3330 | |||
| LOW / Lowe's Companies, Inc. | 0,01 | 0,02 | 2,60 | -4,86 | 0,8709 | -0,0837 | |||
| UNH / UnitedHealth Group Incorporated | 0,01 | 44,66 | 2,52 | -13,83 | 0,8428 | -0,1773 | |||
| BMY / Bristol-Myers Squibb Company | 0,05 | -0,16 | 2,45 | -24,23 | 0,8190 | -0,3082 | |||
| DLB / Dolby Laboratories, Inc. | 0,03 | 0,01 | 2,38 | -7,53 | 0,7973 | -0,1018 | |||
| GSK / GSK plc - Depositary Receipt (Common Stock) | 0,06 | -0,63 | 2,38 | -1,49 | 0,7954 | -0,0467 | |||
| ADI / Analog Devices, Inc. | 0,01 | -4,82 | 2,35 | 12,36 | 0,7852 | 0,0563 | |||
| EEFT / Euronet Worldwide, Inc. | 0,02 | 0,00 | 2,32 | -5,12 | 0,7756 | -0,0769 | |||
| VOE / Vanguard Index Funds - Vanguard Mid-Cap Value ETF | 0,01 | -7,37 | 2,30 | -5,09 | 0,7684 | -0,0760 | |||
| ABT / Abbott Laboratories | 0,02 | -0,59 | 2,26 | 1,94 | 0,7552 | -0,0175 | |||
| JNJ / Johnson & Johnson | 0,01 | -0,22 | 2,22 | -8,12 | 0,7431 | -0,1001 | |||
| ITW / Illinois Tool Works Inc. | 0,01 | -0,53 | 2,21 | -0,85 | 0,7387 | -0,0382 | |||
| MRK / Merck & Co., Inc. | 0,03 | -2,10 | 2,08 | -13,67 | 0,6979 | -0,1451 | |||
| TDY / Teledyne Technologies Incorporated | 0,00 | -0,10 | 2,06 | 2,84 | 0,6907 | -0,0098 | |||
| EMR / Emerson Electric Co. | 0,01 | -0,45 | 1,93 | 21,07 | 0,6467 | 0,0896 | |||
| VYM / Vanguard Whitehall Funds - Vanguard High Dividend Yield ETF | 0,01 | -6,32 | 1,91 | -3,19 | 0,6400 | -0,0492 | |||
| BEN / Franklin Resources, Inc. | 0,08 | -0,14 | 1,91 | 23,74 | 0,6388 | 0,1004 | |||
| KO / The Coca-Cola Company | 0,02 | -0,25 | 1,74 | -1,47 | 0,5821 | -0,0340 | |||
| PEP / PepsiCo, Inc. | 0,01 | -0,25 | 1,72 | -12,14 | 0,5746 | -0,1076 | |||
| SBUX / Starbucks Corporation | 0,02 | -2,59 | 1,72 | -9,02 | 0,5742 | -0,0839 | |||
| VTV / Vanguard Index Funds - Vanguard Value ETF | 0,01 | -7,99 | 1,70 | -5,88 | 0,5687 | -0,0613 | |||
| DOX / Amdocs Limited | 0,02 | -0,26 | 1,66 | -0,54 | 0,5541 | -0,0269 | |||
| PRLB / Proto Labs, Inc. | 0,04 | -3,02 | 1,64 | 10,83 | 0,5483 | 0,0323 | |||
| HD / The Home Depot, Inc. | 0,00 | -2,20 | 1,63 | -2,16 | 0,5462 | -0,0360 | |||
| NVS / Novartis AG - Depositary Receipt (Common Stock) | 0,01 | -0,18 | 1,61 | 8,33 | 0,5400 | 0,0203 | |||
| VIG / Vanguard Specialized Funds - Vanguard Dividend Appreciation ETF | 0,01 | -9,28 | 1,58 | -4,29 | 0,5305 | -0,0475 | |||
| SPGI / S&P Global Inc. | 0,00 | -1,96 | 1,58 | 1,74 | 0,5289 | -0,0132 | |||
| MDT / Medtronic plc | 0,02 | -0,17 | 1,54 | -3,14 | 0,5171 | -0,0397 | |||
| XOM / Exxon Mobil Corporation | 0,01 | -0,23 | 1,40 | -9,55 | 0,4692 | -0,0719 | |||
| VHT / Vanguard World Fund - Vanguard Health Care ETF | 0,01 | -9,72 | 1,29 | -15,31 | 0,4317 | -0,0999 | |||
| AMZN / Amazon.com, Inc. | 0,01 | 4,75 | 1,28 | 20,81 | 0,4278 | 0,0584 | |||
| PRF / Invesco Exchange-Traded Fund Trust - Invesco RAFI US 1000 ETF | 0,03 | 0,00 | 1,06 | 4,55 | 0,3538 | 0,0011 | |||
| WFC / Wells Fargo & Company | 0,01 | 0,00 | 0,92 | 11,66 | 0,3077 | 0,0202 | |||
| TSLA / Tesla, Inc. | 0,00 | -0,35 | 0,91 | 22,25 | 0,3054 | 0,0447 | |||
| KLAC / KLA Corporation | 0,00 | 0,00 | 0,90 | 31,87 | 0,3020 | 0,0630 | |||
| WIT / Wipro Limited - Depositary Receipt (Common Stock) | 0,29 | 0,00 | 0,89 | -1,34 | 0,2969 | -0,0168 | |||
| JPM / JPMorgan Chase & Co. | 0,00 | 0,00 | 0,84 | 18,19 | 0,2808 | 0,0330 | |||
| BAC / Bank of America Corporation | 0,02 | 0,00 | 0,83 | 13,32 | 0,2795 | 0,0225 | |||
| PLTR / Palantir Technologies Inc. | 0,01 | 0,00 | 0,83 | 61,67 | 0,2784 | 0,0986 | |||
| USMV / iShares Trust - iShares MSCI USA Min Vol Factor ETF | 0,01 | 0,00 | 0,75 | 0,27 | 0,2522 | -0,0102 | |||
| COST / Costco Wholesale Corporation | 0,00 | -3,31 | 0,72 | 1,12 | 0,2419 | -0,0074 | |||
| MMM / 3M Company | 0,00 | -1,05 | 0,71 | 2,59 | 0,2392 | -0,0040 | |||
| INTC / Intel Corporation | 0,03 | -1,68 | 0,70 | -3,06 | 0,2339 | -0,0176 | |||
| UPS / United Parcel Service, Inc. | 0,01 | 0,00 | 0,68 | -8,22 | 0,2281 | -0,0311 | |||
| DLTR / Dollar Tree, Inc. | 0,01 | -0,36 | 0,68 | 31,46 | 0,2270 | 0,0469 | |||
| HLN / Haleon plc - Depositary Receipt (Common Stock) | 0,06 | -2,56 | 0,67 | -1,76 | 0,2241 | -0,0139 | |||
| EBAY / eBay Inc. | 0,01 | 0,02 | 0,67 | 9,92 | 0,2228 | 0,0115 | |||
| MRVL / Marvell Technology, Inc. | 0,01 | 0,00 | 0,61 | 25,87 | 0,2053 | 0,0350 | |||
| VEU / Vanguard International Equity Index Funds - Vanguard FTSE All-World ex-US ETF | 0,01 | -4,23 | 0,60 | 6,23 | 0,1999 | 0,0035 | |||
| SPY / SPDR S&P 500 ETF | 0,00 | -3,75 | 0,57 | 6,33 | 0,1913 | 0,0036 | |||
| HIPO / Hippo Holdings Inc. | 0,02 | 0,00 | 0,56 | 9,30 | 0,1890 | 0,0086 | |||
| QQQ / Invesco QQQ Trust, Series 1 | 0,00 | 0,10 | 0,56 | 17,55 | 0,1865 | 0,0212 | |||
| ISRG / Intuitive Surgical, Inc. | 0,00 | 0,00 | 0,54 | 9,59 | 0,1801 | 0,0089 | |||
| ADP / Automatic Data Processing, Inc. | 0,00 | 0,00 | 0,52 | 0,97 | 0,1740 | -0,0058 | |||
| WBA / Walgreens Boots Alliance, Inc. | 0,04 | -1,19 | 0,48 | 1,69 | 0,1611 | -0,0043 | |||
| MCD / McDonald's Corporation | 0,00 | -8,44 | 0,48 | -14,41 | 0,1591 | -0,0347 | |||
| VUG / Vanguard Index Funds - Vanguard Growth ETF | 0,00 | -5,70 | 0,47 | 11,35 | 0,1579 | 0,0102 | |||
| LLY / Eli Lilly and Company | 0,00 | 0,00 | 0,46 | -5,60 | 0,1525 | -0,0160 | |||
| V / Visa Inc. | 0,00 | 0,00 | 0,43 | 1,18 | 0,1432 | -0,0042 | |||
| PRFZ / Invesco Exchange-Traded Fund Trust - Invesco RAFI US 1500 Small-Mid ETF | 0,01 | 0,00 | 0,43 | 7,56 | 0,1430 | 0,0042 | |||
| CPRI / Capri Holdings Limited | 0,02 | 0,00 | 0,42 | -10,45 | 0,1409 | -0,0229 | |||
| WAL / Western Alliance Bancorporation | 0,01 | 0,00 | 0,41 | 1,73 | 0,1376 | -0,0038 | |||
| MA / Mastercard Incorporated | 0,00 | 0,00 | 0,40 | 2,56 | 0,1343 | -0,0023 | |||
| PPL / PPL Corporation | 0,01 | -0,58 | 0,39 | -6,55 | 0,1290 | -0,0152 | |||
| PFE / Pfizer Inc. | 0,02 | -0,41 | 0,38 | -4,75 | 0,1277 | -0,0121 | |||
| AMAT / Applied Materials, Inc. | 0,00 | 0,00 | 0,38 | 26,17 | 0,1260 | 0,0218 | |||
| SRE / Sempra | 0,00 | 0,00 | 0,37 | 6,29 | 0,1246 | 0,0022 | |||
| SHEL / Shell plc - Depositary Receipt (Common Stock) | 0,01 | 0,00 | 0,37 | -3,89 | 0,1243 | -0,0106 | |||
| AVGO / Broadcom Inc. | 0,00 | 0,00 | 0,36 | 65,12 | 0,1190 | 0,0436 | |||
| T / AT&T Inc. | 0,01 | -4,14 | 0,33 | -1,77 | 0,1116 | -0,0070 | |||
| SCHV / Schwab Strategic Trust - Schwab U.S. Large-Cap Value ETF | 0,01 | 0,00 | 0,32 | 3,96 | 0,1056 | -0,0002 | |||
| AFL / Aflac Incorporated | 0,00 | 0,00 | 0,30 | -5,40 | 0,1001 | -0,0100 | |||
| HON / Honeywell International Inc. | 0,00 | 0,00 | 0,29 | 10,19 | 0,0978 | 0,0051 | |||
| GE / General Electric Company | 0,00 | 0,00 | 0,28 | 28,64 | 0,0950 | 0,0180 | |||
| PG / The Procter & Gamble Company | 0,00 | -3,11 | 0,28 | -9,45 | 0,0932 | -0,0141 | |||
| NOC / Northrop Grumman Corporation | 0,00 | 0,00 | 0,26 | -2,58 | 0,0887 | -0,0060 | |||
| CVX / Chevron Corporation | 0,00 | 0,00 | 0,26 | -14,43 | 0,0855 | -0,0187 | |||
| COP / ConocoPhillips | 0,00 | 0,00 | 0,25 | -14,58 | 0,0845 | -0,0186 | |||
| DELL / Dell Technologies Inc. | 0,00 | 0,24 | 0,0820 | 0,0820 | |||||
| XCOR / FundX Investment Trust - FundX ETF | 0,00 | 0,00 | 0,24 | 11,74 | 0,0798 | 0,0054 | |||
| PNC / The PNC Financial Services Group, Inc. | 0,00 | 0,00 | 0,23 | 6,39 | 0,0780 | 0,0013 | |||
| SPR / Spirit AeroSystems Holdings, Inc. | 0,01 | 0,00 | 0,23 | 10,48 | 0,0779 | 0,0045 | |||
| DIS / The Walt Disney Company | 0,00 | 0,23 | 0,0756 | 0,0756 | |||||
| VZ / Verizon Communications Inc. | 0,01 | 0,00 | 0,23 | -4,66 | 0,0755 | -0,0070 | |||
| UI / Ubiquiti Inc. | 0,00 | 0,22 | 0,0724 | 0,0724 | |||||
| ALL / The Allstate Corporation | 0,00 | 0,00 | 0,21 | -2,76 | 0,0708 | -0,0051 | |||
| HDV / iShares Trust - iShares Core High Dividend ETF | 0,00 | 0,56 | 0,21 | -2,80 | 0,0698 | -0,0050 | |||
| TRV / The Travelers Companies, Inc. | 0,00 | 0,00 | 0,21 | 1,46 | 0,0697 | -0,0021 | |||
| MYGN / Myriad Genetics, Inc. | 0,04 | 0,00 | 0,21 | -40,06 | 0,0697 | -0,0517 | |||
| WRB / W. R. Berkley Corporation | 0,00 | -17,04 | 0,21 | -14,58 | 0,0689 | -0,0150 | |||
| GPN / Global Payments Inc. | 0,00 | 0,20 | 0,0685 | 0,0685 | |||||
| TXN / Texas Instruments Incorporated | 0,00 | 0,20 | 0,0678 | 0,0678 | |||||
| MET / MetLife, Inc. | 0,00 | 0,20 | 0,0670 | 0,0670 | |||||
| KSS / Kohl's Corporation | 0,01 | -0,26 | 0,13 | 3,28 | 0,0425 | -0,0004 | |||
| NOK / Nokia Oyj - Depositary Receipt (Common Stock) | 0,02 | 0,00 | 0,10 | -2,00 | 0,0331 | -0,0020 | |||
| SGOV / iShares Trust - iShares 0-3 Month Treasury Bond ETF | 0,00 | -100,00 | 0,00 | 0,0000 |