Statistiques de base
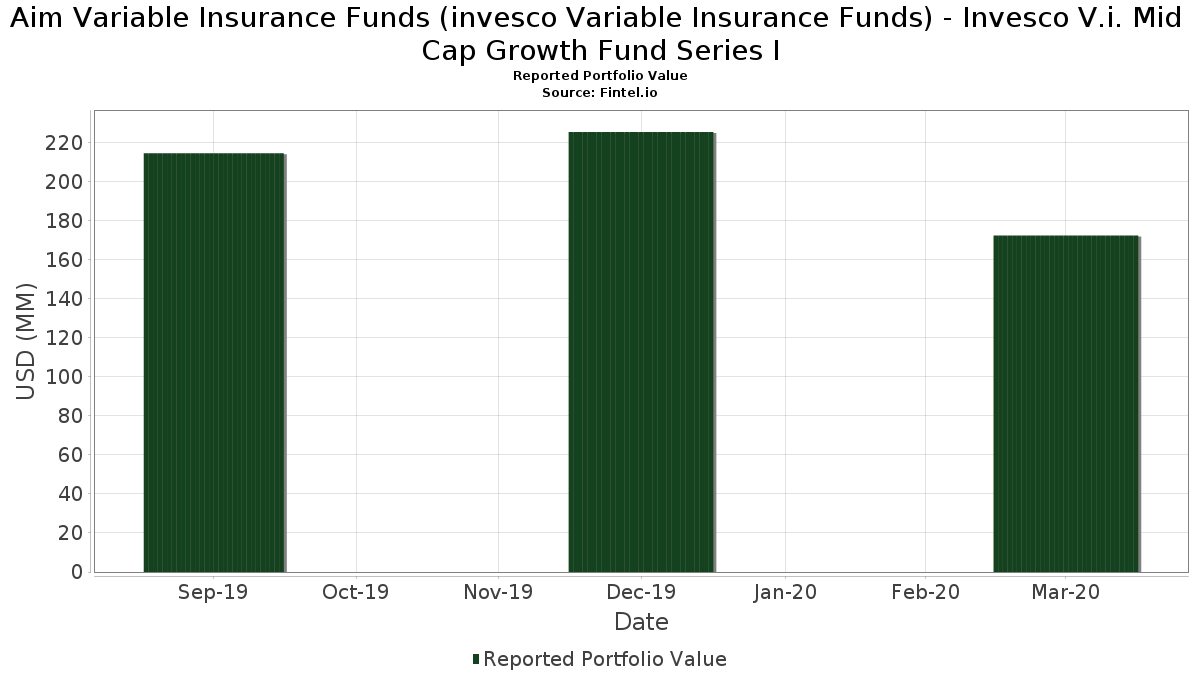
| Valeur du portefeuille | $ 172 450 544 |
| Positions actuelles | 90 |
Dernières positions, performances, ASG (à partir des dépôts 13F, 13D)
Aim Variable Insurance Funds (invesco Variable Insurance Funds) - Invesco V.i. Mid Cap Growth Fund Series I a déclaré un total de 90 positions dans ses derniers dépôts auprès de la SEC. La valeur la plus récente du portefeuille est calculée à 172 450 544 USD. Les actifs sous gestion réels (ASG) sont cette valeur plus les liquidités (qui ne sont pas divulguées). Les principales positions de Aim Variable Insurance Funds (invesco Variable Insurance Funds) - Invesco V.i. Mid Cap Growth Fund Series I sont DexCom, Inc. (US:DXCM) , RingCentral, Inc. (US:RNG) , CoStar Group, Inc. (US:CSGP) , Pool Corporation (US:POOL) , and Synopsys, Inc. (US:SNPS) . Les nouvelles positions de Aim Variable Insurance Funds (invesco Variable Insurance Funds) - Invesco V.i. Mid Cap Growth Fund Series I incluent ResMed Inc. (US:RMD) , CACI International Inc (US:CACI) , D.R. Horton, Inc. (US:DHI) , Lamb Weston Holdings, Inc. (US:LW) , and Domino's Pizza, Inc. (US:DPZ) .
Meilleures augmentations ce trimestre
Nous utilisons la variation de l'allocation du portefeuille car il s'agit de l'indicateur le plus significatif. Les changements peuvent être dus à des transactions ou à des variations de prix des actions.
| Titre | Actions (en millions) |
Valeur ($ en millions) |
% du portefeuille | ΔPortefeuille % |
|---|---|---|---|---|
| 0,02 | 2,53 | 1,4642 | 1,4642 | |
| 0,01 | 1,62 | 0,9399 | 0,9399 | |
| 0,02 | 4,96 | 2,8712 | 0,8057 | |
| 0,04 | 1,30 | 0,7540 | 0,7540 | |
| 0,02 | 3,09 | 1,7916 | 0,7309 | |
| 1,80 | 1,80 | 1,0440 | 0,7235 | |
| 0,01 | 2,95 | 1,7060 | 0,6944 | |
| 0,02 | 1,19 | 0,6909 | 0,6909 | |
| 0,00 | 1,18 | 0,6835 | 0,6835 | |
| 0,00 | 2,82 | 1,6303 | 0,6611 |
Principales baisses ce trimestre
Nous utilisons la variation de l'allocation du portefeuille car il s'agit de l'indicateur le plus significatif. Les changements peuvent être dus à des transactions ou à des variations de prix des actions.
| Titre | Actions (en millions) |
Valeur ($ en millions) |
% du portefeuille | ΔPortefeuille % |
|---|---|---|---|---|
| 0,00 | 0,81 | 0,4701 | -1,4217 | |
| 0,00 | 0,00 | -1,2419 | ||
| 0,01 | 1,77 | 1,0267 | -1,2315 | |
| 0,00 | 0,00 | -1,0921 | ||
| 0,00 | 0,00 | -1,0001 | ||
| 0,00 | 0,00 | -0,9387 | ||
| 0,02 | 1,52 | 0,8812 | -0,8845 | |
| 0,01 | 0,85 | 0,4897 | -0,8465 | |
| 0,00 | 0,00 | -0,7989 | ||
| 0,01 | 0,96 | 0,5539 | -0,7452 |
Déclarations 13F et dépôts de fonds
Ce formulaire a été déposé le 2020-06-01 pour la période de déclaration 2020-03-31. Cliquez sur l'icône du lien pour voir l'historique complet des transactions.
Mettre à niveau pour débloquer les données premium et exporter vers Excel ![]() .
.
| Titre | Type | Prix moyen de l'action | Actions (en millions) |
ΔActions (%) |
ΔActions (%) |
Valeur ($ en millions) |
Portefeuille (%) |
ΔPortefeuille (%) |
|
|---|---|---|---|---|---|---|---|---|---|
| DXCM / DexCom, Inc. | 0,02 | -13,53 | 4,96 | 6,44 | 2,8712 | 0,8057 | |||
| RNG / RingCentral, Inc. | 0,02 | -20,02 | 4,30 | 0,49 | 2,4919 | 0,5930 | |||
| CSGP / CoStar Group, Inc. | 0,01 | 0,13 | 3,96 | -1,71 | 2,2932 | 0,5065 | |||
| POOL / Pool Corporation | 0,02 | -1,07 | 3,87 | -8,34 | 2,2412 | 0,3690 | |||
| SNPS / Synopsys, Inc. | 0,03 | -9,45 | 3,75 | -16,23 | 2,1696 | 0,1867 | |||
| MSCI / MSCI Inc. | 0,01 | -17,20 | 3,72 | -7,33 | 2,1531 | 0,3741 | |||
| ROP / Roper Technologies, Inc. | 0,01 | 0,13 | 3,50 | -11,88 | 2,0278 | 0,2662 | |||
| MASI / Masimo Corporation | 0,02 | 15,41 | 3,09 | 29,29 | 1,7916 | 0,7309 | |||
| GPN / Global Payments Inc. | 0,02 | 26,44 | 2,99 | -0,10 | 1,7298 | 0,4038 | |||
| SBAC / SBA Communications Corporation | 0,01 | 15,27 | 2,95 | 29,10 | 1,7060 | 0,6944 | |||
| LULU / lululemon athletica inc. | 0,02 | -11,41 | 2,92 | -27,52 | 1,6913 | -0,0953 | |||
| TEAM / Atlassian Corporation | 0,02 | 0,13 | 2,92 | 14,20 | 1,6906 | 0,5571 | |||
| STE / STERIS plc | 0,02 | 25,06 | 2,90 | 14,85 | 1,6795 | 0,5597 | |||
| AMD / Advanced Micro Devices, Inc. | 0,06 | -21,25 | 2,89 | -21,90 | 1,6722 | 0,0327 | |||
| LRCX / Lam Research Corporation | 0,01 | -19,41 | 2,87 | -33,85 | 1,6598 | -0,2616 | |||
| CABO / Cable One, Inc. | 0,00 | 16,61 | 2,82 | 28,82 | 1,6303 | 0,6611 | |||
| KLAC / KLA Corporation | 0,02 | -27,80 | 2,77 | -41,76 | 1,6023 | -0,5041 | |||
| MPWR / Monolithic Power Systems, Inc. | 0,02 | 0,12 | 2,71 | -5,81 | 1,5662 | 0,2929 | |||
| RSG / Republic Services, Inc. | 0,04 | 0,13 | 2,70 | -16,14 | 1,5616 | 0,1356 | |||
| CMG / Chipotle Mexican Grill, Inc. | 0,00 | 0,15 | 2,61 | -21,70 | 1,5127 | 0,0333 | |||
| CDW / CDW Corporation | 0,03 | -2,77 | 2,61 | -36,51 | 1,5098 | -0,3112 | |||
| BAH / Booz Allen Hamilton Holding Corporation | 0,04 | 0,13 | 2,60 | -3,38 | 1,5051 | 0,3124 | |||
| WST / West Pharmaceutical Services, Inc. | 0,02 | 13,62 | 2,60 | 15,10 | 1,5047 | 0,5035 | |||
| SPLK / Splunk Inc. | 0,02 | 37,81 | 2,58 | 16,16 | 1,4939 | 0,5091 | |||
| RMD / ResMed Inc. | 0,02 | 2,53 | 1,4642 | 1,4642 | |||||
| TRU / TransUnion | 0,04 | 0,13 | 2,49 | -22,61 | 1,4392 | 0,0155 | |||
| EW / Edwards Lifesciences Corporation | 0,01 | 0,12 | 2,29 | -19,07 | 1,3250 | 0,0716 | |||
| AJG / Arthur J. Gallagher & Co. | 0,03 | -6,42 | 2,25 | -19,89 | 1,3038 | 0,0574 | |||
| TFX / Teleflex Incorporated | 0,01 | 36,88 | 2,25 | 6,50 | 1,3005 | 0,3654 | |||
| CPRT / Copart, Inc. | 0,03 | 0,13 | 2,21 | -24,56 | 1,2768 | -0,0191 | |||
| KSU / Kansas City Southern | 0,02 | 0,13 | 2,17 | -16,84 | 1,2552 | 0,0993 | |||
| ODFL / Old Dominion Freight Line, Inc. | 0,02 | 50,19 | 2,17 | 3,88 | 1,2552 | 0,3300 | |||
| ICLR / ICON Public Limited Company | 0,01 | 0,13 | 2,02 | -20,91 | 1,1711 | 0,0370 | |||
| FRC / First Republic Bank | 0,02 | 13,87 | 1,97 | -20,21 | 1,1429 | 0,0459 | |||
| AME / AMETEK, Inc. | 0,03 | 0,13 | 1,95 | -27,70 | 1,1273 | -0,0666 | |||
| ANSS / ANSYS, Inc. | 0,01 | 0,14 | 1,89 | -9,60 | 1,0957 | 0,1680 | |||
| BFAM / Bright Horizons Family Solutions Inc. | 0,02 | 0,12 | 1,87 | -32,06 | 1,0847 | -0,1376 | |||
| INFO / Harbor ETF Trust - Harbor PanAgora Dynamic Large Cap Core ETF | 0,03 | 0,13 | 1,84 | -20,29 | 1,0668 | 0,0423 | |||
| VEEV / Veeva Systems Inc. | 0,01 | -1,08 | 1,84 | 9,98 | 1,0662 | 0,3238 | |||
| EPAM / EPAM Systems, Inc. | 0,01 | 0,13 | 1,80 | -12,38 | 1,0445 | 0,1318 | |||
| US8252524066 / Invesco Treasury Portfolio, Institutional Class | 1,80 | 149,43 | 1,80 | 149,38 | 1,0440 | 0,7235 | |||
| ORLY / O'Reilly Automotive, Inc. | 0,01 | -49,32 | 1,77 | -65,19 | 1,0267 | -1,2315 | |||
| COUP / Coupa Software Inc | 0,01 | 0,13 | 1,76 | -4,30 | 1,0189 | 0,2034 | |||
| IEX / IDEX Corporation | 0,01 | -15,42 | 1,74 | -32,08 | 1,0064 | -0,1283 | |||
| CSL / Carlisle Companies Incorporated | 0,01 | 0,12 | 1,72 | -22,52 | 0,9985 | 0,0121 | |||
| MKTX / MarketAxess Holdings Inc. | 0,01 | 0,14 | 1,72 | -12,18 | 0,9984 | 0,1281 | |||
| CTAS / Cintas Corporation | 0,01 | -22,26 | 1,72 | -49,97 | 0,9969 | -0,5284 | |||
| BIO / Bio-Rad Laboratories, Inc. | 0,00 | -14,26 | 1,72 | -18,78 | 0,9944 | 0,0570 | |||
| ARE / Alexandria Real Estate Equities, Inc. | 0,01 | 0,12 | 1,66 | -15,08 | 0,9617 | 0,0947 | |||
| BURL / Burlington Stores, Inc. | 0,01 | 32,07 | 1,65 | -8,25 | 0,9532 | 0,1579 | |||
| CACI / CACI International Inc | 0,01 | 1,62 | 0,9399 | 0,9399 | |||||
| FMC / FMC Corporation | 0,02 | 43,20 | 1,62 | 17,17 | 0,9365 | 0,3246 | |||
| CBRE / CBRE Group, Inc. | 0,04 | 0,13 | 1,59 | -38,41 | 0,9204 | -0,2236 | |||
| US8252528851 / Invesco Government & Agency Portfolio, Institutional Class | 1,58 | 149,43 | 1,58 | 149,53 | 0,9135 | 0,6331 | |||
| TWLO / Twilio Inc. | 0,02 | 0,13 | 1,54 | -8,86 | 0,8938 | 0,1432 | |||
| TTD / The Trade Desk, Inc. | 0,01 | 18,45 | 1,52 | -12,02 | 0,8822 | 0,1146 | |||
| KEYS / Keysight Technologies, Inc. | 0,02 | -53,13 | 1,52 | -61,79 | 0,8812 | -0,8845 | |||
| MKC / McCormick & Company, Incorporated | 0,01 | -39,50 | 1,43 | -49,68 | 0,8270 | -0,4311 | |||
| PAYC / Paycom Software, Inc. | 0,01 | 0,14 | 1,43 | -23,61 | 0,8263 | -0,0018 | |||
| HLT / Hilton Worldwide Holdings Inc. | 0,02 | 13,29 | 1,36 | -30,28 | 0,7891 | -0,0777 | |||
| IDXX / IDEXX Laboratories, Inc. | 0,01 | -35,54 | 1,36 | -40,19 | 0,7876 | -0,2209 | |||
| LPLA / LPL Financial Holdings Inc. | 0,02 | -4,17 | 1,35 | -43,47 | 0,7795 | -0,2761 | |||
| GRMN / Garmin Ltd. | 0,02 | 48,83 | 1,34 | 14,38 | 0,7783 | 0,2572 | |||
| KKR / KKR & Co. Inc. | 0,06 | 0,13 | 1,34 | -19,42 | 0,7760 | 0,0385 | |||
| DHI / D.R. Horton, Inc. | 0,04 | 1,30 | 0,7540 | 0,7540 | |||||
| TW / Tradeweb Markets Inc. | 0,03 | 16,60 | 1,30 | 5,78 | 0,7523 | 0,2076 | |||
| BLL / Ball Corp. | 0,02 | -25,91 | 1,26 | -25,93 | 0,7282 | -0,0245 | |||
| LW / Lamb Weston Holdings, Inc. | 0,02 | 1,19 | 0,6909 | 0,6909 | |||||
| MLM / Martin Marietta Materials, Inc. | 0,01 | -17,09 | 1,19 | -43,89 | 0,6892 | -0,2514 | |||
| DPZ / Domino's Pizza, Inc. | 0,00 | 1,18 | 0,6835 | 0,6835 | |||||
| AVY / Avery Dennison Corporation | 0,01 | 27,73 | 1,15 | -0,52 | 0,6662 | 0,1533 | |||
| SGEN / Seagen Inc | 0,01 | 0,13 | 1,13 | 1,07 | 0,6541 | 0,1588 | |||
| BKI / Black Knight Inc - Class A | 0,02 | 2,58 | 1,09 | -2,43 | 0,6287 | 0,1096 | |||
| HSY / The Hershey Company | 0,01 | 1,08 | 0,6254 | 0,6254 | |||||
| EEFT / Euronet Worldwide, Inc. | 0,01 | -16,58 | 1,01 | -54,64 | 0,5869 | -0,4033 | |||
| DOCU / DocuSign, Inc. | 0,01 | 1,01 | 0,5852 | 0,5852 | |||||
| NXPI / NXP Semiconductors N.V. | 0,01 | -9,54 | 1,00 | -41,07 | 0,5794 | -0,1732 | |||
| WCN / Waste Connections, Inc. | 0,01 | -59,23 | 0,96 | -65,69 | 0,5539 | -0,7452 | |||
| PLNT / Planet Fitness, Inc. | 0,02 | -17,75 | 0,94 | -46,36 | 0,5419 | -0,2317 | |||
| ZNGA / Zynga Inc - Class A | 0,13 | 0,90 | 0,5182 | 0,5182 | |||||
| AYX / Alteryx, Inc. | 0,01 | 0,88 | 0,5101 | 0,5101 | |||||
| CNC / Centene Corporation | 0,01 | 0,86 | 0,5000 | 0,5000 | |||||
| MSI / Motorola Solutions, Inc. | 0,01 | -65,98 | 0,85 | -71,96 | 0,4897 | -0,8465 | |||
| NVCR / NovoCure Limited | 0,01 | 0,13 | 0,83 | -19,96 | 0,4785 | 0,0206 | |||
| ALNY / Alnylam Pharmaceuticals, Inc. | 0,01 | 0,82 | 0,4770 | 0,4770 | |||||
| MKSI / MKS Inc. | 0,01 | 0,82 | 0,4756 | 0,4756 | |||||
| TDG / TransDigm Group Incorporated | 0,00 | -66,72 | 0,81 | -80,97 | 0,4701 | -1,4217 | |||
| KMX / CarMax, Inc. | 0,01 | -17,13 | 0,76 | -49,13 | 0,4386 | -0,2214 | |||
| US8252527291 / Invesco Liquid Assets Portfolio, Institutional Class | 0,71 | 4,30 | 0,71 | 4,25 | 0,4119 | 0,0936 | |||
| TREX / Trex Company, Inc. | 0,01 | 0,41 | 0,2386 | 0,2386 | |||||
| TSN / Tyson Foods, Inc. | 0,00 | -100,00 | 0,00 | -100,00 | -0,5007 | ||||
| NDSN / Nordson Corporation | 0,00 | -100,00 | 0,00 | -100,00 | -0,4934 | ||||
| AZPN / Aspen Technology, Inc. | 0,00 | -100,00 | 0,00 | -100,00 | -0,6959 | ||||
| TECH / Bio-Techne Corporation | 0,00 | -100,00 | 0,00 | -100,00 | -0,7989 | ||||
| MAS / Masco Corporation | 0,00 | -100,00 | 0,00 | -100,00 | -0,9387 | ||||
| ATUS / Altice USA, Inc. | 0,00 | -100,00 | 0,00 | -100,00 | -0,0480 | ||||
| COO / The Cooper Companies, Inc. | 0,00 | -100,00 | 0,00 | -100,00 | -0,5154 | ||||
| APTV / Aptiv PLC | 0,00 | -100,00 | 0,00 | -100,00 | -0,7197 | ||||
| TSCO / Tractor Supply Company | 0,00 | -100,00 | 0,00 | -100,00 | -1,0001 | ||||
| ROKU / Roku, Inc. | 0,00 | -100,00 | 0,00 | -100,00 | -0,4175 | ||||
| LYV / Live Nation Entertainment, Inc. | 0,00 | -100,00 | 0,00 | -100,00 | -1,0921 | ||||
| IQV / IQVIA Holdings Inc. | 0,00 | -100,00 | 0,00 | -100,00 | -1,2419 |