Statistiques de base
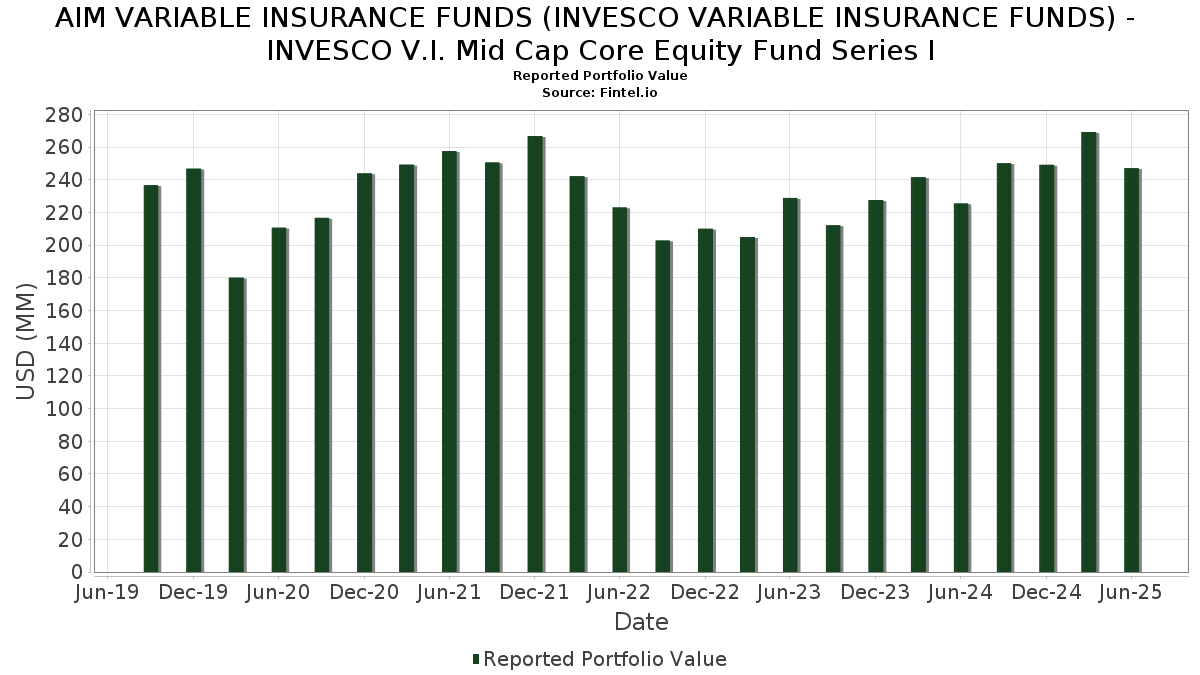
| Valeur du portefeuille | $ 247 137 880 |
| Positions actuelles | 95 |
Dernières positions, performances, ASG (à partir des dépôts 13F, 13D)
AIM VARIABLE INSURANCE FUNDS (INVESCO VARIABLE INSURANCE FUNDS) - INVESCO V.I. Mid Cap Core Equity Fund Series I a déclaré un total de 95 positions dans ses derniers dépôts auprès de la SEC. La valeur la plus récente du portefeuille est calculée à 247 137 880 USD. Les actifs sous gestion réels (ASG) sont cette valeur plus les liquidités (qui ne sont pas divulguées). Les principales positions de AIM VARIABLE INSURANCE FUNDS (INVESCO VARIABLE INSURANCE FUNDS) - INVESCO V.I. Mid Cap Core Equity Fund Series I sont Royal Caribbean Cruises Ltd. (US:RCL) , Howmet Aerospace Inc. (US:HWM) , Raymond James Financial, Inc. (US:RJF) , M&T Bank Corporation (US:MTB) , and Electronic Arts Inc. (US:EA) . Les nouvelles positions de AIM VARIABLE INSURANCE FUNDS (INVESCO VARIABLE INSURANCE FUNDS) - INVESCO V.I. Mid Cap Core Equity Fund Series I incluent Brixmor Property Group Inc. (US:BRX) , AvalonBay Communities, Inc. (US:AVB) , AutoNation, Inc. (US:AN) , The Williams Companies, Inc. (US:WMB) , and Keurig Dr Pepper Inc. (US:KDP) .
Meilleures augmentations ce trimestre
Nous utilisons la variation de l'allocation du portefeuille car il s'agit de l'indicateur le plus significatif. Les changements peuvent être dus à des transactions ou à des variations de prix des actions.
| Titre | Actions (en millions) |
Valeur ($ en millions) |
% du portefeuille | ΔPortefeuille % |
|---|---|---|---|---|
| 28,11 | 28,11 | 13,4871 | 13,4871 | |
| 10,65 | 10,65 | 5,1073 | 5,1073 | |
| 0,01 | 2,26 | 1,0827 | 1,0827 | |
| 0,08 | 2,20 | 1,0570 | 1,0570 | |
| 0,01 | 2,05 | 0,9833 | 0,9833 | |
| 0,01 | 1,66 | 0,7959 | 0,7959 | |
| 0,03 | 1,62 | 0,7796 | 0,7796 | |
| 0,05 | 1,52 | 0,7305 | 0,7305 | |
| 0,01 | 2,90 | 1,3918 | 0,6487 | |
| 0,01 | 2,48 | 1,1919 | 0,6298 |
Principales baisses ce trimestre
Nous utilisons la variation de l'allocation du portefeuille car il s'agit de l'indicateur le plus significatif. Les changements peuvent être dus à des transactions ou à des variations de prix des actions.
| Titre | Actions (en millions) |
Valeur ($ en millions) |
% du portefeuille | ΔPortefeuille % |
|---|---|---|---|---|
| 0,00 | 0,00 | -0,6863 | ||
| 0,00 | 0,00 | -0,6863 | ||
| 0,00 | 0,00 | -0,6863 | ||
| 0,00 | 0,00 | -0,6863 | ||
| 0,00 | 0,00 | -0,6863 | ||
| 0,00 | 0,00 | -0,6863 | ||
| 0,00 | 0,00 | -0,6863 | ||
| 0,00 | 0,00 | -0,6863 | ||
| 0,02 | 2,07 | 0,9938 | -0,5056 | |
| 0,03 | 2,76 | 1,3219 | -0,4941 |
Déclarations 13F et dépôts de fonds
Ce formulaire a été déposé le 2025-08-27 pour la période de déclaration 2025-06-30. Cliquez sur l'icône du lien pour voir l'historique complet des transactions.
Mettre à niveau pour débloquer les données premium et exporter vers Excel ![]() .
.
| Titre | Type | Prix moyen de l'action | Actions (en millions) |
ΔActions (%) |
ΔActions (%) |
Valeur ($ en millions) |
Portefeuille (%) |
ΔPortefeuille (%) |
|
|---|---|---|---|---|---|---|---|---|---|
| Invesco Private Prime Fund / STIV (N/A) | 28,11 | 28,11 | 13,4871 | 13,4871 | |||||
| Invesco Private Government Fund / STIV (N/A) | 10,65 | 10,65 | 5,1073 | 5,1073 | |||||
| RCL / Royal Caribbean Cruises Ltd. | 0,01 | -15,16 | 4,58 | 29,32 | 2,1966 | 0,4010 | |||
| HWM / Howmet Aerospace Inc. | 0,02 | -24,08 | 4,13 | 8,93 | 1,9791 | 0,0584 | |||
| RJF / Raymond James Financial, Inc. | 0,02 | -4,15 | 3,50 | 5,81 | 1,6780 | 0,0018 | |||
| MTB / M&T Bank Corporation | 0,02 | -1,70 | 3,48 | 6,68 | 1,6708 | 0,0152 | |||
| EA / Electronic Arts Inc. | 0,02 | -1,70 | 3,24 | 8,60 | 1,5567 | 0,0418 | |||
| CW / Curtiss-Wright Corporation | 0,01 | -17,68 | 3,21 | 26,76 | 1,5387 | 0,2555 | |||
| HIG / The Hartford Insurance Group, Inc. | 0,02 | -3,82 | 3,15 | -1,35 | 1,5112 | -0,1085 | |||
| EQH / Equitable Holdings, Inc. | 0,06 | -7,64 | 3,10 | -0,55 | 1,4853 | -0,0932 | |||
| LNG / Cheniere Energy, Inc. | 0,01 | -15,80 | 3,06 | -11,40 | 1,4697 | -0,2835 | |||
| PPL / PPL Corporation | 0,09 | -1,70 | 3,04 | -7,74 | 1,4587 | -0,2127 | |||
| TTD / The Trade Desk, Inc. | 0,04 | 7,34 | 3,00 | 41,20 | 1,4390 | 0,3618 | |||
| SNOW / Snowflake Inc. | 0,01 | 29,31 | 2,90 | 98,02 | 1,3918 | 0,6487 | |||
| CMS / CMS Energy Corporation | 0,04 | -6,55 | 2,89 | -13,80 | 1,3881 | -0,3143 | |||
| VST / Vistra Corp. | 0,01 | -4,67 | 2,84 | 57,29 | 1,3609 | 0,4465 | |||
| COR / Cencora, Inc. | 0,01 | -1,70 | 2,83 | 5,99 | 1,3583 | 0,0037 | |||
| AIG / American International Group, Inc. | 0,03 | -21,84 | 2,76 | -23,04 | 1,3219 | -0,4941 | |||
| MCHP / Microchip Technology Incorporated | 0,04 | -1,70 | 2,75 | 42,92 | 1,3213 | 0,3438 | |||
| WTFC / Wintrust Financial Corporation | 0,02 | -1,70 | 2,75 | 8,35 | 1,3197 | 0,0324 | |||
| AEE / Ameren Corporation | 0,03 | -3,45 | 2,75 | -7,63 | 1,3179 | -0,1905 | |||
| FR / First Industrial Realty Trust, Inc. | 0,06 | -3,05 | 2,71 | -13,54 | 1,2995 | -0,2890 | |||
| XYL / Xylem Inc. | 0,02 | -1,70 | 2,71 | 6,45 | 1,2994 | 0,0090 | |||
| EXE / Expand Energy Corporation | 0,02 | -16,90 | 2,65 | -12,70 | 1,2695 | -0,2677 | |||
| ROK / Rockwell Automation, Inc. | 0,01 | 3,84 | 2,63 | 33,55 | 1,2623 | 0,2628 | |||
| HUBB / Hubbell Incorporated | 0,01 | -4,14 | 2,63 | 18,33 | 1,2610 | 0,1343 | |||
| ALSN / Allison Transmission Holdings, Inc. | 0,03 | -1,70 | 2,59 | -2,41 | 1,2441 | -0,1033 | |||
| DHI / D.R. Horton, Inc. | 0,02 | -3,67 | 2,55 | -2,34 | 1,2233 | -0,1004 | |||
| SYY / Sysco Corporation | 0,03 | -3,83 | 2,55 | -2,93 | 1,2224 | -0,1088 | |||
| NTRA / Natera, Inc. | 0,02 | -1,70 | 2,54 | 17,42 | 1,2165 | 0,1215 | |||
| MDB / MongoDB, Inc. | 0,01 | 87,23 | 2,48 | 124,19 | 1,1919 | 0,6298 | |||
| PR / Permian Resources Corporation | 0,18 | 19,24 | 2,46 | 17,27 | 1,1793 | 0,1162 | |||
| EHC / Encompass Health Corporation | 0,02 | -4,18 | 2,42 | 16,01 | 1,1613 | 0,1032 | |||
| CTVA / Corteva, Inc. | 0,03 | -20,68 | 2,42 | -6,06 | 1,1609 | -0,1455 | |||
| HUBS / HubSpot, Inc. | 0,00 | 7,87 | 2,41 | 5,10 | 1,1571 | -0,0067 | |||
| TYL / Tyler Technologies, Inc. | 0,00 | -11,53 | 2,39 | -9,78 | 1,1459 | -0,1968 | |||
| LAMR / Lamar Advertising Company | 0,02 | -7,24 | 2,38 | -1,04 | 1,1410 | -0,0781 | |||
| THC / Tenet Healthcare Corporation | 0,01 | -1,71 | 2,34 | 28,61 | 1,1239 | 0,2002 | |||
| IFF / International Flavors & Fragrances Inc. | 0,03 | 33,04 | 2,32 | 26,11 | 1,1146 | 0,1801 | |||
| VRT / Vertiv Holdings Co | 0,02 | -3,68 | 2,31 | 71,42 | 1,1078 | 0,4242 | |||
| U / Unity Software Inc. | 0,09 | -20,67 | 2,29 | -2,01 | 1,0976 | -0,0864 | |||
| OWL / Blue Owl Capital Inc. | 0,12 | 8,37 | 2,28 | 3,87 | 1,0962 | -0,0192 | |||
| BLD / TopBuild Corp. | 0,01 | -3,55 | 2,28 | 2,39 | 1,0917 | -0,0354 | |||
| AJG / Arthur J. Gallagher & Co. | 0,01 | -3,83 | 2,27 | -10,83 | 1,0901 | -0,2022 | |||
| COF / Capital One Financial Corporation | 0,01 | 2,26 | 1,0827 | 1,0827 | |||||
| AMH / American Homes 4 Rent | 0,06 | -3,13 | 2,24 | -7,60 | 1,0729 | -0,1543 | |||
| LECO / Lincoln Electric Holdings, Inc. | 0,01 | -1,71 | 2,23 | 7,72 | 1,0709 | 0,0201 | |||
| JCI / Johnson Controls International plc | 0,02 | -11,93 | 2,22 | 16,15 | 1,0662 | 0,0956 | |||
| BRX / Brixmor Property Group Inc. | 0,08 | 2,20 | 1,0570 | 1,0570 | |||||
| TRU / TransUnion | 0,02 | -1,70 | 2,20 | 4,27 | 1,0541 | -0,0149 | |||
| WH / Wyndham Hotels & Resorts, Inc. | 0,03 | -9,21 | 2,19 | -18,55 | 1,0515 | -0,3129 | |||
| CBOE / Cboe Global Markets, Inc. | 0,01 | -4,58 | 2,18 | -1,67 | 1,0452 | -0,0783 | |||
| TXRH / Texas Roadhouse, Inc. | 0,01 | -4,98 | 2,09 | 6,87 | 1,0007 | 0,0109 | |||
| BURL / Burlington Stores, Inc. | 0,01 | -1,69 | 2,08 | -4,06 | 0,9969 | -0,1013 | |||
| BJ / BJ's Wholesale Club Holdings, Inc. | 0,02 | -25,86 | 2,07 | -29,94 | 0,9938 | -0,5056 | |||
| AHR / American Healthcare REIT, Inc. | 0,06 | 11,08 | 2,07 | 34,72 | 0,9925 | 0,2136 | |||
| KEYS / Keysight Technologies, Inc. | 0,01 | -1,71 | 2,07 | 7,54 | 0,9918 | 0,0169 | |||
| ALAB / Astera Labs, Inc. | 0,02 | 10,88 | 2,06 | 68,05 | 0,9896 | 0,3670 | |||
| ATI / ATI Inc. | 0,02 | -34,77 | 2,05 | 8,29 | 0,9840 | 0,0231 | |||
| AVB / AvalonBay Communities, Inc. | 0,01 | 2,05 | 0,9833 | 0,9833 | |||||
| BRBR / BellRing Brands, Inc. | 0,04 | -3,27 | 2,04 | -24,72 | 0,9787 | -0,3960 | |||
| CWST / Casella Waste Systems, Inc. | 0,02 | -1,70 | 2,03 | 1,70 | 0,9752 | -0,0383 | |||
| DD / DuPont de Nemours, Inc. | 0,03 | 42,96 | 2,03 | 31,33 | 0,9736 | 0,1898 | |||
| CFG / Citizens Financial Group, Inc. | 0,05 | -1,70 | 2,02 | 7,34 | 0,9690 | 0,0150 | |||
| LONN / Lonza Group AG | 0,00 | -1,67 | 2,02 | 13,84 | 0,9668 | 0,0690 | |||
| INFA / Informatica Inc. | 0,08 | -4,12 | 2,01 | 33,75 | 0,9661 | 0,2028 | |||
| ASND / Ascendis Pharma A/S - Depositary Receipt (Common Stock) | 0,01 | -4,03 | 2,01 | 6,24 | 0,9643 | 0,0052 | |||
| VLO / Valero Energy Corporation | 0,01 | -1,70 | 1,99 | 0,05 | 0,9563 | -0,0541 | |||
| US8252524066 / Invesco Treasury Portfolio, Institutional Class | 1,99 | 177,05 | 1,99 | 177,23 | 0,9526 | 0,5891 | |||
| MRVL / Marvell Technology, Inc. | 0,02 | -1,70 | 1,90 | 23,59 | 0,9126 | 0,1319 | |||
| KFY / Korn Ferry | 0,03 | -29,99 | 1,90 | -24,33 | 0,9119 | -0,3617 | |||
| RGA / Reinsurance Group of America, Incorporated | 0,01 | 11,16 | 1,89 | 11,99 | 0,9055 | 0,0507 | |||
| MSI / Motorola Solutions, Inc. | 0,00 | -26,38 | 1,83 | -29,32 | 0,8758 | -0,4337 | |||
| ZBH / Zimmer Biomet Holdings, Inc. | 0,02 | -1,70 | 1,81 | -20,80 | 0,8661 | -0,2897 | |||
| DOX / Amdocs Limited | 0,02 | -1,70 | 1,71 | -1,95 | 0,8220 | -0,0645 | |||
| DPZ / Domino's Pizza, Inc. | 0,00 | -1,68 | 1,69 | -3,59 | 0,8120 | -0,0781 | |||
| PCTY / Paylocity Holding Corporation | 0,01 | -23,05 | 1,68 | -25,56 | 0,8037 | -0,3378 | |||
| AN / AutoNation, Inc. | 0,01 | 1,66 | 0,7959 | 0,7959 | |||||
| SW / Smurfit Westrock Plc | 0,04 | -6,51 | 1,64 | -10,47 | 0,7879 | -0,1424 | |||
| WSC / WillScot Holdings Corporation | 0,06 | 14,49 | 1,64 | 12,90 | 0,7854 | 0,0497 | |||
| WMB / The Williams Companies, Inc. | 0,03 | 1,62 | 0,7796 | 0,7796 | |||||
| HQY / HealthEquity, Inc. | 0,02 | -1,70 | 1,60 | 16,61 | 0,7681 | 0,0713 | |||
| KDP / Keurig Dr Pepper Inc. | 0,05 | 1,52 | 0,7305 | 0,7305 | |||||
| TPR / Tapestry, Inc. | 0,02 | -1,70 | 1,48 | 22,66 | 0,7115 | 0,0980 | |||
| RGEN / Repligen Corporation | 0,01 | 14,23 | 1,46 | 11,67 | 0,7027 | 0,0375 | |||
| CACI / CACI International Inc | 0,00 | -1,68 | 1,45 | 27,79 | 0,6973 | 0,1203 | |||
| SLGN / Silgan Holdings Inc. | 0,03 | -14,02 | 1,45 | -8,88 | 0,6939 | -0,1110 | |||
| VC / Visteon Corporation | 0,02 | -1,70 | 1,42 | 18,18 | 0,6800 | 0,0716 | |||
| DECK / Deckers Outdoor Corporation | 0,01 | 17,56 | 1,34 | 8,42 | 0,6424 | 0,0158 | |||
| AOS / A. O. Smith Corporation | 0,02 | 14,75 | 1,31 | 15,16 | 0,6305 | 0,0516 | |||
| AL / Air Lease Corporation | 0,02 | -1,70 | 1,22 | 18,97 | 0,5871 | 0,0656 | |||
| AGCO / AGCO Corporation | 0,01 | 1,13 | 0,5414 | 0,5414 | |||||
| EL / The Estée Lauder Companies Inc. | 0,01 | -1,71 | 1,13 | 20,41 | 0,5407 | 0,0657 | |||
| US8252528851 / Invesco Government & Agency Portfolio, Institutional Class | 1,07 | 177,04 | 1,07 | 177,66 | 0,5129 | 0,3172 | |||
| ADMA / ADMA Biologics, Inc. | 0,05 | 0,87 | 0,4153 | 0,4153 | |||||
| PCVX / Vaxcyte, Inc. | 0,00 | -100,00 | 0,00 | -100,00 | -0,1528 | ||||
| SAIA / Saia, Inc. | 0,00 | -100,00 | 0,00 | -100,00 | -0,6863 | ||||
| SAIA / Saia, Inc. | 0,00 | -100,00 | 0,00 | -100,00 | -0,6863 | ||||
| SAIA / Saia, Inc. | 0,00 | -100,00 | 0,00 | -100,00 | -0,6863 | ||||
| SAIA / Saia, Inc. | 0,00 | -100,00 | 0,00 | -100,00 | -0,6863 | ||||
| SAIA / Saia, Inc. | 0,00 | -100,00 | 0,00 | -100,00 | -0,6863 | ||||
| SAIA / Saia, Inc. | 0,00 | -100,00 | 0,00 | -100,00 | -0,6863 | ||||
| SAIA / Saia, Inc. | 0,00 | -100,00 | 0,00 | -100,00 | -0,6863 | ||||
| SAIA / Saia, Inc. | 0,00 | -100,00 | 0,00 | -100,00 | -0,6863 |