Statistiques de base
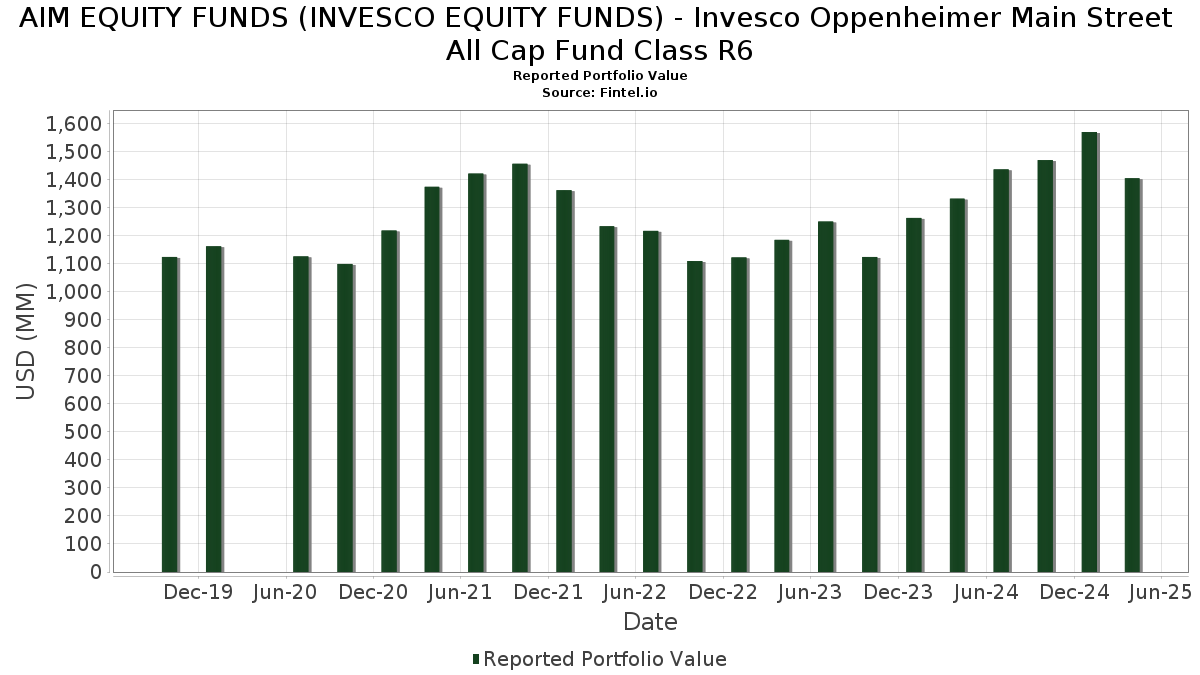
| Valeur du portefeuille | $ 1 405 300 729 |
| Positions actuelles | 81 |
Dernières positions, performances, ASG (à partir des dépôts 13F, 13D)
AIM EQUITY FUNDS (INVESCO EQUITY FUNDS) - Invesco Oppenheimer Main Street All Cap Fund Class R6 a déclaré un total de 81 positions dans ses derniers dépôts auprès de la SEC. La valeur la plus récente du portefeuille est calculée à 1 405 300 729 USD. Les actifs sous gestion réels (ASG) sont cette valeur plus les liquidités (qui ne sont pas divulguées). Les principales positions de AIM EQUITY FUNDS (INVESCO EQUITY FUNDS) - Invesco Oppenheimer Main Street All Cap Fund Class R6 sont Microsoft Corporation (US:MSFT) , NVIDIA Corporation (US:NVDA) , Apple Inc. (US:AAPL) , Amazon.com, Inc. (US:AMZN) , and Meta Platforms, Inc. (US:META) . Les nouvelles positions de AIM EQUITY FUNDS (INVESCO EQUITY FUNDS) - Invesco Oppenheimer Main Street All Cap Fund Class R6 incluent Linde plc (US:LIN) , General Electric Company (US:GE) , Cheniere Energy, Inc. (US:LNG) , ASML Holding N.V. - Depositary Receipt (Common Stock) (US:ASML) , and Medtronic plc (US:MDT) .
Meilleures augmentations ce trimestre
Nous utilisons la variation de l'allocation du portefeuille car il s'agit de l'indicateur le plus significatif. Les changements peuvent être dus à des transactions ou à des variations de prix des actions.
| Titre | Actions (en millions) |
Valeur ($ en millions) |
% du portefeuille | ΔPortefeuille % |
|---|---|---|---|---|
| 0,04 | 16,52 | 1,1826 | 1,1826 | |
| 0,04 | 14,08 | 1,0076 | 1,0076 | |
| 0,07 | 13,76 | 0,9850 | 0,9850 | |
| 0,05 | 10,86 | 0,7775 | 0,7775 | |
| 0,02 | 10,41 | 0,7453 | 0,7453 | |
| 0,12 | 10,19 | 0,7294 | 0,7294 | |
| 0,04 | 9,38 | 0,6716 | 0,6716 | |
| 0,16 | 28,21 | 2,0190 | 0,6380 | |
| 0,26 | 101,45 | 7,2618 | 0,5543 | |
| 6,63 | 6,63 | 0,4746 | 0,4746 |
Principales baisses ce trimestre
Nous utilisons la variation de l'allocation du portefeuille car il s'agit de l'indicateur le plus significatif. Les changements peuvent être dus à des transactions ou à des variations de prix des actions.
| Titre | Actions (en millions) |
Valeur ($ en millions) |
% du portefeuille | ΔPortefeuille % |
|---|---|---|---|---|
| 5,19 | 5,19 | 0,3712 | -1,0233 | |
| 0,08 | 45,71 | 3,2721 | -0,9943 | |
| 0,34 | 62,56 | 4,4777 | -0,7172 | |
| 2,79 | 2,79 | 0,1999 | -0,5510 | |
| 0,22 | 8,79 | 0,6293 | -0,5339 | |
| 0,25 | 39,80 | 2,8486 | -0,4459 | |
| 0,22 | 10,67 | 0,7635 | -0,3370 | |
| 0,08 | 7,87 | 0,5631 | -0,3014 | |
| 0,12 | 12,41 | 0,8886 | -0,2964 | |
| 0,04 | 10,61 | 0,7597 | -0,2209 |
Déclarations 13F et dépôts de fonds
Ce formulaire a été déposé le 2025-06-30 pour la période de déclaration 2025-04-30. Cliquez sur l'icône du lien pour voir l'historique complet des transactions.
Mettre à niveau pour débloquer les données premium et exporter vers Excel ![]() .
.
| Titre | Type | Prix moyen de l'action | Actions (en millions) |
ΔActions (%) |
ΔActions (%) |
Valeur ($ en millions) |
Portefeuille (%) |
ΔPortefeuille (%) |
|
|---|---|---|---|---|---|---|---|---|---|
| MSFT / Microsoft Corporation | 0,26 | 2,34 | 101,45 | -2,54 | 7,2618 | 0,5543 | |||
| NVDA / NVIDIA Corporation | 0,81 | 0,00 | 88,39 | -9,29 | 6,3268 | 0,0484 | |||
| AAPL / Apple Inc. | 0,36 | 0,00 | 76,69 | -9,96 | 5,4892 | 0,0014 | |||
| AMZN / Amazon.com, Inc. | 0,34 | 0,00 | 62,56 | -22,41 | 4,4777 | -0,7172 | |||
| META / Meta Platforms, Inc. | 0,08 | -13,33 | 45,71 | -30,96 | 3,2721 | -0,9943 | |||
| JPM / JPMorgan Chase & Co. | 0,17 | 0,00 | 40,39 | -8,49 | 2,8912 | 0,0473 | |||
| GOOGL / Alphabet Inc. | 0,25 | 0,00 | 39,80 | -22,16 | 2,8486 | -0,4459 | |||
| AVGO / Broadcom Inc. | 0,18 | 4,92 | 34,03 | -8,73 | 2,4361 | 0,0333 | |||
| LLY / Eli Lilly and Company | 0,03 | -13,05 | 28,80 | -3,63 | 2,0614 | 0,1359 | |||
| PM / Philip Morris International Inc. | 0,16 | 0,00 | 28,21 | 31,61 | 2,0190 | 0,6380 | |||
| WMT / Walmart Inc. | 0,27 | -16,75 | 26,48 | -17,52 | 1,8956 | -0,1732 | |||
| MA / Mastercard Incorporated | 0,05 | 21,23 | 26,28 | 19,62 | 1,8811 | 0,4655 | |||
| PG / The Procter & Gamble Company | 0,15 | 9,32 | 24,74 | 7,07 | 1,7708 | 0,2820 | |||
| UNH / UnitedHealth Group Incorporated | 0,05 | 9,52 | 22,20 | -16,94 | 1,5893 | -0,1331 | |||
| SCHW / The Charles Schwab Corporation | 0,23 | 0,00 | 19,08 | -1,59 | 1,3655 | 0,1163 | |||
| CRM / Salesforce, Inc. | 0,07 | 0,00 | 18,71 | -21,36 | 1,3389 | -0,1938 | |||
| NOW / ServiceNow, Inc. | 0,02 | 34,88 | 17,62 | 26,48 | 1,2613 | 0,3636 | |||
| AIG / American International Group, Inc. | 0,22 | 0,00 | 17,58 | 10,68 | 1,2584 | 0,2348 | |||
| UBER / Uber Technologies, Inc. | 0,21 | -11,87 | 17,34 | 6,80 | 1,2415 | 0,1951 | |||
| CMCSA / Comcast Corporation | 0,51 | -10,17 | 17,29 | -8,72 | 1,2373 | 0,0170 | |||
| AJG / Arthur J. Gallagher & Co. | 0,05 | 0,00 | 16,81 | 6,25 | 1,2035 | 0,1839 | |||
| CVX / Chevron Corporation | 0,12 | 0,00 | 16,76 | -8,80 | 1,1999 | 0,0155 | |||
| PPL / PPL Corporation | 0,45 | 27,18 | 16,53 | 38,16 | 1,1835 | 0,4124 | |||
| LIN / Linde plc | 0,04 | 16,52 | 1,1826 | 1,1826 | |||||
| HWM / Howmet Aerospace Inc. | 0,12 | -17,90 | 16,38 | -10,11 | 1,1726 | -0,0017 | |||
| TXN / Texas Instruments Incorporated | 0,10 | 0,00 | 15,96 | -13,30 | 1,1423 | -0,0438 | |||
| BSX / Boston Scientific Corporation | 0,15 | -8,10 | 15,79 | -7,65 | 1,1302 | 0,0286 | |||
| RCL / Royal Caribbean Cruises Ltd. | 0,07 | 0,00 | 15,06 | -19,39 | 1,0783 | -0,1258 | |||
| COR / Cencora, Inc. | 0,05 | 0,00 | 14,25 | 15,12 | 1,0201 | 0,2225 | |||
| FR / First Industrial Realty Trust, Inc. | 0,30 | -14,42 | 14,15 | -23,73 | 1,0130 | -0,1827 | |||
| MCD / McDonald's Corporation | 0,04 | 14,08 | 1,0076 | 1,0076 | |||||
| THC / Tenet Healthcare Corporation | 0,10 | 0,00 | 13,80 | 1,46 | 0,9875 | 0,1114 | |||
| GE / General Electric Company | 0,07 | 13,76 | 0,9850 | 0,9850 | |||||
| LOW / Lowe's Companies, Inc. | 0,06 | 0,00 | 13,73 | -14,03 | 0,9828 | -0,0463 | |||
| AXP / American Express Company | 0,05 | 0,00 | 13,60 | -16,08 | 0,9733 | -0,0707 | |||
| LZAGY / Lonza Group AG - Depositary Receipt (Common Stock) | 0,02 | -10,05 | 13,58 | 1,92 | 0,9720 | 0,1135 | |||
| COP / ConocoPhillips | 0,15 | 0,00 | 13,15 | -9,83 | 0,9413 | 0,0016 | |||
| HUBB / Hubbell Incorporated | 0,04 | -11,23 | 12,73 | -23,79 | 0,9113 | -0,1651 | |||
| VZ / Verizon Communications Inc. | 0,29 | 14,20 | 12,65 | 27,74 | 0,9056 | 0,2674 | |||
| RJF / Raymond James Financial, Inc. | 0,09 | 0,00 | 12,64 | -18,66 | 0,9047 | -0,0965 | |||
| EMR / Emerson Electric Co. | 0,12 | -16,54 | 12,41 | -32,50 | 0,8886 | -0,2964 | |||
| WH / Wyndham Hotels & Resorts, Inc. | 0,14 | 0,00 | 11,63 | -18,78 | 0,8325 | -0,0902 | |||
| ZBH / Zimmer Biomet Holdings, Inc. | 0,11 | 0,00 | 11,40 | -5,87 | 0,8158 | 0,0356 | |||
| SNOW / Snowflake Inc. | 0,07 | 0,00 | 11,15 | -12,13 | 0,7983 | -0,0195 | |||
| AIR / Airbus SE | 0,07 | 15,61 | 11,12 | 13,42 | 0,7961 | 0,1642 | |||
| LNG / Cheniere Energy, Inc. | 0,05 | 10,86 | 0,7775 | 0,7775 | |||||
| FI / Fiserv, Inc. | 0,06 | 0,00 | 10,84 | -14,57 | 0,7758 | -0,0416 | |||
| AEE / Ameren Corporation | 0,11 | -20,03 | 10,78 | -15,75 | 0,7715 | -0,0528 | |||
| EQH / Equitable Holdings, Inc. | 0,22 | -31,27 | 10,67 | -37,55 | 0,7635 | -0,3370 | |||
| TSLA / Tesla, Inc. | 0,04 | 0,00 | 10,61 | -30,26 | 0,7597 | -0,2209 | |||
| ASML / ASML Holding N.V. - Depositary Receipt (Common Stock) | 0,02 | 10,41 | 0,7453 | 0,7453 | |||||
| ASND / Ascendis Pharma A/S - Depositary Receipt (Common Stock) | 0,06 | 0,00 | 10,39 | 30,45 | 0,7437 | 0,2305 | |||
| DOX / Amdocs Limited | 0,12 | 51,18 | 10,31 | 53,09 | 0,7383 | 0,2644 | |||
| MDT / Medtronic plc | 0,12 | 10,19 | 0,7294 | 0,7294 | |||||
| BRBR / BellRing Brands, Inc. | 0,12 | -12,94 | 9,60 | -13,17 | 0,6870 | -0,0253 | |||
| AMH / American Homes 4 Rent | 0,25 | 0,00 | 9,42 | 7,97 | 0,6741 | 0,1121 | |||
| PH / Parker-Hannifin Corporation | 0,02 | -12,84 | 9,41 | -25,42 | 0,6733 | -0,1393 | |||
| CEG / Constellation Energy Corporation | 0,04 | 9,38 | 0,6716 | 0,6716 | |||||
| ROK / Rockwell Automation, Inc. | 0,04 | 0,00 | 9,17 | -11,05 | 0,6564 | -0,0078 | |||
| LECO / Lincoln Electric Holdings, Inc. | 0,05 | 0,00 | 9,09 | -11,35 | 0,6505 | -0,0101 | |||
| SNY / Sanofi - Depositary Receipt (Common Stock) | 0,16 | -23,54 | 9,01 | -22,68 | 0,6449 | -0,1059 | |||
| DFS / Discover Financial Services | 0,05 | 41,61 | 9,01 | 28,64 | 0,6447 | 0,1935 | |||
| USB / U.S. Bancorp | 0,22 | -42,32 | 8,79 | -51,30 | 0,6293 | -0,5339 | |||
| PCTY / Paylocity Holding Corporation | 0,05 | 0,00 | 8,74 | -6,54 | 0,6255 | 0,0231 | |||
| HIG / The Hartford Insurance Group, Inc. | 0,07 | 0,00 | 8,58 | 9,96 | 0,6139 | 0,1114 | |||
| U / Unity Software Inc. | 0,41 | 0,00 | 8,54 | -5,09 | 0,6113 | 0,0315 | |||
| DHI / D.R. Horton, Inc. | 0,07 | 0,00 | 8,52 | -10,97 | 0,6095 | -0,0067 | |||
| KEYS / Keysight Technologies, Inc. | 0,06 | 0,00 | 8,00 | -18,47 | 0,5728 | -0,0597 | |||
| CRH / CRH plc | 0,08 | -39,15 | 7,87 | -41,37 | 0,5631 | -0,3014 | |||
| KIM / Kimco Realty Corporation | 0,37 | 0,00 | 7,44 | -11,01 | 0,5325 | -0,0061 | |||
| COO / The Cooper Companies, Inc. | 0,09 | 0,00 | 7,40 | -15,41 | 0,5300 | -0,0340 | |||
| ATI / ATI Inc. | 0,14 | 0,00 | 7,35 | -4,76 | 0,5262 | 0,0289 | |||
| MDB / MongoDB, Inc. | 0,04 | 0,74 | 7,30 | -36,55 | 0,5227 | -0,2188 | |||
| BURL / Burlington Stores, Inc. | 0,03 | 22,66 | 7,08 | 26,94 | 0,5070 | 0,0279 | |||
| DD / DuPont de Nemours, Inc. | 0,10 | 0,00 | 6,91 | -14,08 | 0,4945 | -0,0236 | |||
| SU / Suncor Energy Inc. | 0,19 | -10,40 | 6,82 | -15,81 | 0,4881 | -0,0338 | |||
| OWL / Blue Owl Capital Inc. | 0,36 | 0,00 | 6,64 | -28,76 | 0,4753 | -0,1253 | |||
| Invesco Private Prime Fund / STIV (N/A) | 6,63 | 6,63 | 0,4746 | 0,4746 | |||||
| US8252524066 / Invesco Treasury Portfolio, Institutional Class | 5,19 | -76,04 | 5,19 | -76,04 | 0,3712 | -1,0233 | |||
| US8252528851 / Invesco Government & Agency Portfolio, Institutional Class | 2,79 | -76,04 | 2,79 | -76,04 | 0,1999 | -0,5510 | |||
| Invesco Private Government Fund / STIV (N/A) | 2,56 | 2,56 | 0,1834 | 0,1834 | |||||
| TTAN / ServiceTitan, Inc. | 0,00 | -100,00 | 0,00 | -100,00 | -0,1411 |