Statistiques de base
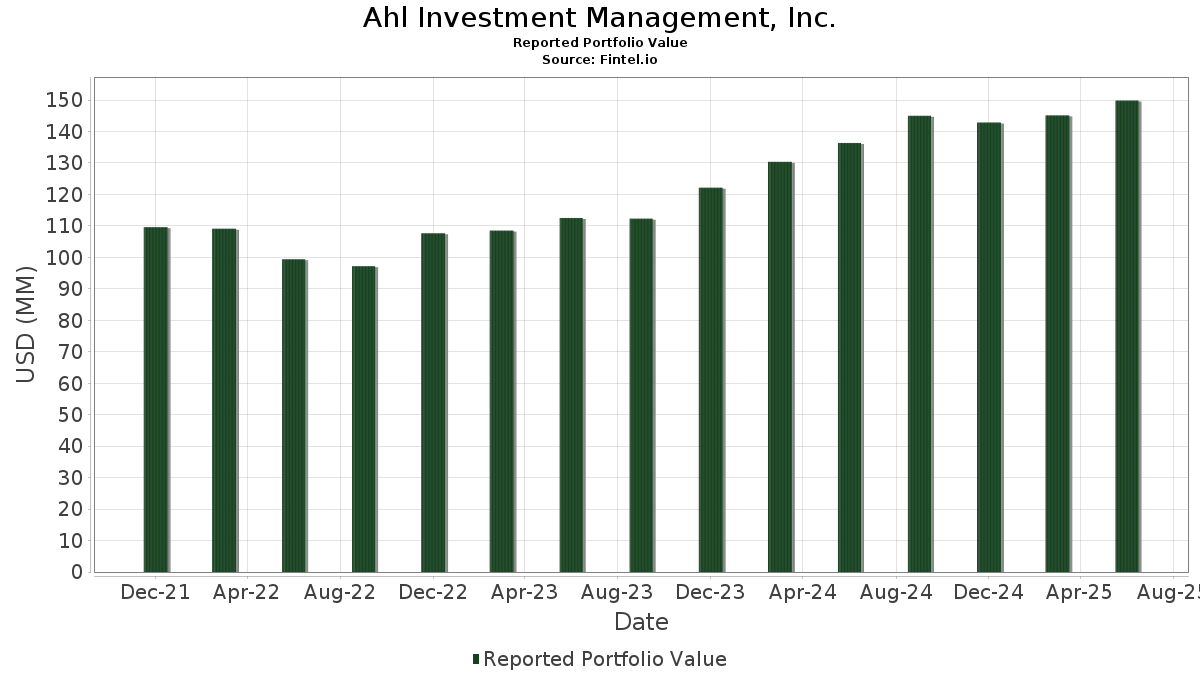
| Valeur du portefeuille | $ 149 835 241 |
| Positions actuelles | 70 |
Dernières positions, performances, ASG (à partir des dépôts 13F, 13D)
Ahl Investment Management, Inc. a déclaré un total de 70 positions dans ses derniers dépôts auprès de la SEC. La valeur la plus récente du portefeuille est calculée à 149 835 241 USD. Les actifs sous gestion réels (ASG) sont cette valeur plus les liquidités (qui ne sont pas divulguées). Les principales positions de Ahl Investment Management, Inc. sont Microsoft Corporation (US:MSFT) , JPMorgan Chase & Co. (US:JPM) , The Coca-Cola Company (US:KO) , Global X Funds - Global X U.S. Preferred ETF (US:PFFD) , and Schwab Strategic Trust - Schwab U.S. Broad Market ETF (US:SCHB) . Les nouvelles positions de Ahl Investment Management, Inc. incluent iShares Trust - iShares National Muni Bond ETF (US:MUB) , .
Meilleures augmentations ce trimestre
Nous utilisons la variation de l'allocation du portefeuille car il s'agit de l'indicateur le plus significatif. Les changements peuvent être dus à des transactions ou à des variations de prix des actions.
| Titre | Actions (en millions) |
Valeur ($ en millions) |
% du portefeuille | ΔPortefeuille % |
|---|---|---|---|---|
| 0,03 | 2,62 | 1,7458 | 1,7458 | |
| 0,02 | 9,50 | 6,3378 | 1,2414 | |
| 0,03 | 2,39 | 1,5984 | 1,0734 | |
| 0,03 | 3,63 | 2,4211 | 0,3648 | |
| 0,03 | 8,47 | 5,6516 | 0,3039 | |
| 0,01 | 2,28 | 1,5224 | 0,2971 | |
| 0,29 | 6,97 | 4,6487 | 0,2810 | |
| 0,01 | 3,55 | 2,3662 | 0,2361 | |
| 0,01 | 2,72 | 1,8142 | 0,1871 | |
| 0,00 | 0,24 | 0,1634 | 0,1634 |
Principales baisses ce trimestre
Nous utilisons la variation de l'allocation du portefeuille car il s'agit de l'indicateur le plus significatif. Les changements peuvent être dus à des transactions ou à des variations de prix des actions.
| Titre | Actions (en millions) |
Valeur ($ en millions) |
% du portefeuille | ΔPortefeuille % |
|---|---|---|---|---|
| 0,02 | 0,32 | 0,2168 | -1,0244 | |
| 0,05 | 5,68 | 3,7878 | -0,5495 | |
| 0,03 | 6,20 | 4,1356 | -0,5007 | |
| 0,05 | 1,32 | 0,8784 | -0,4628 | |
| 0,02 | 3,97 | 2,6514 | -0,4386 | |
| 0,11 | 8,10 | 5,4064 | -0,3070 | |
| 0,02 | 3,45 | 2,3002 | -0,3029 | |
| 0,02 | 2,25 | 1,5039 | -0,2724 | |
| 0,42 | 7,87 | 5,2497 | -0,2508 | |
| 0,13 | 3,52 | 2,3484 | -0,2452 |
Déclarations 13F et dépôts de fonds
Ce formulaire a été déposé le 2025-07-10 pour la période de déclaration 2025-06-30. Cliquez sur l'icône du lien pour voir l'historique complet des transactions.
Mettre à niveau pour débloquer les données premium et exporter vers Excel ![]() .
.
| Titre | Type | Prix moyen de l'action | Actions (en millions) |
ΔActions (%) |
ΔActions (%) |
Valeur ($ en millions) |
Portefeuille (%) |
ΔPortefeuille (%) |
|
|---|---|---|---|---|---|---|---|---|---|
| MSFT / Microsoft Corporation | 0,02 | -3,10 | 9,50 | 28,41 | 6,3378 | 1,2414 | |||
| JPM / JPMorgan Chase & Co. | 0,03 | -7,67 | 8,47 | 9,12 | 5,6516 | 0,3039 | |||
| KO / The Coca-Cola Company | 0,11 | -1,10 | 8,10 | -2,30 | 5,4064 | -0,3070 | |||
| PFFD / Global X Funds - Global X U.S. Preferred ETF | 0,42 | -0,36 | 7,87 | -1,47 | 5,2497 | -0,2508 | |||
| SCHB / Schwab Strategic Trust - Schwab U.S. Broad Market ETF | 0,29 | -0,71 | 6,97 | 9,89 | 4,6487 | 0,2810 | |||
| AAPL / Apple Inc. | 0,03 | -0,29 | 6,20 | -7,91 | 4,1356 | -0,5007 | |||
| XOM / Exxon Mobil Corporation | 0,05 | -0,52 | 5,68 | -9,83 | 3,7878 | -0,5495 | |||
| SYK / Stryker Corporation | 0,01 | 0,00 | 5,03 | 6,27 | 3,3586 | 0,0957 | |||
| SDHY / PGIM Short Duration High Yield Opportunities Fund | 0,29 | -5,41 | 4,84 | -3,34 | 3,2290 | -0,2205 | |||
| NOC / Northrop Grumman Corporation | 0,01 | -1,48 | 4,34 | -3,79 | 2,8947 | -0,2119 | |||
| ABBV / AbbVie Inc. | 0,02 | 0,00 | 3,97 | -11,42 | 2,6514 | -0,4386 | |||
| EMR / Emerson Electric Co. | 0,03 | -0,03 | 3,63 | 21,55 | 2,4211 | 0,3648 | |||
| AXP / American Express Company | 0,01 | -3,26 | 3,55 | 14,69 | 2,3662 | 0,2361 | |||
| BSV / Vanguard Bond Index Funds - Vanguard Short-Term Bond ETF | 0,04 | -0,11 | 3,53 | 0,43 | 2,3591 | -0,0664 | |||
| SCHD / Schwab Strategic Trust - Schwab U.S. Dividend Equity ETF | 0,13 | -1,36 | 3,52 | -6,51 | 2,3484 | -0,2452 | |||
| JNJ / Johnson & Johnson | 0,02 | -0,94 | 3,45 | -8,76 | 2,3002 | -0,3029 | |||
| SCHF / Schwab Strategic Trust - Schwab International Equity ETF | 0,15 | -1,19 | 3,26 | 10,39 | 2,1775 | 0,1410 | |||
| CVS / CVS Health Corporation | 0,04 | -0,74 | 2,74 | 1,03 | 1,8305 | -0,0397 | |||
| AMZN / Amazon.com, Inc. | 0,01 | -0,16 | 2,72 | 15,12 | 1,8142 | 0,1871 | |||
| MUB / iShares Trust - iShares National Muni Bond ETF | 0,03 | 2,62 | 1,7458 | 1,7458 | |||||
| SCHO / Schwab Strategic Trust - Schwab Short-Term U.S. Treasury ETF | 0,10 | -7,62 | 2,53 | -7,49 | 1,6903 | -0,1958 | |||
| QCOM / QUALCOMM Incorporated | 0,02 | -0,06 | 2,53 | 3,61 | 1,6866 | 0,0059 | |||
| NZF / Nuveen Municipal Credit Income Fund | 0,21 | -0,12 | 2,47 | -2,64 | 1,6473 | -0,0999 | |||
| NEE / NextEra Energy, Inc. | 0,03 | 221,02 | 2,39 | 214,59 | 1,5984 | 1,0734 | |||
| PFE / Pfizer Inc. | 0,09 | 3,18 | 2,30 | -1,29 | 1,5321 | -0,0706 | |||
| UNH / UnitedHealth Group Incorporated | 0,01 | 115,38 | 2,28 | 28,29 | 1,5224 | 0,2971 | |||
| CVX / Chevron Corporation | 0,02 | 2,13 | 2,25 | -12,57 | 1,5039 | -0,2724 | |||
| ABT / Abbott Laboratories | 0,01 | -1,10 | 1,96 | 1,40 | 1,3049 | -0,0238 | |||
| MCD / McDonald's Corporation | 0,01 | -0,45 | 1,95 | -6,91 | 1,3039 | -0,1419 | |||
| CSCO / Cisco Systems, Inc. | 0,03 | -15,86 | 1,89 | -5,41 | 1,2605 | -0,1153 | |||
| RTX / RTX Corporation | 0,01 | -0,51 | 1,86 | 9,68 | 1,2401 | 0,0726 | |||
| VTI / Vanguard Index Funds - Vanguard Total Stock Market ETF | 0,01 | 0,33 | 1,86 | 10,93 | 1,2398 | 0,0860 | |||
| WMT / Walmart Inc. | 0,02 | -13,98 | 1,81 | -4,19 | 1,2063 | -0,0937 | |||
| VZ / Verizon Communications Inc. | 0,04 | -0,42 | 1,80 | -5,02 | 1,2003 | -0,1043 | |||
| TFC / Truist Financial Corporation | 0,04 | -4,88 | 1,79 | -0,67 | 1,1938 | -0,0466 | |||
| PEP / PepsiCo, Inc. | 0,01 | 1,34 | 1,40 | -10,73 | 0,9327 | -0,1464 | |||
| CARR / Carrier Global Corporation | 0,02 | -1,04 | 1,35 | 14,20 | 0,9023 | 0,0868 | |||
| T / AT&T Inc. | 0,05 | -33,92 | 1,32 | -32,37 | 0,8784 | -0,4628 | |||
| NUW / Nuveen AMT-Free Municipal Value Fund | 0,09 | 8,09 | 1,26 | 7,61 | 0,8408 | 0,0341 | |||
| GOOGL / Alphabet Inc. | 0,01 | 0,86 | 0,93 | 15,01 | 0,6190 | 0,0630 | |||
| KEY / KeyCorp | 0,05 | 11,80 | 0,89 | 21,84 | 0,5921 | 0,0902 | |||
| SCHZ / Schwab Strategic Trust - Schwab U.S. Aggregate Bond ETF | 0,04 | 13,76 | 0,83 | 14,25 | 0,5513 | 0,0527 | |||
| USB / U.S. Bancorp | 0,02 | -0,29 | 0,79 | 6,77 | 0,5272 | 0,0179 | |||
| XLU / The Select Sector SPDR Trust - The Utilities Select Sector SPDR Fund | 0,01 | -4,04 | 0,64 | -0,62 | 0,4277 | -0,0166 | |||
| AVGO / Broadcom Inc. | 0,00 | 0,00 | 0,64 | 64,77 | 0,4250 | 0,1584 | |||
| OTIS / Otis Worldwide Corporation | 0,01 | -0,43 | 0,58 | -4,47 | 0,3854 | -0,0311 | |||
| XLF / The Select Sector SPDR Trust - The Financial Select Sector SPDR Fund | 0,01 | 0,00 | 0,53 | 5,00 | 0,3510 | 0,0063 | |||
| SCHA / Schwab Strategic Trust - Schwab U.S. Small-Cap ETF | 0,02 | 0,00 | 0,46 | 8,00 | 0,3067 | 0,0134 | |||
| SCHX / Schwab Strategic Trust - Schwab U.S. Large-Cap ETF | 0,02 | -15,50 | 0,43 | -6,37 | 0,2845 | -0,0296 | |||
| SPY / SPDR S&P 500 ETF | 0,00 | 0,00 | 0,42 | 10,53 | 0,2804 | 0,0183 | |||
| COP / ConocoPhillips | 0,00 | 0,00 | 0,42 | -14,58 | 0,2780 | -0,0579 | |||
| SCHG / Schwab Strategic Trust - Schwab U.S. Large-Cap Growth ETF | 0,01 | 0,00 | 0,41 | 16,81 | 0,2737 | 0,0314 | |||
| HD / The Home Depot, Inc. | 0,00 | 0,00 | 0,41 | 0,00 | 0,2726 | -0,0087 | |||
| EFA / iShares Trust - iShares MSCI EAFE ETF | 0,00 | 0,00 | 0,35 | 9,18 | 0,2308 | 0,0129 | |||
| SCHV / Schwab Strategic Trust - Schwab U.S. Large-Cap Value ETF | 0,01 | 0,00 | 0,34 | 4,36 | 0,2237 | 0,0018 | |||
| DRI / Darden Restaurants, Inc. | 0,00 | -6,25 | 0,33 | -1,81 | 0,2182 | -0,0109 | |||
| EOT / Eaton Vance National Municipal Opportunities Trust | 0,02 | -81,51 | 0,32 | -82,01 | 0,2168 | -1,0244 | |||
| XLE / The Select Sector SPDR Trust - The Energy Select Sector SPDR Fund | 0,00 | 0,00 | 0,29 | -9,49 | 0,1914 | -0,0264 | |||
| BAC / Bank of America Corporation | 0,01 | 0,00 | 0,28 | 13,31 | 0,1880 | 0,0168 | |||
| IWV / iShares Trust - iShares Russell 3000 ETF | 0,00 | 0,00 | 0,27 | 10,70 | 0,1799 | 0,0118 | |||
| FTXP / Foothills Exploration, Inc. | 0,00 | -20,00 | 0,27 | 5,51 | 0,1793 | 0,0037 | |||
| DIS / The Walt Disney Company | 0,00 | -1,94 | 0,26 | 22,90 | 0,1762 | 0,0285 | |||
| META / Meta Platforms, Inc. | 0,00 | 0,00 | 0,26 | 27,94 | 0,1744 | 0,0338 | |||
| NVDA / NVIDIA Corporation | 0,00 | 0,24 | 0,1634 | 0,1634 | |||||
| GJR / Strats Trust For Procter & Gambel Security - Preferred Security | 0,00 | 0,00 | 0,24 | -6,61 | 0,1604 | -0,0168 | |||
| BLK / BlackRock, Inc. | 0,00 | 0,00 | 0,24 | 11,16 | 0,1597 | 0,0110 | |||
| ARES / Ares Management Corporation | 0,00 | 0,22 | 0,1467 | 0,1467 | |||||
| MRK / Merck & Co., Inc. | 0,00 | 0,00 | 0,21 | -11,76 | 0,1403 | -0,0240 | |||
| ETN / Eaton Corporation plc | 0,00 | 0,21 | 0,1391 | 0,1391 | |||||
| AXON / Axon Enterprise, Inc. | 0,00 | -37,50 | 0,21 | -1,90 | 0,1381 | -0,0068 | |||
| FE / FirstEnergy Corp. | 0,00 | -100,00 | 0,00 | 0,0000 | |||||
| MIY / BlackRock MuniYield Michigan Quality Fund, Inc. | 0,00 | -100,00 | 0,00 | 0,0000 |