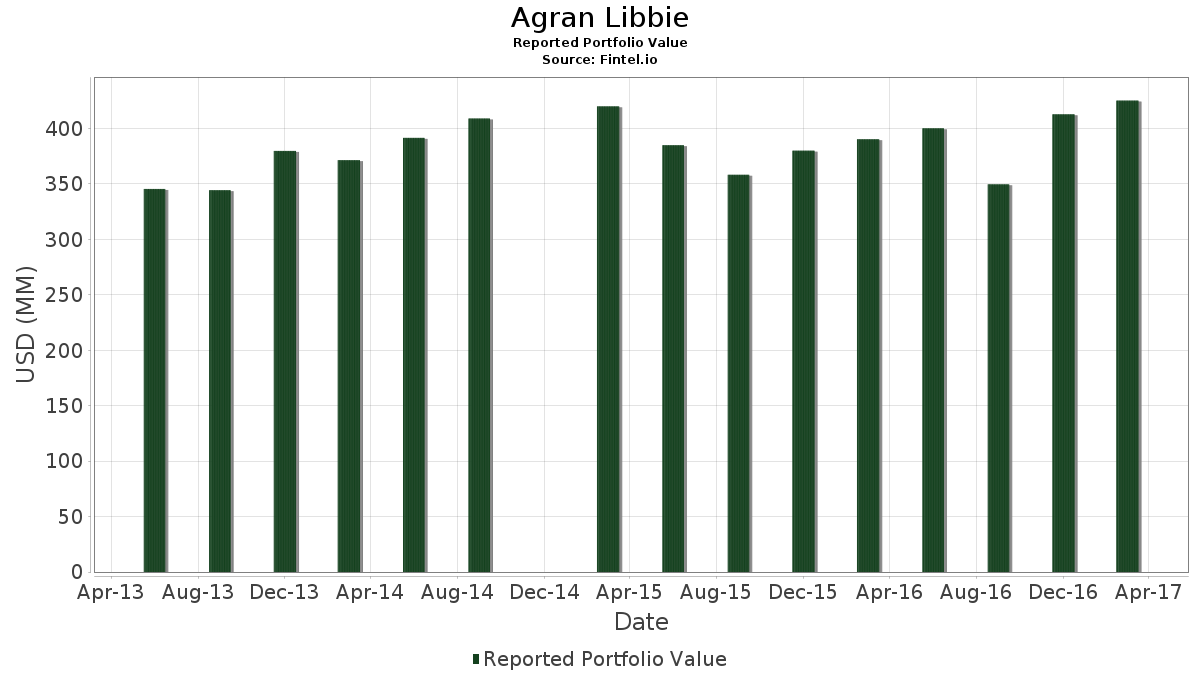
Statistiques de base
| Valeur du portefeuille | $ 425 250 000 |
| Positions actuelles | 123 |
Dernières positions, performances, ASG (à partir des dépôts 13F, 13D)
Agran Libbie a déclaré un total de 123 positions dans ses derniers dépôts auprès de la SEC. La valeur la plus récente du portefeuille est calculée à 425 250 000 USD. Les actifs sous gestion réels (ASG) sont cette valeur plus les liquidités (qui ne sont pas divulguées). Les principales positions de Agran Libbie sont Apple Inc. (US:AAPL) , Berkshire Hathaway Inc. (US:BRK.A) , Johnson & Johnson (US:JNJ) , Berkshire Hathaway Inc. (US:BRK.B) , and Meta Platforms, Inc. (US:META) . Les nouvelles positions de Agran Libbie incluent Pfizer Inc. (US:PFE) , Allergan plc (US:018490100) , IDEXX Laboratories, Inc. (US:IDXX) , ONEOK, Inc. (US:OKE) , and Roper Technologies, Inc. (US:ROP) .
Meilleures augmentations ce trimestre
Nous utilisons la variation de l'allocation du portefeuille car il s'agit de l'indicateur le plus significatif. Les changements peuvent être dus à des transactions ou à des variations de prix des actions.
| Titre | Actions (en millions) |
Valeur ($ en millions) |
% du portefeuille | ΔPortefeuille % |
|---|---|---|---|---|
| 0,20 | 29,28 | 6,8851 | 1,0704 | |
| 0,02 | 3,03 | 0,7125 | 0,7125 | |
| 0,08 | 2,12 | 0,4997 | 0,4997 | |
| 0,07 | 10,61 | 2,4948 | 0,4150 | |
| 0,01 | 1,60 | 0,3753 | 0,3753 | |
| 0,15 | 8,20 | 1,9276 | 0,3298 | |
| 0,03 | 1,28 | 0,3019 | 0,3019 | |
| 0,01 | 5,82 | 1,3688 | 0,2140 | |
| 0,28 | 6,00 | 1,4105 | 0,1474 | |
| 0,01 | 0,55 | 0,1303 | 0,1303 |
Principales baisses ce trimestre
Nous utilisons la variation de l'allocation du portefeuille car il s'agit de l'indicateur le plus significatif. Les changements peuvent être dus à des transactions ou à des variations de prix des actions.
| Titre | Actions (en millions) |
Valeur ($ en millions) |
% du portefeuille | ΔPortefeuille % |
|---|---|---|---|---|
| 0,00 | 0,00 | -0,5660 | ||
| 0,16 | 9,39 | 2,2091 | -0,3287 | |
| 0,09 | 4,09 | 0,9620 | -0,2875 | |
| 0,10 | 10,40 | 2,4468 | -0,2692 | |
| 0,16 | 5,22 | 1,2266 | -0,2688 | |
| 0,07 | 3,51 | 0,8263 | -0,2459 | |
| 0,16 | 7,99 | 1,8784 | -0,2135 | |
| 0,10 | 7,99 | 1,8777 | -0,1645 | |
| 0,27 | 8,03 | 1,8871 | -0,1612 | |
| 0,09 | 6,24 | 1,4667 | -0,1498 |
Déclarations 13F et dépôts de fonds
Ce formulaire a été déposé le 2017-04-27 pour la période de déclaration 2017-03-31. Cliquez sur l'icône du lien pour voir l'historique complet des transactions.
Mettre à niveau pour débloquer les données premium et exporter vers Excel ![]() .
.
| Titre | Type | Prix moyen de l'action | Actions (en millions) |
ΔActions (%) |
ΔActions (%) |
Valeur ($ en millions) |
Portefeuille (%) |
ΔPortefeuille (%) |
|
|---|---|---|---|---|---|---|---|---|---|
| AAPL / Apple Inc. | 0,20 | -1,68 | 29,28 | 21,96 | 6,8851 | 1,0704 | |||
| BRK.A / Berkshire Hathaway Inc. | 0,00 | 0,00 | 15,49 | 2,35 | 3,6428 | -0,0232 | |||
| JNJ / Johnson & Johnson | 0,10 | -0,70 | 12,39 | 7,36 | 2,9141 | 0,1183 | |||
| BRK.B / Berkshire Hathaway Inc. | 0,07 | 0,43 | 10,94 | 2,71 | 2,5726 | -0,0071 | |||
| META / Meta Platforms, Inc. | 0,07 | 0,07 | 10,61 | 23,55 | 2,4948 | 0,4150 | |||
| V / Visa Inc. | 0,12 | -6,31 | 10,54 | 6,72 | 2,4790 | 0,0865 | |||
| CVX / Chevron Corporation | 0,10 | 1,71 | 10,40 | -7,21 | 2,4468 | -0,2692 | |||
| MSFT / Microsoft Corporation | 0,15 | 1,68 | 10,14 | 7,78 | 2,3852 | 0,1058 | |||
| D / Dominion Energy, Inc. | 0,13 | -2,96 | 10,07 | -1,72 | 2,3680 | -0,1136 | |||
| QCOM / QUALCOMM Incorporated | 0,16 | 1,94 | 9,39 | -10,35 | 2,2091 | -0,3287 | |||
| SPG / Simon Property Group, Inc. | 0,05 | 1,00 | 9,16 | -2,21 | 2,1536 | -0,1147 | |||
| EPD / Enterprise Products Partners L.P. - Limited Partnership | 0,31 | 0,45 | 8,60 | 2,56 | 2,0221 | -0,0085 | |||
| GOOGL / Alphabet Inc. | 0,01 | 2,25 | 8,53 | 9,39 | 2,0059 | 0,1172 | |||
| NEE / NextEra Energy, Inc. | 0,06 | -3,97 | 8,34 | 3,19 | 1,9617 | 0,0037 | |||
| OKS / ONEOK Partners, L.P. | 0,15 | -1,01 | 8,20 | 24,25 | 1,9276 | 0,3298 | |||
| RTX / RTX Corporation | 0,07 | -3,64 | 8,07 | -1,36 | 1,8979 | -0,0837 | |||
| GE / General Electric Company | 0,27 | 0,62 | 8,03 | -5,11 | 1,8871 | -0,1612 | |||
| VZ / Verizon Communications Inc. | 0,16 | 1,27 | 7,99 | -7,51 | 1,8784 | -0,2135 | |||
| XOM / Exxon Mobil Corporation | 0,10 | 4,22 | 7,99 | -5,30 | 1,8777 | -0,1645 | |||
| INTC / Intel Corporation | 0,22 | -2,18 | 7,77 | -2,73 | 1,8262 | -0,1075 | |||
| PEAK / Healthpeak Properties, Inc. | 0,25 | 0,29 | 7,67 | 5,56 | 1,8048 | 0,0438 | |||
| PG / The Procter & Gamble Company | 0,08 | -0,94 | 7,40 | 5,85 | 1,7397 | 0,0469 | |||
| C.WSA / Citigroup, Inc. | 0,02 | -0,29 | 7,35 | 0,49 | 1,7277 | -0,0430 | |||
| GOOG / Alphabet Inc. | 0,01 | 0,20 | 7,02 | 7,68 | 1,6510 | 0,0719 | |||
| JPM / JPMorgan Chase & Co. | 0,07 | 2,61 | 6,58 | 4,46 | 1,5485 | 0,0217 | |||
| GS / The Goldman Sachs Group, Inc. | 0,03 | 0,96 | 6,49 | -3,13 | 1,5262 | -0,0966 | |||
| COST / Costco Wholesale Corporation | 0,04 | -1,15 | 6,43 | 3,54 | 1,5125 | 0,0080 | |||
| UNP / Union Pacific Corporation | 0,06 | 0,62 | 6,36 | 2,80 | 1,4956 | -0,0029 | |||
| GILD / Gilead Sciences, Inc. | 0,09 | -1,47 | 6,24 | -6,55 | 1,4667 | -0,1498 | |||
| KMI / Kinder Morgan, Inc. | 0,28 | 9,57 | 6,00 | 15,01 | 1,4105 | 0,1474 | |||
| AMZN / Amazon.com, Inc. | 0,01 | 3,26 | 5,82 | 22,08 | 1,3688 | 0,2140 | |||
| KO / The Coca-Cola Company | 0,13 | -3,16 | 5,31 | -0,88 | 1,2496 | -0,0488 | |||
| T / AT&T Inc. | 0,13 | 2,78 | 5,30 | 0,42 | 1,2454 | -0,0320 | |||
| TEVA / Teva Pharmaceutical Industries Limited - Depositary Receipt (Common Stock) | 0,16 | -4,56 | 5,22 | -15,52 | 1,2266 | -0,2688 | |||
| VTR / Ventas, Inc. | 0,08 | 7,70 | 4,96 | 12,05 | 1,1654 | 0,0942 | |||
| CELG / Celgene Corp. | 0,04 | -0,01 | 4,68 | 7,49 | 1,1001 | 0,0460 | |||
| BA / The Boeing Company | 0,02 | -1,66 | 4,19 | 11,73 | 0,9855 | 0,0770 | |||
| BDX / Becton, Dickinson and Company | 0,02 | -1,83 | 4,13 | 8,77 | 0,9714 | 0,0515 | |||
| DCI / Donaldson Company, Inc. | 0,09 | -29,23 | 4,09 | -20,70 | 0,9620 | -0,2875 | |||
| WFC / Wells Fargo & Company | 0,07 | -8,51 | 3,91 | -7,59 | 0,9195 | -0,1053 | |||
| COP / ConocoPhillips | 0,07 | -20,19 | 3,51 | -20,62 | 0,8263 | -0,2459 | |||
| DIS / The Walt Disney Company | 0,03 | -0,14 | 3,35 | 8,63 | 0,7875 | 0,0408 | |||
| HON / Honeywell International Inc. | 0,03 | -0,59 | 3,34 | 7,15 | 0,7857 | 0,0305 | |||
| AMT / American Tower Corporation | 0,03 | -0,09 | 3,22 | 14,88 | 0,7570 | 0,0783 | |||
| ABBV / AbbVie Inc. | 0,05 | -0,11 | 3,17 | 3,93 | 0,7454 | 0,0067 | |||
| MMM / 3M Company | 0,02 | 3,03 | 0,7125 | 0,7125 | |||||
| ORCL / Oracle Corporation | 0,07 | -10,24 | 2,95 | 4,13 | 0,6935 | 0,0076 | |||
| BAC / Bank of America Corporation | 0,12 | 0,84 | 2,83 | 7,63 | 0,6667 | 0,0287 | |||
| VNO / Vornado Realty Trust | 0,03 | -3,50 | 2,62 | -7,26 | 0,6154 | -0,0681 | |||
| TSLA / Tesla, Inc. | 0,01 | -4,05 | 2,50 | 24,91 | 0,5884 | 0,1032 | |||
| US6550441058 / Noble Energy, Inc. | 0,07 | -6,76 | 2,38 | -15,88 | 0,5606 | -0,1258 | |||
| OAK / Oaktree Capital Group, LLC | 0,05 | -6,40 | 2,37 | 13,04 | 0,5564 | 0,0495 | |||
| MDLZ / Mondelez International, Inc. | 0,05 | -3,40 | 2,36 | -6,12 | 0,5559 | -0,0540 | |||
| NKE / NIKE, Inc. | 0,04 | -0,92 | 2,24 | 8,63 | 0,5267 | 0,0273 | |||
| ISRG / Intuitive Surgical, Inc. | 0,00 | 0,00 | 2,20 | 20,85 | 0,5166 | 0,0763 | |||
| GIS / General Mills, Inc. | 0,04 | -6,07 | 2,20 | -10,29 | 0,5164 | -0,0765 | |||
| PHO / Invesco Exchange-Traded Fund Trust - Invesco Water Resources ETF | 0,08 | -6,89 | 2,12 | -1,44 | 0,4997 | 0,4997 | |||
| ABT / Abbott Laboratories | 0,05 | -0,64 | 2,11 | 14,90 | 0,4969 | 0,0515 | |||
| SXL / Sunoco Logistics Partners L.P. | 0,06 | -1,52 | 2,07 | 0,44 | 0,4861 | -0,0124 | |||
| AMLP / ALPS ETF Trust - Alerian MLP ETF | 0,15 | 25,20 | 1,91 | 26,27 | 0,4487 | 0,0827 | |||
| AMAT / Applied Materials, Inc. | 0,04 | 0,00 | 1,68 | 20,56 | 0,3944 | 0,0575 | |||
| PSX / Phillips 66 | 0,02 | -4,31 | 1,62 | -12,27 | 0,3800 | -0,0661 | |||
| SO / The Southern Company | 0,03 | -16,08 | 1,60 | -15,07 | 0,3765 | -0,0801 | |||
| AVGO / Broadcom Inc. | 0,01 | 10,70 | 1,60 | 37,11 | 0,3753 | 0,3753 | |||
| BX / Blackstone Inc. | 0,05 | -1,02 | 1,58 | 8,80 | 0,3720 | 0,0199 | |||
| CSCO / Cisco Systems, Inc. | 0,05 | -1,72 | 1,55 | 9,94 | 0,3643 | 0,0230 | |||
| ATR / AptarGroup, Inc. | 0,02 | 0,00 | 1,50 | 4,82 | 0,3530 | 0,0061 | |||
| MCD / McDonald's Corporation | 0,01 | -26,33 | 1,40 | -21,53 | 0,3283 | -0,1026 | |||
| CVS / CVS Health Corporation | 0,02 | -17,81 | 1,35 | -18,25 | 0,3182 | -0,0827 | |||
| BABA / Alibaba Group Holding Limited - Depositary Receipt (Common Stock) | 0,01 | -12,18 | 1,34 | 7,86 | 0,3163 | 0,0143 | |||
| SBUX / Starbucks Corporation | 0,02 | 3,03 | 1,31 | 8,34 | 0,3085 | 0,0152 | |||
| BMY / Bristol-Myers Squibb Company | 0,02 | -6,05 | 1,30 | -12,53 | 0,3069 | -0,0545 | |||
| DEI / Douglas Emmett, Inc. | 0,03 | 1,28 | 0,3019 | 0,3019 | |||||
| MDT / Medtronic plc | 0,01 | -3,67 | 1,16 | 8,91 | 0,2730 | 0,0148 | |||
| NXPI / NXP Semiconductors N.V. | 0,01 | -1,12 | 1,14 | 4,38 | 0,2690 | 0,0036 | |||
| GLD / SPDR Gold Trust | 0,01 | -4,61 | 1,14 | 3,35 | 0,2688 | 0,0009 | |||
| WTRG / Essential Utilities, Inc. | 0,03 | -1,77 | 1,07 | 5,11 | 0,2514 | 0,0051 | |||
| IBM / International Business Machines Corporation | 0,01 | -4,42 | 1,05 | 0,19 | 0,2479 | -0,0069 | |||
| CMI / Cummins Inc. | 0,01 | -0,57 | 1,05 | 10,03 | 0,2476 | 0,0158 | |||
| OXY / Occidental Petroleum Corporation | 0,02 | 19,87 | 1,02 | 6,57 | 0,2403 | 0,0081 | |||
| LVS / Las Vegas Sands Corp. | 0,02 | 1,00 | 1,01 | 8,02 | 0,2375 | 0,0110 | |||
| PSA / Public Storage | 0,00 | 1,17 | 0,95 | -0,94 | 0,2227 | -0,0089 | |||
| C / Citigroup Inc. | 0,01 | 49,39 | 0,90 | 50,34 | 0,2107 | 0,0663 | |||
| NOC / Northrop Grumman Corporation | 0,00 | 5,04 | 0,89 | 7,47 | 0,2098 | 0,0087 | |||
| F / Ford Motor Company | 0,08 | -7,64 | 0,89 | -11,40 | 0,2083 | -0,0339 | |||
| PANW / Palo Alto Networks, Inc. | 0,01 | 10,09 | 0,79 | -0,76 | 0,1851 | -0,0070 | |||
| CWT / California Water Service Group | 0,02 | 0,00 | 0,77 | 5,74 | 0,1820 | 0,0047 | |||
| MRK / Merck & Co., Inc. | 0,01 | 82,96 | 0,76 | 97,65 | 0,1780 | 0,0852 | |||
| SCHW / The Charles Schwab Corporation | 0,02 | 14,15 | 0,76 | 18,13 | 0,1778 | 0,0228 | |||
| CAT / Caterpillar Inc. | 0,01 | -12,94 | 0,65 | -12,94 | 0,1519 | -0,0278 | |||
| MMP / Magellan Midstream Partners L.P. | 0,01 | 0,00 | 0,55 | 1,65 | 0,1303 | 0,1303 | |||
| DE / Deere & Company | 0,01 | -0,49 | 0,55 | 5,14 | 0,1298 | 0,0027 | |||
| US16941M1099 / China Mobile Ltd. | 0,01 | -0,55 | 0,50 | 4,82 | 0,1176 | 0,1176 | |||
| HD / The Home Depot, Inc. | 0,00 | 0,00 | 0,50 | 9,45 | 0,1171 | 0,0069 | |||
| ZION / Zions Bancorporation, National Association | 0,01 | 0,00 | 0,49 | -2,58 | 0,1155 | -0,0066 | |||
| AMGN / Amgen Inc. | 0,00 | 4,10 | 0,46 | 16,79 | 0,1079 | 0,0128 | |||
| RY / Royal Bank of Canada | 0,01 | -5,97 | 0,46 | 1,10 | 0,1079 | -0,0020 | |||
| PEP / PepsiCo, Inc. | 0,00 | -1,03 | 0,45 | 5,88 | 0,1058 | 0,0029 | |||
| SLV / iShares Silver Trust | 0,02 | -8,84 | 0,41 | 4,07 | 0,0962 | 0,0010 | |||
| FOX / Fox Corporation | 0,01 | -0,19 | 0,39 | 15,38 | 0,0917 | 0,0098 | |||
| PM / Philip Morris International Inc. | 0,00 | -0,67 | 0,37 | 22,59 | 0,0868 | 0,0139 | |||
| FLS / Flowserve Corporation | 0,01 | -31,89 | 0,37 | -31,41 | 0,0868 | -0,0435 | |||
| MIDD / The Middleby Corporation | 0,00 | 0,00 | 0,37 | 5,75 | 0,0865 | 0,0023 | |||
| EOG / EOG Resources, Inc. | 0,00 | 39,85 | 0,36 | 34,96 | 0,0844 | 0,0200 | |||
| TRP / TC Energy Corporation | 0,01 | 0,00 | 0,35 | 2,05 | 0,0818 | -0,0008 | |||
| MO / Altria Group, Inc. | 0,00 | -1,13 | 0,31 | 4,67 | 0,0738 | 0,0738 | |||
| PFE / Pfizer Inc. | 0,01 | 0,31 | 0,0738 | 0,0738 | |||||
| SLB / Schlumberger Limited | 0,00 | 21,49 | 0,31 | 13,19 | 0,0727 | 0,0065 | |||
| JCI / Johnson Controls International plc | 0,01 | -9,04 | 0,31 | -6,97 | 0,0722 | -0,0077 | |||
| CRM / Salesforce, Inc. | 0,00 | -2,65 | 0,30 | 17,44 | 0,0713 | 0,0088 | |||
| GD / General Dynamics Corporation | 0,00 | 7,41 | 0,27 | 16,31 | 0,0637 | 0,0637 | |||
| NSC / Norfolk Southern Corporation | 0,00 | -3,21 | 0,25 | 0,40 | 0,0595 | -0,0015 | |||
| 018490100 / Allergan plc | 0,00 | 0,25 | 0,0595 | 0,0595 | |||||
| IDXX / IDEXX Laboratories, Inc. | 0,00 | 0,25 | 0,0581 | 0,0581 | |||||
| MRVL / Marvell Technology, Inc. | 0,02 | 0,00 | 0,24 | 10,19 | 0,0560 | 0,0560 | |||
| NVS / Novartis AG - Depositary Receipt (Common Stock) | 0,00 | -2,44 | 0,22 | -0,45 | 0,0524 | -0,0018 | |||
| OKE / ONEOK, Inc. | 0,00 | 0,21 | 0,0501 | 0,0501 | |||||
| DUK / Duke Energy Corporation | 0,00 | -3,15 | 0,21 | 2,45 | 0,0491 | -0,0003 | |||
| ROP / Roper Technologies, Inc. | 0,00 | 0,21 | 0,0489 | 0,0489 | |||||
| ECL / Ecolab Inc. | 0,00 | -11,46 | 0,20 | -5,19 | 0,0473 | -0,0041 | |||
| CPRX / Catalyst Pharmaceuticals, Inc. | 0,04 | 0,00 | 0,09 | 86,96 | 0,0202 | 0,0091 | |||
| ARWR / Arrowhead Pharmaceuticals, Inc. | 0,02 | 0,00 | 0,04 | 18,75 | 0,0089 | 0,0089 | |||
| QLGN / Qualigen Therapeutics, Inc. | 0,01 | 0,00 | 0,01 | -46,43 | 0,0035 | -0,0033 | |||
| XLP / The Select Sector SPDR Trust - The Consumer Staples Select Sector SPDR Fund | 0,00 | -100,00 | 0,00 | -100,00 | 0,0000 | ||||
| QCP / Quality Care Properties, Inc. | 0,00 | -100,00 | 0,00 | -100,00 | 0,0000 | ||||
| AMJ / JPMorgan Alerian MLP Index ETN - Corporate Bond/Note | 0,00 | -100,00 | 0,00 | -100,00 | 0,0000 | ||||
| XLK / The Select Sector SPDR Trust - The Technology Select Sector SPDR Fund | 0,00 | -100,00 | 0,00 | -100,00 | -0,5660 | ||||
| XLV / The Select Sector SPDR Trust - The Health Care Select Sector SPDR Fund | 0,00 | -100,00 | 0,00 | -100,00 | 0,0000 | ||||
| US2655041000 / Dunkin' Brands Group, Inc. | 0,00 | -100,00 | 0,00 | -100,00 | -0,0538 | ||||
| NVO / Novo Nordisk A/S - Depositary Receipt (Common Stock) | 0,00 | -100,00 | 0,00 | -100,00 | -0,0559 | ||||
| XLE / The Select Sector SPDR Trust - The Energy Select Sector SPDR Fund | 0,00 | -100,00 | 0,00 | -100,00 | 0,0000 | ||||
| MMLP / Martin Midstream Partners L.P. - Limited Partnership | 0,00 | -100,00 | 0,00 | -100,00 | 0,0000 | ||||
| TGT / Target Corporation | 0,00 | -100,00 | 0,00 | -100,00 | -0,1189 |