Statistiques de base
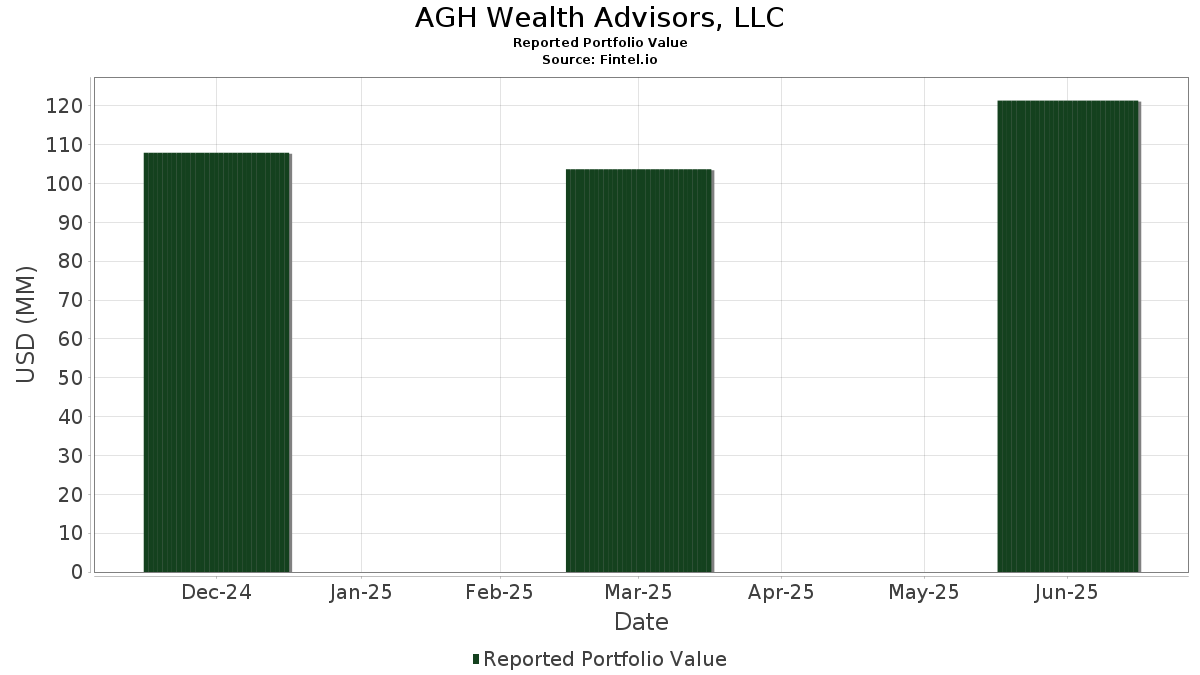
| Valeur du portefeuille | $ 121 337 655 |
| Positions actuelles | 127 |
Dernières positions, performances, ASG (à partir des dépôts 13F, 13D)
AGH Wealth Advisors, LLC a déclaré un total de 127 positions dans ses derniers dépôts auprès de la SEC. La valeur la plus récente du portefeuille est calculée à 121 337 655 USD. Les actifs sous gestion réels (ASG) sont cette valeur plus les liquidités (qui ne sont pas divulguées). Les principales positions de AGH Wealth Advisors, LLC sont SPDR S&P 500 ETF (US:SPY) , American Century ETF Trust - Avantis International Equity ETF (US:AVDE) , J.P. Morgan Exchange-Traded Fund Trust - JPMorgan Active Bond ETF (US:JBND) , Microsoft Corporation (US:MSFT) , and Invesco Exchange-Traded Fund Trust II - Invesco NASDAQ 100 ETF (US:QQQM) . Les nouvelles positions de AGH Wealth Advisors, LLC incluent American Tower Corporation (US:AMT) , Intel Corporation (US:INTC) , Synopsys, Inc. (US:SNPS) , Boston Scientific Corporation (US:BSX) , and Royal Caribbean Cruises Ltd. (US:RCL) .
Meilleures augmentations ce trimestre
Nous utilisons la variation de l'allocation du portefeuille car il s'agit de l'indicateur le plus significatif. Les changements peuvent être dus à des transactions ou à des variations de prix des actions.
| Titre | Actions (en millions) |
Valeur ($ en millions) |
% du portefeuille | ΔPortefeuille % |
|---|---|---|---|---|
| 0,02 | 10,71 | 6,8907 | 1,5317 | |
| 0,01 | 2,58 | 2,1232 | 0,6567 | |
| 0,00 | 0,29 | 0,2381 | 0,2381 | |
| 0,01 | 0,28 | 0,2320 | 0,2320 | |
| 0,00 | 0,27 | 0,2227 | 0,2227 | |
| 0,00 | 0,26 | 0,2140 | 0,2140 | |
| 0,00 | 0,24 | 0,1977 | 0,1977 | |
| 0,00 | 0,23 | 0,1933 | 0,1933 | |
| 0,00 | 0,23 | 0,1903 | 0,1903 | |
| 0,00 | 0,23 | 0,1861 | 0,1861 |
Principales baisses ce trimestre
Nous utilisons la variation de l'allocation du portefeuille car il s'agit de l'indicateur le plus significatif. Les changements peuvent être dus à des transactions ou à des variations de prix des actions.
| Titre | Actions (en millions) |
Valeur ($ en millions) |
% du portefeuille | ΔPortefeuille % |
|---|---|---|---|---|
| 0,02 | 4,81 | 3,0986 | -2,1298 | |
| 0,11 | 8,46 | 5,4446 | -1,8300 | |
| 0,12 | 6,37 | 4,0975 | -1,7477 | |
| 0,02 | 1,24 | 0,7976 | -1,1445 | |
| 0,02 | 5,43 | 3,4933 | -0,8041 | |
| 0,05 | 2,88 | 1,8527 | -0,7852 | |
| 0,00 | 0,52 | 0,3335 | -0,7705 | |
| 0,04 | 3,86 | 2,4834 | -0,7365 | |
| 0,00 | 1,55 | 0,9950 | -0,6217 | |
| 0,02 | 5,26 | 3,3851 | -0,5349 |
Déclarations 13F et dépôts de fonds
Ce formulaire a été déposé le 2025-08-05 pour la période de déclaration 2025-06-30. Cliquez sur l'icône du lien pour voir l'historique complet des transactions.
Mettre à niveau pour débloquer les données premium et exporter vers Excel ![]() .
.
| Titre | Type | Prix moyen de l'action | Actions (en millions) |
ΔActions (%) |
ΔActions (%) |
Valeur ($ en millions) |
Portefeuille (%) |
ΔPortefeuille (%) |
|
|---|---|---|---|---|---|---|---|---|---|
| SPY / SPDR S&P 500 ETF | 0,02 | 74,58 | 10,71 | 92,75 | 6,8907 | 1,5317 | |||
| AVDE / American Century ETF Trust - Avantis International Equity ETF | 0,11 | 0,45 | 8,46 | 12,19 | 5,4446 | -1,8300 | |||
| JBND / J.P. Morgan Exchange-Traded Fund Trust - JPMorgan Active Bond ETF | 0,12 | 4,94 | 6,37 | 5,08 | 4,0975 | -1,7477 | |||
| MSFT / Microsoft Corporation | 0,01 | 0,74 | 5,72 | 33,48 | 3,6797 | -0,4526 | |||
| QQQM / Invesco Exchange-Traded Fund Trust II - Invesco NASDAQ 100 ETF | 0,02 | 3,57 | 5,43 | 21,87 | 3,4933 | -0,8041 | |||
| GLD / SPDR Gold Trust | 0,02 | 22,36 | 5,26 | 29,46 | 3,3851 | -0,5349 | |||
| NVDA / NVIDIA Corporation | 0,03 | 3,20 | 5,02 | 50,42 | 3,2336 | 0,0116 | |||
| AAPL / Apple Inc. | 0,02 | -3,82 | 4,81 | -11,18 | 3,0986 | -2,1298 | |||
| SPYG / SPDR Series Trust - SPDR Portfolio S&P 500 Growth ETF | 0,04 | -2,52 | 3,86 | 15,64 | 2,4834 | -0,7365 | |||
| AMZN / Amazon.com, Inc. | 0,01 | -4,82 | 3,00 | 9,77 | 2,4726 | -0,1644 | |||
| PWV / Invesco Exchange-Traded Fund Trust - Invesco Large Cap Value ETF | 0,05 | 0,83 | 2,88 | 5,27 | 1,8527 | -0,7852 | |||
| META / Meta Platforms, Inc. | 0,00 | -0,14 | 2,62 | 27,87 | 1,6867 | -0,2904 | |||
| AVGO / Broadcom Inc. | 0,01 | 2,93 | 2,58 | 69,47 | 2,1232 | 0,6567 | |||
| JPM / JPMorgan Chase & Co. | 0,01 | -2,79 | 1,89 | 14,89 | 1,5582 | -0,0292 | |||
| NFLX / Netflix, Inc. | 0,00 | -2,78 | 1,55 | 39,66 | 0,9953 | -0,0733 | |||
| BRK.B / Berkshire Hathaway Inc. | 0,00 | 1,14 | 1,55 | -7,76 | 0,9950 | -0,6217 | |||
| GOOGL / Alphabet Inc. | 0,01 | 4,85 | 1,47 | 19,50 | 0,9472 | -0,2411 | |||
| V / Visa Inc. | 0,00 | -4,04 | 1,34 | -2,75 | 0,8639 | -0,4681 | |||
| GOOG / Alphabet Inc. | 0,01 | 21,19 | 1,28 | 37,65 | 0,8212 | -0,0733 | |||
| AVUS / American Century ETF Trust - Avantis U.S. Equity ETF | 0,01 | 2,84 | 1,25 | 12,31 | 0,8044 | -0,2699 | |||
| AVLV / American Century ETF Trust - Avantis U.S. Large Cap Value ETF | 0,02 | -41,18 | 1,24 | -38,45 | 0,7976 | -1,1445 | |||
| XOM / Exxon Mobil Corporation | 0,01 | 3,97 | 1,12 | -5,79 | 0,7224 | -0,4266 | |||
| VZ / Verizon Communications Inc. | 0,02 | 23,44 | 1,06 | 17,70 | 0,6852 | -0,1871 | |||
| SPSM / SPDR Series Trust - SPDR Portfolio S&P 600 Small Cap ETF | 0,02 | 0,65 | 1,03 | 5,22 | 0,6619 | -0,2814 | |||
| LLY / Eli Lilly and Company | 0,00 | 3,88 | 0,88 | -2,01 | 0,5644 | -0,2985 | |||
| IWV / iShares Trust - iShares Russell 3000 ETF | 0,00 | 0,00 | 0,88 | 10,48 | 0,5633 | -0,2008 | |||
| EVRG / Evergy, Inc. | 0,01 | 21,43 | 0,83 | 21,41 | 0,6830 | 0,0245 | |||
| CRM / Salesforce, Inc. | 0,00 | -0,88 | 0,83 | 0,73 | 0,6823 | -0,1106 | |||
| TSLA / Tesla, Inc. | 0,00 | 9,75 | 0,83 | 34,58 | 0,6807 | 0,0884 | |||
| BAC / Bank of America Corporation | 0,02 | 32,50 | 0,82 | 50,46 | 0,6760 | 0,1494 | |||
| JNJ / Johnson & Johnson | 0,00 | -1,98 | 0,70 | -9,73 | 0,5742 | -0,1702 | |||
| RTX / RTX Corporation | 0,00 | -5,31 | 0,67 | 4,53 | 0,4306 | -0,1878 | |||
| KO / The Coca-Cola Company | 0,01 | 0,27 | 0,67 | -0,89 | 0,4305 | -0,2210 | |||
| GD / General Dynamics Corporation | 0,00 | 0,36 | 0,65 | 7,30 | 0,5337 | -0,0480 | |||
| WMT / Walmart Inc. | 0,01 | 0,40 | 0,62 | 11,80 | 0,5078 | -0,0237 | |||
| IWF / iShares Trust - iShares Russell 1000 Growth ETF | 0,00 | 0,00 | 0,62 | 17,59 | 0,3962 | -0,1089 | |||
| JPST / J.P. Morgan Exchange-Traded Fund Trust - JPMorgan Ultra-Short Income ETF | 0,01 | 0,00 | 0,61 | 0,16 | 0,5012 | -0,0849 | |||
| ABBV / AbbVie Inc. | 0,00 | 12,00 | 0,61 | -0,82 | 0,3902 | -0,1993 | |||
| ETN / Eaton Corporation plc | 0,00 | 3,69 | 0,56 | 36,17 | 0,3614 | -0,0364 | |||
| BA / The Boeing Company | 0,00 | 11,80 | 0,55 | 37,22 | 0,3565 | -0,0326 | |||
| PLTR / Palantir Technologies Inc. | 0,00 | 21,92 | 0,55 | 97,12 | 0,3527 | 0,0842 | |||
| T / AT&T Inc. | 0,02 | 1,07 | 0,54 | 3,42 | 0,4487 | -0,0591 | |||
| GE / General Electric Company | 0,00 | -2,51 | 0,54 | 25,41 | 0,3468 | -0,0679 | |||
| HD / The Home Depot, Inc. | 0,00 | 1,48 | 0,53 | 1,54 | 0,4357 | -0,0666 | |||
| QQQ / Invesco QQQ Trust, Series 1 | 0,00 | 0,00 | 0,53 | 17,63 | 0,3397 | -0,0932 | |||
| WMB / The Williams Companies, Inc. | 0,01 | -7,40 | 0,52 | -2,78 | 0,3377 | -0,1824 | |||
| UNH / UnitedHealth Group Incorporated | 0,00 | -23,98 | 0,52 | -54,72 | 0,3335 | -0,7705 | |||
| PM / Philip Morris International Inc. | 0,00 | -7,34 | 0,51 | 6,22 | 0,3301 | -0,1353 | |||
| GJR / Strats Trust For Procter & Gambel Security - Preferred Security | 0,00 | 10,01 | 0,50 | 2,86 | 0,3244 | -0,1484 | |||
| COP / ConocoPhillips | 0,01 | -0,66 | 0,50 | -15,07 | 0,3192 | -0,2445 | |||
| MA / Mastercard Incorporated | 0,00 | -0,34 | 0,49 | 2,30 | 0,3153 | -0,1473 | |||
| LIN / Linde plc | 0,00 | 25,83 | 0,48 | 26,84 | 0,3975 | 0,0305 | |||
| CSCO / Cisco Systems, Inc. | 0,01 | -0,50 | 0,48 | 11,89 | 0,3090 | -0,1051 | |||
| INTU / Intuit Inc. | 0,00 | 9,27 | 0,47 | 40,36 | 0,3046 | -0,0211 | |||
| AMAT / Applied Materials, Inc. | 0,00 | 4,19 | 0,46 | 31,43 | 0,2962 | -0,0416 | |||
| ORCL / Oracle Corporation | 0,00 | 1,79 | 0,46 | 59,03 | 0,2953 | 0,0172 | |||
| UBER / Uber Technologies, Inc. | 0,00 | -4,66 | 0,45 | 22,34 | 0,2890 | -0,0658 | |||
| TRV / The Travelers Companies, Inc. | 0,00 | 0,87 | 0,44 | 2,11 | 0,3587 | -0,0527 | |||
| CME / CME Group Inc. | 0,00 | 25,32 | 0,43 | 30,21 | 0,2774 | -0,0420 | |||
| ACN / Accenture plc | 0,00 | -7,00 | 0,42 | -11,02 | 0,2708 | -0,1849 | |||
| CVX / Chevron Corporation | 0,00 | -16,97 | 0,42 | -29,01 | 0,3435 | -0,2223 | |||
| COST / Costco Wholesale Corporation | 0,00 | 0,73 | 0,41 | 5,38 | 0,2650 | -0,1118 | |||
| SYK / Stryker Corporation | 0,00 | 2,20 | 0,40 | 8,63 | 0,2600 | -0,0988 | |||
| MMC / Marsh & McLennan Companies, Inc. | 0,00 | 1,72 | 0,40 | -8,86 | 0,2583 | -0,1666 | |||
| ISRG / Intuitive Surgical, Inc. | 0,00 | 17,36 | 0,40 | 28,62 | 0,2577 | -0,0423 | |||
| PANW / Palo Alto Networks, Inc. | 0,00 | 5,45 | 0,38 | 26,26 | 0,2419 | -0,0448 | |||
| AXP / American Express Company | 0,00 | 5,22 | 0,37 | 24,83 | 0,2400 | -0,0484 | |||
| COF / Capital One Financial Corporation | 0,00 | 5,42 | 0,37 | 25,25 | 0,2397 | -0,0475 | |||
| SPGI / S&P Global Inc. | 0,00 | -15,37 | 0,37 | -12,29 | 0,2392 | -0,1691 | |||
| UNP / Union Pacific Corporation | 0,00 | -5,28 | 0,37 | -7,71 | 0,2388 | -0,1493 | |||
| MCK / McKesson Corporation | 0,00 | -2,89 | 0,37 | 5,73 | 0,2377 | -0,0993 | |||
| WELL / Welltower Inc. | 0,00 | 0,40 | 0,35 | 0,87 | 0,2235 | -0,1091 | |||
| TMO / Thermo Fisher Scientific Inc. | 0,00 | -13,59 | 0,35 | -29,59 | 0,2223 | -0,2510 | |||
| GWW / W.W. Grainger, Inc. | 0,00 | 1,85 | 0,34 | 7,17 | 0,2216 | -0,0881 | |||
| PSX / Phillips 66 | 0,00 | 2,84 | 0,34 | -0,58 | 0,2196 | -0,1117 | |||
| PEP / PepsiCo, Inc. | 0,00 | -18,94 | 0,34 | -28,72 | 0,2192 | -0,2412 | |||
| ABT / Abbott Laboratories | 0,00 | -1,93 | 0,34 | 0,59 | 0,2794 | -0,0458 | |||
| SBUX / Starbucks Corporation | 0,00 | 45,33 | 0,33 | 35,77 | 0,2155 | -0,0224 | |||
| SHW / The Sherwin-Williams Company | 0,00 | 3,33 | 0,33 | 1,54 | 0,2725 | -0,0414 | |||
| TXN / Texas Instruments Incorporated | 0,00 | -32,78 | 0,33 | -22,51 | 0,2110 | -0,1962 | |||
| LOW / Lowe's Companies, Inc. | 0,00 | 0,14 | 0,32 | -5,00 | 0,2670 | -0,0611 | |||
| TMUS / T-Mobile US, Inc. | 0,00 | -2,84 | 0,32 | -13,15 | 0,2044 | -0,1486 | |||
| MET / MetLife, Inc. | 0,00 | 6,81 | 0,31 | 6,99 | 0,1973 | -0,0792 | |||
| AMT / American Tower Corporation | 0,00 | 0,29 | 0,2381 | 0,2381 | |||||
| USB / U.S. Bancorp | 0,01 | -42,75 | 0,28 | -38,66 | 0,1830 | -0,2641 | |||
| INTC / Intel Corporation | 0,01 | 0,28 | 0,2320 | 0,2320 | |||||
| QCOM / QUALCOMM Incorporated | 0,00 | -11,44 | 0,28 | -8,28 | 0,2286 | -0,0628 | |||
| SNPS / Synopsys, Inc. | 0,00 | 0,27 | 0,2227 | 0,2227 | |||||
| GSCE / GS Connect S&P GSCI Enhanced Commodity Total Return ETN | 0,00 | 1,34 | 0,27 | 31,03 | 0,1717 | -0,0243 | |||
| EQIX / Equinix, Inc. | 0,00 | 1,21 | 0,27 | -1,12 | 0,1715 | -0,0889 | |||
| APD / Air Products and Chemicals, Inc. | 0,00 | 1,84 | 0,27 | -2,57 | 0,1708 | -0,0921 | |||
| CMCSA / Comcast Corporation | 0,01 | -6,52 | 0,26 | -9,62 | 0,1695 | -0,1115 | |||
| PYPL / PayPal Holdings, Inc. | 0,00 | 11,06 | 0,26 | 26,83 | 0,1676 | -0,0310 | |||
| BSX / Boston Scientific Corporation | 0,00 | 0,26 | 0,2140 | 0,2140 | |||||
| MCD / McDonald's Corporation | 0,00 | 0,46 | 0,26 | -5,90 | 0,2104 | -0,0517 | |||
| SRE / Sempra | 0,00 | -1,33 | 0,25 | 4,56 | 0,1627 | -0,0701 | |||
| IBM / International Business Machines Corporation | 0,00 | 2,03 | 0,25 | 21,15 | 0,2080 | 0,0067 | |||
| CVS / CVS Health Corporation | 0,00 | 7,47 | 0,25 | 9,57 | 0,1622 | -0,0600 | |||
| FI / Fiserv, Inc. | 0,00 | 1,98 | 0,25 | -20,51 | 0,1600 | -0,1412 | |||
| GILD / Gilead Sciences, Inc. | 0,00 | 19,90 | 0,25 | 18,75 | 0,2037 | 0,0027 | |||
| NOW / ServiceNow, Inc. | 0,00 | 0,24 | 0,1548 | 0,1548 | |||||
| MS / Morgan Stanley | 0,00 | 0,24 | 0,1977 | 0,1977 | |||||
| VRTX / Vertex Pharmaceuticals Incorporated | 0,00 | -0,74 | 0,24 | -8,81 | 0,1536 | -0,0990 | |||
| PH / Parker-Hannifin Corporation | 0,00 | -0,29 | 0,24 | 14,98 | 0,1533 | -0,0473 | |||
| HON / Honeywell International Inc. | 0,00 | 4,83 | 0,24 | 15,05 | 0,1529 | -0,0459 | |||
| TSM / Taiwan Semiconductor Manufacturing Company Limited - Depositary Receipt (Common Stock) | 0,00 | -31,14 | 0,24 | -5,95 | 0,1527 | -0,0910 | |||
| PGR / The Progressive Corporation | 0,00 | 4,86 | 0,24 | -1,26 | 0,1944 | -0,0357 | |||
| TJX / The TJX Companies, Inc. | 0,00 | 0,53 | 0,23 | 1,74 | 0,1511 | -0,0711 | |||
| RCL / Royal Caribbean Cruises Ltd. | 0,00 | 0,23 | 0,1933 | 0,1933 | |||||
| CB / Chubb Limited | 0,00 | -1,59 | 0,23 | -5,67 | 0,1505 | -0,0884 | |||
| MRK / Merck & Co., Inc. | 0,00 | 0,55 | 0,23 | -11,45 | 0,1499 | -0,1035 | |||
| DE / Deere & Company | 0,00 | 0,23 | 0,1903 | 0,1903 | |||||
| BKNG / Booking Holdings Inc. | 0,00 | 0,23 | 0,1861 | 0,1861 | |||||
| MSI / Motorola Solutions, Inc. | 0,00 | -3,25 | 0,22 | -7,44 | 0,1448 | -0,0888 | |||
| BTI / British American Tobacco p.l.c. - Depositary Receipt (Common Stock) | 0,00 | -7,27 | 0,22 | 6,22 | 0,1430 | -0,0591 | |||
| WFC / Wells Fargo & Company | 0,00 | 0,22 | 0,1827 | 0,1827 | |||||
| MUSI / American Century ETF Trust - American Century Multisector Income ETF | 0,01 | -30,56 | 0,22 | -29,94 | 0,1419 | -0,1619 | |||
| ORLY / O'Reilly Automotive, Inc. | 0,00 | 1 438,46 | 0,22 | -3,14 | 0,1783 | -0,0373 | |||
| SO / The Southern Company | 0,00 | 4,50 | 0,22 | 4,37 | 0,1775 | -0,0216 | |||
| AMD / Advanced Micro Devices, Inc. | 0,00 | 0,22 | 0,1775 | 0,1775 | |||||
| CI / The Cigna Group | 0,00 | 0,46 | 0,21 | 0,94 | 0,1771 | -0,0282 | |||
| IWB / iShares Trust - iShares Russell 1000 ETF | 0,00 | 0,21 | 0,1366 | 0,1366 | |||||
| ADBE / Adobe Inc. | 0,00 | -34,33 | 0,21 | -33,86 | 0,1744 | -0,1338 | |||
| ADP / Automatic Data Processing, Inc. | 0,00 | 0,20 | 0,1680 | 0,1680 | |||||
| MNST / Monster Beverage Corporation | 0,00 | 0,20 | 0,1679 | 0,1679 | |||||
| DIS / The Walt Disney Company | 0,00 | 0,20 | 0,1652 | 0,1652 | |||||
| VTRS / Viatris Inc. | 0,01 | 16,06 | 0,11 | 19,15 | 0,0725 | -0,0188 | |||
| PFE / Pfizer Inc. | 0,00 | -100,00 | 0,00 | 0,0000 | |||||
| BDX / Becton, Dickinson and Company | 0,00 | -100,00 | 0,00 | 0,0000 | |||||
| F / Ford Motor Company | 0,00 | -100,00 | 0,00 | 0,0000 | |||||
| PRU / Prudential Financial, Inc. | 0,00 | -100,00 | 0,00 | 0,0000 | |||||
| NOC / Northrop Grumman Corporation | 0,00 | -100,00 | 0,00 | 0,0000 | |||||
| PSEC / Prospect Capital Corporation | 0,00 | -100,00 | 0,00 | 0,0000 | |||||
| ZTS / Zoetis Inc. | 0,00 | -100,00 | 0,00 | 0,0000 |