Statistiques de base
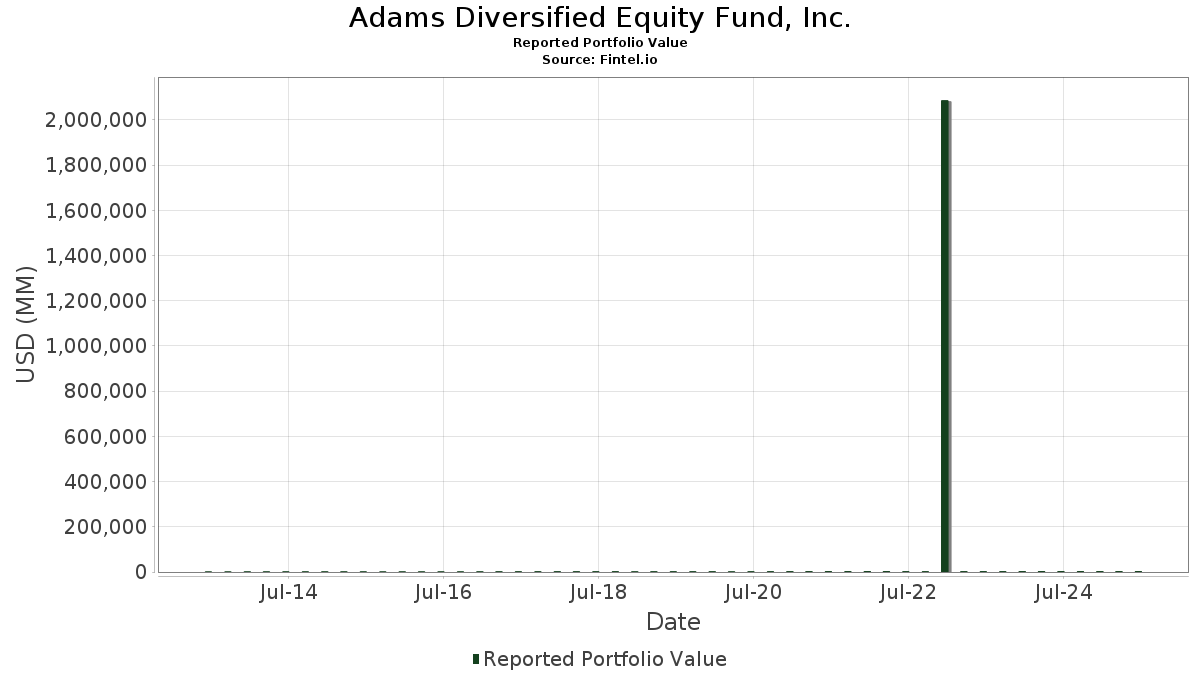
| Valeur du portefeuille | $ 2 805 764 119 |
| Positions actuelles | 100 |
Dernières positions, performances, ASG (à partir des dépôts 13F, 13D)
Adams Diversified Equity Fund, Inc. a déclaré un total de 100 positions dans ses derniers dépôts auprès de la SEC. La valeur la plus récente du portefeuille est calculée à 2 805 764 119 USD. Les actifs sous gestion réels (ASG) sont cette valeur plus les liquidités (qui ne sont pas divulguées). Les principales positions de Adams Diversified Equity Fund, Inc. sont Microsoft Corporation (DE:MSF) , NVIDIA Corporation (US:NVDA) , Apple Inc. (US:AAPL) , Amazon.com, Inc. (US:AMZN) , and Alphabet Inc. (US:GOOGL) . Les nouvelles positions de Adams Diversified Equity Fund, Inc. incluent American Financial Group, Inc. (US:AFA) , .
Meilleures augmentations ce trimestre
Nous utilisons la variation de l'allocation du portefeuille car il s'agit de l'indicateur le plus significatif. Les changements peuvent être dus à des transactions ou à des variations de prix des actions.
| Titre | Actions (en millions) |
Valeur ($ en millions) |
% du portefeuille | ΔPortefeuille % |
|---|
Principales baisses ce trimestre
Nous utilisons la variation de l'allocation du portefeuille car il s'agit de l'indicateur le plus significatif. Les changements peuvent être dus à des transactions ou à des variations de prix des actions.
| Titre | Actions (en millions) |
Valeur ($ en millions) |
% du portefeuille | ΔPortefeuille % |
|---|---|---|---|---|
| 0,43 | 216,07 | 0,0770 | -7,6686 | |
| 1,33 | 209,81 | 0,0748 | -7,4463 | |
| 0,83 | 170,50 | 0,0608 | -6,0510 | |
| 0,52 | 114,68 | 0,0409 | -4,0699 | |
| 0,54 | 95,25 | 0,0340 | -3,3806 | |
| 0,13 | 92,63 | 0,0330 | -3,2875 | |
| 0,27 | 73,65 | 0,0263 | -2,6140 | |
| 0,24 | 69,02 | 0,0246 | -2,4495 | |
| 2,46 | 52,49 | 0,0187 | -1,8629 | |
| 0,03 | 46,63 | 0,0166 | -1,6550 |
Déclarations 13F et dépôts de fonds
Ce formulaire a été déposé le 2025-08-26 pour la période de déclaration 2025-06-30. Cliquez sur l'icône du lien pour voir l'historique complet des transactions.
Mettre à niveau pour débloquer les données premium et exporter vers Excel ![]() .
.
| Titre | Type | Prix moyen de l'action | Actions (en millions) |
ΔActions (%) |
ΔActions (%) |
Valeur ($ en millions) |
Portefeuille (%) |
ΔPortefeuille (%) |
|
|---|---|---|---|---|---|---|---|---|---|
| MSF / Microsoft Corporation | 0,43 | 0,00 | 216,07 | 0,00 | 0,0770 | -7,6686 | |||
| NVDA / NVIDIA Corporation | 1,33 | 0,00 | 209,81 | 0,00 | 0,0748 | -7,4463 | |||
| AAPL / Apple Inc. | 0,83 | 0,00 | 170,50 | 0,00 | 0,0608 | -6,0510 | |||
| AMZN / Amazon.com, Inc. | 0,52 | 0,00 | 114,68 | 0,00 | 0,0409 | -4,0699 | |||
| GOOGL / Alphabet Inc. | 0,54 | 0,00 | 95,25 | 0,00 | 0,0340 | -3,3806 | |||
| META / Meta Platforms, Inc. | 0,13 | 0,00 | 92,63 | 0,00 | 0,0330 | -3,2875 | |||
| AVGO / Broadcom Inc. | 0,27 | 0,00 | 73,65 | 0,00 | 0,0263 | -2,6140 | |||
| JPM / JPMorgan Chase & Co. | 0,24 | 0,00 | 69,02 | 0,00 | 0,0246 | -2,4495 | |||
| PEO / Adams Natural Resources Fund, Inc. | 2,46 | 0,00 | 52,49 | 0,00 | 0,0187 | -1,8629 | |||
| NFLX / Netflix, Inc. | 0,03 | 0,00 | 46,63 | 0,00 | 0,0166 | -1,6550 | |||
| BRK.B / Berkshire Hathaway Inc. | 0,10 | 0,00 | 46,36 | 0,00 | 0,0165 | -1,6455 | |||
| BAC / Bank of America Corporation | 0,93 | 0,00 | 44,05 | 0,00 | 0,0157 | -1,5633 | |||
| V / Visa Inc. | 0,12 | 0,00 | 41,49 | 0,00 | 0,0148 | -1,4726 | |||
| GE / General Electric Company | 0,16 | 0,00 | 41,36 | 0,00 | 0,0147 | -1,4680 | |||
| TSLA / Tesla, Inc. | 0,12 | 0,00 | 38,69 | 0,00 | 0,0138 | -1,3732 | |||
| IBM / International Business Machines Corporation | 0,13 | 0,00 | 38,23 | 0,00 | 0,0136 | -1,3569 | |||
| GS / The Goldman Sachs Group, Inc. | 0,05 | 0,00 | 35,25 | 0,00 | 0,0126 | -1,2509 | |||
| ABBV / AbbVie Inc. | 0,19 | 0,00 | 34,84 | 0,00 | 0,0124 | -1,2365 | |||
| WMT / Walmart Inc. | 0,35 | 0,00 | 34,54 | 0,00 | 0,0123 | -1,2259 | |||
| PM / Philip Morris International Inc. | 0,19 | 0,00 | 34,30 | 0,00 | 0,0122 | -1,2174 | |||
| COF / Capital One Financial Corporation | 0,16 | 0,00 | 33,55 | 0,00 | 0,0120 | -1,1906 | |||
| LLY / Eli Lilly and Company | 0,04 | 0,00 | 32,72 | 0,00 | 0,0117 | -1,1611 | |||
| BKNG / Booking Holdings Inc. | 0,01 | 0,00 | 32,42 | 0,00 | 0,0116 | -1,1506 | |||
| MA / Mastercard Incorporated | 0,06 | 0,00 | 31,00 | 0,00 | 0,0111 | -1,1001 | |||
| UBER / Uber Technologies, Inc. | 0,31 | 0,00 | 28,86 | 0,00 | 0,0103 | -1,0242 | |||
| LRCX / Lam Research Corporation | 0,28 | 0,00 | 27,63 | 0,00 | 0,0099 | -0,9808 | |||
| CSCO / Cisco Systems, Inc. | 0,37 | 0,00 | 26,00 | 0,00 | 0,0093 | -0,9229 | |||
| CRM / Salesforce, Inc. | 0,09 | 0,00 | 25,63 | 0,00 | 0,0091 | -0,9097 | |||
| BA / The Boeing Company | 0,12 | 0,00 | 25,27 | 0,00 | 0,0090 | -0,8968 | |||
| CME / CME Group Inc. | 0,09 | 0,00 | 24,01 | 0,00 | 0,0086 | -0,8520 | |||
| GEV / GE Vernova Inc. | 0,05 | 0,00 | 23,92 | 0,00 | 0,0085 | -0,8489 | |||
| DE / Deere & Company | 0,05 | 0,00 | 23,39 | 0,00 | 0,0083 | -0,8301 | |||
| COR / Cencora, Inc. | 0,08 | 0,00 | 23,12 | 0,00 | 0,0082 | -0,8205 | |||
| TMUS / T-Mobile US, Inc. | 0,10 | 0,00 | 23,09 | 0,00 | 0,0082 | -0,8194 | |||
| BSX / Boston Scientific Corporation | 0,21 | 0,00 | 22,95 | 0,00 | 0,0082 | -0,8146 | |||
| ORLY / O'Reilly Automotive, Inc. | 0,25 | 0,00 | 22,31 | 0,00 | 0,0080 | -0,7917 | |||
| PANW / Palo Alto Networks, Inc. | 0,11 | 0,00 | 22,06 | 0,00 | 0,0079 | -0,7829 | |||
| ANET / Arista Networks Inc | 0,21 | 0,00 | 21,86 | 0,00 | 0,0078 | -0,7758 | |||
| MMM / 3M Company | 0,14 | 0,00 | 21,01 | 0,00 | 0,0075 | -0,7456 | |||
| CARR / Carrier Global Corporation | 0,28 | 0,00 | 20,29 | 0,00 | 0,0072 | -0,7200 | |||
| PGR / The Progressive Corporation | 0,08 | 0,00 | 20,17 | 0,00 | 0,0072 | -0,7160 | |||
| AMT / American Tower Corporation | 0,09 | 0,00 | 20,16 | 0,00 | 0,0072 | -0,7154 | |||
| MCD / McDonald's Corporation | 0,07 | 0,00 | 19,14 | 0,00 | 0,0068 | -0,6792 | |||
| CVX / Chevron Corporation | 0,13 | 0,00 | 19,12 | 0,00 | 0,0068 | -0,6784 | |||
| ADI / Analog Devices, Inc. | 0,08 | 0,00 | 18,80 | 0,00 | 0,0067 | -0,6674 | |||
| ETR / Entergy Corporation | 0,22 | 0,00 | 18,24 | 0,00 | 0,0065 | -0,6475 | |||
| AMD / Advanced Micro Devices, Inc. | 0,13 | 0,00 | 18,16 | 0,00 | 0,0065 | -0,6446 | |||
| XLV / The Select Sector SPDR Trust - The Health Care Select Sector SPDR Fund | 0,13 | 0,00 | 18,06 | 0,00 | 0,0064 | -0,6410 | |||
| AIG / American International Group, Inc. | 0,21 | 0,00 | 17,93 | 0,00 | 0,0064 | -0,6364 | |||
| DUK / Duke Energy Corporation | 0,15 | 0,00 | 17,70 | 0,00 | 0,0063 | -0,6282 | |||
| RSG / Republic Services, Inc. | 0,07 | 0,00 | 16,89 | 0,00 | 0,0060 | -0,5995 | |||
| MDT / Medtronic plc | 0,19 | 0,00 | 16,82 | 0,00 | 0,0060 | -0,5968 | |||
| TMO / Thermo Fisher Scientific Inc. | 0,04 | 0,00 | 16,34 | 0,00 | 0,0058 | -0,5799 | |||
| PH / Parker-Hannifin Corporation | 0,02 | 0,00 | 15,86 | 0,00 | 0,0057 | -0,5627 | |||
| UNH / UnitedHealth Group Incorporated | 0,05 | 0,00 | 15,85 | 0,00 | 0,0056 | -0,5625 | |||
| KVUE / Kenvue Inc. | 0,75 | 0,00 | 15,75 | 0,00 | 0,0056 | -0,5590 | |||
| JNJ / Johnson & Johnson | 0,10 | 0,00 | 15,70 | 0,00 | 0,0056 | -0,5573 | |||
| VRTX / Vertex Pharmaceuticals Incorporated | 0,04 | 0,00 | 15,63 | 0,00 | 0,0056 | -0,5546 | |||
| ECL / Ecolab Inc. | 0,06 | 0,00 | 15,47 | 0,00 | 0,0055 | -0,5489 | |||
| RTX / RTX Corporation | 0,10 | 0,00 | 15,11 | 0,00 | 0,0054 | -0,5364 | |||
| SYY / Sysco Corporation | 0,20 | 0,00 | 14,90 | 0,00 | 0,0053 | -0,5287 | |||
| SHW / The Sherwin-Williams Company | 0,04 | 0,00 | 14,52 | 0,00 | 0,0052 | -0,5155 | |||
| US61747C7157 / Morgan Stanley Institutional Liquidity Funds - Prime Portfolio | 14,50 | -18,54 | 14,50 | -18,55 | 0,0052 | -0,6984 | |||
| HD / The Home Depot, Inc. | 0,04 | 0,00 | 13,90 | 0,00 | 0,0050 | -0,4932 | |||
| TT / Trane Technologies plc | 0,03 | 0,00 | 13,82 | 0,00 | 0,0049 | -0,4906 | |||
| CBRE / CBRE Group, Inc. | 0,10 | 0,00 | 13,76 | 0,00 | 0,0049 | -0,4883 | |||
| VICI / VICI Properties Inc. | 0,42 | 0,00 | 13,74 | 0,00 | 0,0049 | -0,4878 | |||
| ES / Eversource Energy | 0,21 | 0,00 | 13,68 | 0,00 | 0,0049 | -0,4855 | |||
| COST / Costco Wholesale Corporation | 0,01 | 0,00 | 13,56 | 0,00 | 0,0048 | -0,4813 | |||
| CI / The Cigna Group | 0,04 | 0,00 | 13,29 | 0,00 | 0,0047 | -0,4716 | |||
| APO / Apollo Global Management, Inc. | 0,09 | 0,00 | 13,09 | 0,00 | 0,0047 | -0,4647 | |||
| PODD / Insulet Corporation | 0,04 | 0,00 | 12,79 | 0,00 | 0,0046 | -0,4538 | |||
| TEAM / Atlassian Corporation | 0,06 | 0,00 | 12,69 | 0,00 | 0,0045 | -0,4505 | |||
| POST / Post Holdings, Inc. | 0,12 | 0,00 | 12,69 | 0,00 | 0,0045 | -0,4504 | |||
| ADSK / Autodesk, Inc. | 0,04 | 0,00 | 12,60 | 0,00 | 0,0045 | -0,4472 | |||
| BKR / Baker Hughes Company | 0,31 | 0,00 | 11,86 | 0,00 | 0,0042 | -0,4210 | |||
| AVB / AvalonBay Communities, Inc. | 0,06 | 0,00 | 11,72 | 0,00 | 0,0042 | -0,4160 | |||
| DPZ / Domino's Pizza, Inc. | 0,03 | 0,00 | 11,67 | 0,00 | 0,0042 | -0,4142 | |||
| FI / Fiserv, Inc. | 0,07 | 0,00 | 11,43 | 0,00 | 0,0041 | -0,4057 | |||
| SKX / Skechers U.S.A., Inc. | 0,18 | 0,00 | 11,43 | 0,00 | 0,0041 | -0,4056 | |||
| PG / The Procter & Gamble Company | 0,07 | 0,00 | 11,19 | 0,00 | 0,0040 | -0,3972 | |||
| CCK / Crown Holdings, Inc. | 0,10 | 0,00 | 10,78 | 0,00 | 0,0038 | -0,3827 | |||
| ORCL / Oracle Corporation | 0,05 | 0,00 | 10,67 | 0,00 | 0,0038 | -0,3787 | |||
| REGN / Regeneron Pharmaceuticals, Inc. | 0,02 | 0,00 | 10,34 | 0,00 | 0,0037 | -0,3671 | |||
| KO / The Coca-Cola Company | 0,14 | 0,00 | 10,19 | 0,00 | 0,0036 | -0,3616 | |||
| TKO / TKO Group Holdings, Inc. | 0,05 | 0,00 | 9,88 | 0,00 | 0,0035 | -0,3506 | |||
| PAYC / Paycom Software, Inc. | 0,04 | 0,00 | 9,60 | 0,00 | 0,0034 | -0,3408 | |||
| CEG / Constellation Energy Corporation | 0,03 | 0,00 | 9,46 | 0,00 | 0,0034 | -0,3356 | |||
| DGX / Quest Diagnostics Incorporated | 0,05 | 0,00 | 9,36 | 0,00 | 0,0033 | -0,3321 | |||
| FCX / Freeport-McMoRan Inc. | 0,19 | 0,00 | 8,12 | 0,00 | 0,0029 | -0,2880 | |||
| CL / Colgate-Palmolive Company | 0,09 | 0,00 | 8,11 | 0,00 | 0,0029 | -0,2878 | |||
| ACN / Accenture plc | 0,02 | 0,00 | 7,36 | 0,00 | 0,0026 | -0,2612 | |||
| VST / Vistra Corp. | 0,04 | 0,00 | 7,25 | 0,00 | 0,0026 | -0,2573 | |||
| SPOT / Spotify Technology S.A. | 0,01 | 0,00 | 6,98 | 0,00 | 0,0025 | -0,2478 | |||
| XLY / The Select Sector SPDR Trust - The Consumer Discretionary Select Sector SPDR Fund | 0,03 | 0,00 | 6,89 | 0,00 | 0,0025 | -0,2445 | |||
| HES / Hess Corporation | 0,05 | 0,00 | 6,80 | 0,00 | 0,0024 | -0,2414 | |||
| PEP / PepsiCo, Inc. | 0,05 | 0,00 | 6,31 | 0,00 | 0,0022 | -0,2240 | |||
| PLTR / Palantir Technologies Inc. | 0,04 | 0,00 | 5,36 | 0,00 | 0,0019 | -0,1901 | |||
| NITXX / Northern Institutional Funds - Northern Institutional Treasury Portfolio | 1,18 | 137,02 | 1,18 | 137,22 | 0,0004 | -0,0193 | |||
| AFA / American Financial Group, Inc. | 0,47 | 0,00 | 0,0002 | -0,0182 |