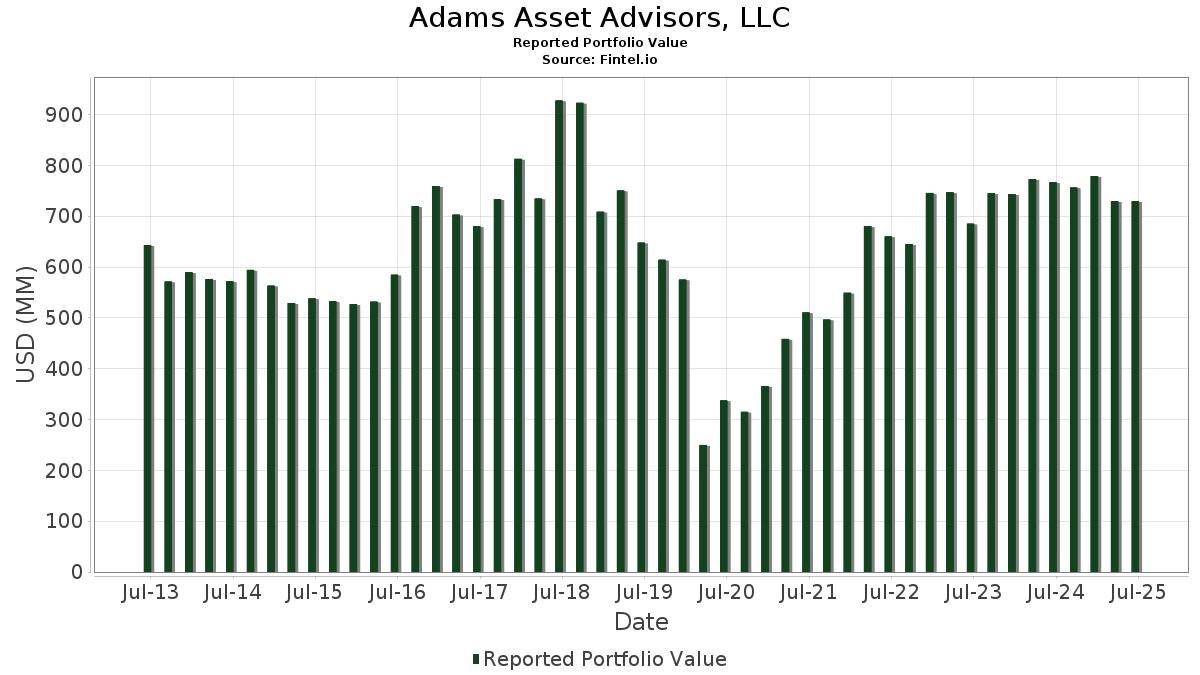
Statistiques de base
| Valeur du portefeuille | $ 710 732 017 |
| Positions actuelles | 80 |
Dernières positions, performances, ASG (à partir des dépôts 13F, 13D)
Adams Asset Advisors, LLC a déclaré un total de 80 positions dans ses derniers dépôts auprès de la SEC. La valeur la plus récente du portefeuille est calculée à 710 732 017 USD. Les actifs sous gestion réels (ASG) sont cette valeur plus les liquidités (qui ne sont pas divulguées). Les principales positions de Adams Asset Advisors, LLC sont Occidental Petroleum Corporation (US:OXY) , Calumet, Inc. (US:CLMT) , Sunoco LP - Limited Partnership (US:SUN) , Energy Transfer LP - Limited Partnership (US:ET) , and Apple Inc. (US:AAPL) . Les nouvelles positions de Adams Asset Advisors, LLC incluent Schwab Strategic Trust - Schwab U.S. Dividend Equity ETF (US:SCHD) , Schwab Strategic Trust - Schwab U.S. Large-Cap Growth ETF (US:SCHG) , VanEck ETF Trust - VanEck BDC Income ETF (US:BIZD) , Global X Funds - Global X U.S. Preferred ETF (US:PFFD) , and . Les principales industries de Adams Asset Advisors, LLC sont "Printing, Publishing, And Allied Industries" (sic 27) , "Primary Metal Industries" (sic 33) , and "Miscellaneous Retail " (sic 59) .
Meilleures augmentations ce trimestre
Nous utilisons la variation de l'allocation du portefeuille car il s'agit de l'indicateur le plus significatif. Les changements peuvent être dus à des transactions ou à des variations de prix des actions.
| Titre | Actions (en millions) |
Valeur ($ en millions) |
% du portefeuille | ΔPortefeuille % |
|---|---|---|---|---|
| 5,41 | 85,18 | 11,9842 | 2,6738 | |
| 0,23 | 6,14 | 0,8642 | 0,8642 | |
| 0,01 | 10,59 | 1,4904 | 0,3837 | |
| 0,22 | 12,72 | 1,7891 | 0,3352 | |
| 0,05 | 1,36 | 0,1914 | 0,1914 | |
| 0,08 | 1,24 | 0,1750 | 0,1750 | |
| 0,01 | 7,08 | 0,9964 | 0,1635 | |
| 0,15 | 12,98 | 1,8256 | 0,1591 | |
| 0,24 | 10,06 | 1,4156 | 0,1561 | |
| 0,25 | 11,80 | 1,6604 | 0,1480 |
Principales baisses ce trimestre
Nous utilisons la variation de l'allocation du portefeuille car il s'agit de l'indicateur le plus significatif. Les changements peuvent être dus à des transactions ou à des variations de prix des actions.
| Titre | Actions (en millions) |
Valeur ($ en millions) |
% du portefeuille | ΔPortefeuille % |
|---|---|---|---|---|
| 3,53 | 148,41 | 20,8814 | -3,0228 | |
| 0,12 | 5,76 | 0,8107 | -0,4248 | |
| 0,47 | 9,70 | 1,3646 | -0,4117 | |
| 0,07 | 9,88 | 1,3897 | -0,3926 | |
| 0,06 | 11,77 | 1,6566 | -0,3699 | |
| 0,09 | 17,54 | 2,4672 | -0,3418 | |
| 0,04 | 10,10 | 1,4214 | -0,2785 | |
| 0,24 | 13,97 | 1,9662 | -0,2755 | |
| 0,30 | 7,69 | 1,0821 | -0,2724 | |
| 0,19 | 3,96 | 0,5577 | -0,2400 |
Déclarations 13D/G
Il s'agit d'une liste des déclarations 13D et 13G déposées au cours de la dernière année (le cas échéant). Cliquez sur l'icône du lien pour voir l'historique complet des transactions. Les lignes vertes indiquent de nouvelles positions. Les lignes rouges indiquent des positions fermées.
| Date de dépôt | Formulaire | Titre | Actions précédentes |
Actions actuelles |
ΔActions % | % de participation |
% ΔParticipation | |
|---|---|---|---|---|---|---|---|---|
| 2025-02-13 | CLMT / Calumet, Inc. | 5 446 477 | 5 251 160 | -3,59 | 6,10 | -10,43 |
Déclarations 13F et dépôts de fonds
Ce formulaire a été déposé le 2025-07-08 pour la période de déclaration 2025-06-30. Cliquez sur l'icône du lien pour voir l'historique complet des transactions.
Mettre à niveau pour débloquer les données premium et exporter vers Excel ![]() .
.
| Titre | Type | Prix moyen de l'action | Actions (en millions) |
ΔActions (%) |
ΔActions (%) |
Valeur ($ en millions) |
Portefeuille (%) |
ΔPortefeuille (%) |
|
|---|---|---|---|---|---|---|---|---|---|
| OXY / Occidental Petroleum Corporation | 3,53 | 0,00 | 148,41 | -14,89 | 20,8814 | -3,0228 | |||
| CLMT / Calumet, Inc. | 5,41 | 0,93 | 85,18 | 25,41 | 11,9842 | 2,6738 | |||
| SUN / Sunoco LP - Limited Partnership | 0,57 | 0,40 | 30,63 | -7,33 | 4,3095 | -0,2214 | |||
| ET / Energy Transfer LP - Limited Partnership | 1,42 | 0,56 | 25,81 | -1,93 | 3,6317 | 0,0238 | |||
| AAPL / Apple Inc. | 0,09 | -7,35 | 17,54 | -14,43 | 2,4672 | -0,3418 | |||
| DMLP / Dorchester Minerals, L.P. - Limited Partnership | 0,62 | 10,29 | 17,19 | 2,15 | 2,4190 | 0,1119 | |||
| BTI / British American Tobacco p.l.c. - Depositary Receipt (Common Stock) | 0,35 | -10,11 | 16,40 | 2,85 | 2,3078 | 0,1215 | |||
| PAA / Plains All American Pipeline, L.P. - Limited Partnership | 0,79 | 3,24 | 14,43 | -5,43 | 2,0310 | -0,0614 | |||
| MO / Altria Group, Inc. | 0,24 | -12,52 | 13,97 | -14,54 | 1,9662 | -0,2755 | |||
| C / Citigroup Inc. | 0,15 | -10,98 | 12,98 | 6,74 | 1,8256 | 0,1591 | |||
| WFC / Wells Fargo & Company | 0,16 | -8,19 | 12,94 | 2,46 | 1,8203 | 0,0894 | |||
| NEM / Newmont Corporation | 0,22 | -0,64 | 12,72 | 19,90 | 1,7891 | 0,3352 | |||
| WES / Western Midstream Partners, LP - Limited Partnership | 0,33 | 1,03 | 12,66 | -4,55 | 1,7811 | -0,0369 | |||
| T / AT&T Inc. | 0,44 | 1,15 | 12,65 | 3,51 | 1,7804 | 0,1046 | |||
| BAC / Bank of America Corporation | 0,25 | -5,67 | 11,80 | 6,96 | 1,6604 | 0,1480 | |||
| ABBV / AbbVie Inc. | 0,06 | -10,10 | 11,77 | -20,36 | 1,6566 | -0,3699 | |||
| CSCO / Cisco Systems, Inc. | 0,16 | -11,11 | 10,98 | -0,06 | 1,5442 | 0,0387 | |||
| MPLX / MPLX LP - Limited Partnership | 0,21 | 7,06 | 10,80 | 3,04 | 1,5190 | 0,0828 | |||
| GSCE / GS Connect S&P GSCI Enhanced Commodity Total Return ETN | 0,01 | 1,28 | 10,59 | 31,20 | 1,4904 | 0,3837 | |||
| VZ / Verizon Communications Inc. | 0,24 | -8,57 | 10,18 | -12,78 | 1,4318 | -0,1677 | |||
| AMGN / Amgen Inc. | 0,04 | -9,10 | 10,10 | -18,53 | 1,4214 | -0,2785 | |||
| DINO / HF Sinclair Corporation | 0,24 | -12,36 | 10,06 | 9,50 | 1,4156 | 0,1561 | |||
| CVX / Chevron Corporation | 0,07 | -11,24 | 9,88 | -24,04 | 1,3897 | -0,3926 | |||
| OXY.WS / Occidental Petroleum Corporation - Equity Warrant | 0,47 | 0,00 | 9,70 | -25,16 | 1,3646 | -0,4117 | |||
| CMI / Cummins Inc. | 0,03 | 2,95 | 9,68 | 7,57 | 1,3617 | 0,1283 | |||
| KMB / Kimberly-Clark Corporation | 0,07 | 2,31 | 9,17 | -7,25 | 1,2901 | -0,0652 | |||
| VLO / Valero Energy Corporation | 0,07 | -7,05 | 8,87 | -5,40 | 1,2475 | -0,0372 | |||
| ARLP / Alliance Resource Partners, L.P. - Limited Partnership | 0,33 | 1,45 | 8,75 | -2,80 | 1,2315 | -0,0028 | |||
| UVV / Universal Corporation | 0,15 | -1,12 | 8,70 | 2,75 | 1,2244 | 0,0634 | |||
| EPD / Enterprise Products Partners L.P. - Limited Partnership | 0,25 | 1,64 | 7,70 | -7,68 | 1,0831 | -0,0599 | |||
| KHC / The Kraft Heinz Company | 0,30 | -8,27 | 7,69 | -22,17 | 1,0821 | -0,2724 | |||
| PFE / Pfizer Inc. | 0,30 | -14,95 | 7,17 | -18,65 | 1,0093 | -0,1994 | |||
| MSFT / Microsoft Corporation | 0,01 | -12,04 | 7,08 | 16,54 | 0,9964 | 0,1635 | |||
| SCHD / Schwab Strategic Trust - Schwab U.S. Dividend Equity ETF | 0,23 | 6,14 | 0,8642 | 0,8642 | |||||
| HPQ / HP Inc. | 0,24 | 3,67 | 5,82 | -8,42 | 0,8184 | -0,0523 | |||
| BMY / Bristol-Myers Squibb Company | 0,12 | -15,76 | 5,76 | -36,07 | 0,8107 | -0,4248 | |||
| UPS / United Parcel Service, Inc. | 0,05 | 26,27 | 5,20 | 15,88 | 0,7311 | 0,1164 | |||
| WPC / W. P. Carey Inc. | 0,07 | 19,55 | 4,49 | 18,16 | 0,6317 | 0,1109 | |||
| KMI / Kinder Morgan, Inc. | 0,14 | -0,69 | 4,02 | 2,34 | 0,5654 | 0,0271 | |||
| CAG / Conagra Brands, Inc. | 0,19 | -11,25 | 3,96 | -31,88 | 0,5577 | -0,2400 | |||
| PEP / PepsiCo, Inc. | 0,03 | -16,62 | 3,77 | -26,57 | 0,5305 | -0,1734 | |||
| GSBD / Goldman Sachs BDC, Inc. | 0,33 | 21,29 | 3,67 | 17,36 | 0,5157 | 0,0875 | |||
| WTTR / Select Water Solutions, Inc. | 0,41 | 0,00 | 3,54 | -17,71 | 0,4974 | -0,0915 | |||
| DKL / Delek Logistics Partners, LP - Limited Partnership | 0,07 | 4,45 | 3,02 | 3,68 | 0,4248 | 0,0257 | |||
| FSK / FS KKR Capital Corp. | 0,14 | 7,55 | 2,96 | 6,52 | 0,4164 | 0,0355 | |||
| SUI / Sun Communities, Inc. | 0,02 | 0,00 | 2,82 | -1,68 | 0,3963 | 0,0036 | |||
| O / Realty Income Corporation | 0,04 | 58,74 | 2,44 | 57,70 | 0,3431 | 0,1310 | |||
| RLJ.PRA / RLJ Lodging Trust - Preferred Stock | 0,10 | 14,87 | 2,32 | 11,39 | 0,3261 | 0,0409 | |||
| WMB / The Williams Companies, Inc. | 0,03 | 0,00 | 2,19 | 5,13 | 0,3083 | 0,0225 | |||
| EBGEF / Enbridge Inc. - Preferred Stock | 0,05 | -3,52 | 2,10 | -1,36 | 0,2962 | 0,0037 | |||
| GBDC / Golub Capital BDC, Inc. | 0,14 | 71,75 | 2,02 | 66,14 | 0,2839 | 0,1175 | |||
| NNN / NNN REIT, Inc. | 0,04 | 119,04 | 1,76 | 121,94 | 0,2477 | 0,1389 | |||
| MSDL / Morgan Stanley Direct Lending Fund | 0,09 | 43,69 | 1,69 | 34,77 | 0,2384 | 0,0661 | |||
| STWD / Starwood Property Trust, Inc. | 0,08 | 0,00 | 1,68 | 1,51 | 0,2363 | 0,0095 | |||
| BXSL / Blackstone Secured Lending Fund | 0,05 | 0,00 | 1,55 | -4,97 | 0,2178 | -0,0055 | |||
| OKE / ONEOK, Inc. | 0,02 | 0,00 | 1,55 | -17,72 | 0,2175 | -0,0401 | |||
| AHH / Armada Hoffler Properties, Inc. | 0,22 | 0,00 | 1,51 | -8,52 | 0,2129 | -0,0139 | |||
| NCDL / Nuveen Churchill Direct Lending Corp. | 0,09 | 9,41 | 1,46 | 4,29 | 0,2054 | 0,0136 | |||
| OBDC / Blue Owl Capital Corporation | 0,10 | 44,39 | 1,44 | 41,32 | 0,2026 | 0,0629 | |||
| SCHG / Schwab Strategic Trust - Schwab U.S. Large-Cap Growth ETF | 0,05 | 1,36 | 0,1914 | 0,1914 | |||||
| BTU / Peabody Energy Corporation | 0,10 | 0,00 | 1,34 | -0,96 | 0,1888 | 0,0031 | |||
| MLPA / Global X Funds - Global X MLP ETF | 0,03 | 293,62 | 1,30 | 271,23 | 0,1835 | 0,1353 | |||
| PLYM / Plymouth Industrial REIT, Inc. | 0,08 | 0,00 | 1,25 | -1,50 | 0,1756 | 0,0020 | |||
| BIZD / VanEck ETF Trust - VanEck BDC Income ETF | 0,08 | 1,24 | 0,1750 | 0,1750 | |||||
| LQD / iShares Trust - iShares iBoxx $ Investment Grade Corporate Bond ETF | 0,01 | 246,24 | 1,23 | 250,00 | 0,1724 | 0,1243 | |||
| WY / Weyerhaeuser Company | 0,05 | -7,82 | 1,20 | -19,13 | 0,1684 | -0,0345 | |||
| MPW / Medical Properties Trust, Inc. | 0,27 | 0,00 | 1,17 | -28,56 | 0,1645 | -0,0597 | |||
| GOOGL / Alphabet Inc. | 0,01 | 3,06 | 1,10 | 17,47 | 0,1552 | 0,0265 | |||
| XOM / Exxon Mobil Corporation | 0,01 | 17,04 | 1,08 | 6,08 | 0,1523 | 0,0124 | |||
| PFFD / Global X Funds - Global X U.S. Preferred ETF | 0,05 | 0,94 | 0,1320 | 0,1320 | |||||
| SPG / Simon Property Group, Inc. | 0,01 | 0,00 | 0,93 | -3,23 | 0,1309 | -0,0009 | |||
| GJR / Strats Trust For Procter & Gambel Security - Preferred Security | 0,00 | 0,00 | 0,58 | -6,45 | 0,0816 | -0,0034 | |||
| TRINITY PETROLEUM TR / (896556107) | 0,01 | 0,54 | 0,0000 | ||||||
| GLP / Global Partners LP - Limited Partnership | 0,01 | 0,00 | 0,52 | -1,33 | 0,0732 | 0,0010 | |||
| PAGP / Plains GP Holdings, L.P. - Limited Partnership | 0,02 | 31,62 | 0,41 | 19,76 | 0,0572 | 0,0106 | |||
| BRK.A / Berkshire Hathaway Inc. | 0,00 | 0,00 | 0,36 | -8,84 | 0,0509 | -0,0035 | |||
| JNJ / Johnson & Johnson | 0,00 | -59,27 | 0,36 | -62,51 | 0,0504 | -0,0806 | |||
| FFIN / First Financial Bankshares, Inc. | 0,01 | 0,00 | 0,32 | 0,32 | 0,0443 | 0,0012 | |||
| NXDT / NexPoint Diversified Real Estate Trust | 0,06 | 0,00 | 0,24 | 9,30 | 0,0332 | 0,0036 | |||
| SLV / iShares Silver Trust | 0,01 | 0,00 | 0,23 | 6,02 | 0,0323 | 0,0026 |