Statistiques de base
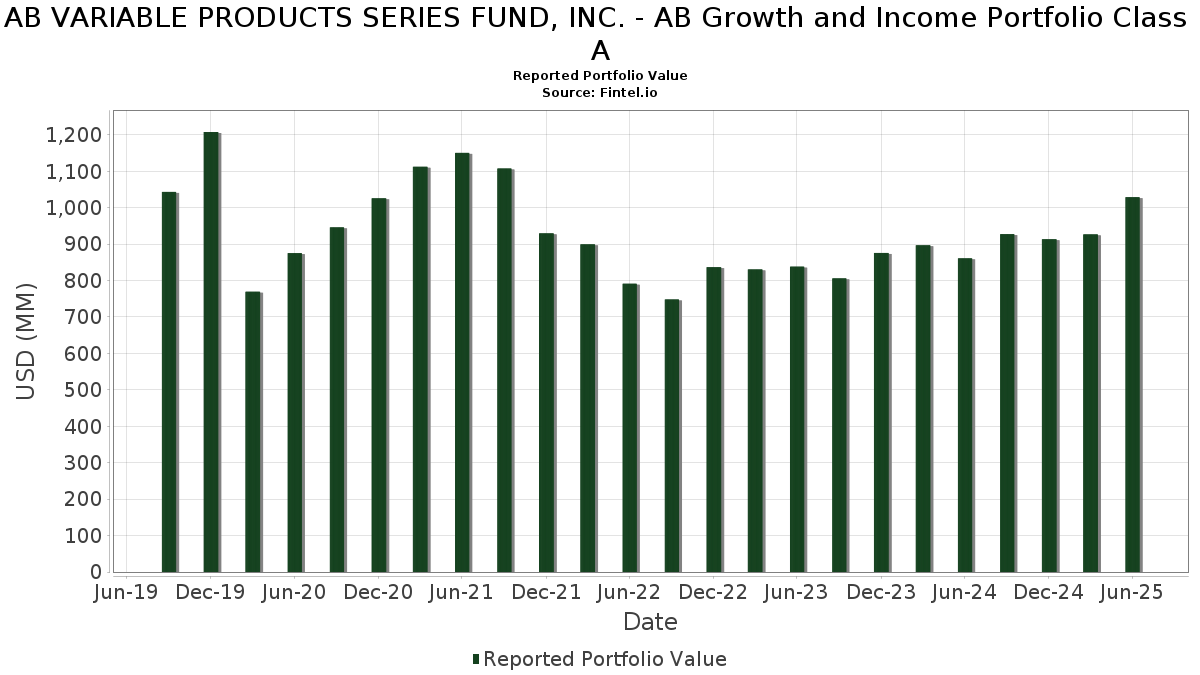
| Valeur du portefeuille | $ 1 028 771 071 |
| Positions actuelles | 74 |
Dernières positions, performances, ASG (à partir des dépôts 13F, 13D)
AB VARIABLE PRODUCTS SERIES FUND, INC. - AB Growth and Income Portfolio Class A a déclaré un total de 74 positions dans ses derniers dépôts auprès de la SEC. La valeur la plus récente du portefeuille est calculée à 1 028 771 071 USD. Les actifs sous gestion réels (ASG) sont cette valeur plus les liquidités (qui ne sont pas divulguées). Les principales positions de AB VARIABLE PRODUCTS SERIES FUND, INC. - AB Growth and Income Portfolio Class A sont JPMorgan Chase & Co. (US:JPM) , Berkshire Hathaway Inc. (US:BRK.B) , Philip Morris International Inc. (US:PM) , Johnson & Johnson (US:JNJ) , and Walmart Inc. (US:WMT) . Les nouvelles positions de AB VARIABLE PRODUCTS SERIES FUND, INC. - AB Growth and Income Portfolio Class A incluent The Walt Disney Company (US:DIS) , AT&T Inc. (US:T) , Agilent Technologies, Inc. (US:A) , Uber Technologies, Inc. (US:UBER) , and Mondelez International, Inc. (US:MDLZ) .
Meilleures augmentations ce trimestre
Nous utilisons la variation de l'allocation du portefeuille car il s'agit de l'indicateur le plus significatif. Les changements peuvent être dus à des transactions ou à des variations de prix des actions.
| Titre | Actions (en millions) |
Valeur ($ en millions) |
% du portefeuille | ΔPortefeuille % |
|---|---|---|---|---|
| 0,14 | 17,42 | 1,6565 | 1,6565 | |
| 0,43 | 12,49 | 1,1878 | 1,1878 | |
| 0,09 | 10,46 | 0,9948 | 0,9948 | |
| 0,11 | 10,13 | 0,9634 | 0,9634 | |
| 0,15 | 44,23 | 4,2051 | 0,9184 | |
| 0,11 | 7,72 | 0,7335 | 0,7335 | |
| 0,19 | 15,50 | 1,4735 | 0,6039 | |
| 0,02 | 5,36 | 0,5095 | 0,5095 | |
| 0,01 | 4,96 | 0,4718 | 0,4718 | |
| 0,13 | 26,48 | 2,5171 | 0,4436 |
Principales baisses ce trimestre
Nous utilisons la variation de l'allocation du portefeuille car il s'agit de l'indicateur le plus significatif. Les changements peuvent être dus à des transactions ou à des variations de prix des actions.
| Titre | Actions (en millions) |
Valeur ($ en millions) |
% du portefeuille | ΔPortefeuille % |
|---|---|---|---|---|
| 12,76 | 12,76 | 1,2128 | -2,1852 | |
| 0,13 | 22,47 | 2,1361 | -1,1868 | |
| 0,24 | 20,44 | 1,9432 | -1,0348 | |
| 0,22 | 39,22 | 3,7292 | -0,9337 | |
| 0,11 | 8,43 | 0,8014 | -0,8362 | |
| 0,06 | 7,62 | 0,7247 | -0,8020 | |
| 0,07 | 6,34 | 0,6032 | -0,6594 | |
| 0,18 | 19,52 | 1,8558 | -0,6431 | |
| 0,08 | 22,64 | 2,1524 | -0,6075 | |
| 0,04 | 19,94 | 1,8956 | -0,5675 |
Déclarations 13F et dépôts de fonds
Ce formulaire a été déposé le 2025-08-26 pour la période de déclaration 2025-06-30. Cliquez sur l'icône du lien pour voir l'historique complet des transactions.
Mettre à niveau pour débloquer les données premium et exporter vers Excel ![]() .
.
| Titre | Type | Prix moyen de l'action | Actions (en millions) |
ΔActions (%) |
ΔActions (%) |
Valeur ($ en millions) |
Portefeuille (%) |
ΔPortefeuille (%) |
|
|---|---|---|---|---|---|---|---|---|---|
| JPM / JPMorgan Chase & Co. | 0,15 | 22,71 | 44,23 | 45,03 | 4,2051 | 0,9184 | |||
| BRK.B / Berkshire Hathaway Inc. | 0,08 | 13,86 | 40,91 | 3,85 | 3,8891 | -0,3557 | |||
| PM / Philip Morris International Inc. | 0,22 | -20,99 | 39,22 | -9,35 | 3,7292 | -0,9337 | |||
| JNJ / Johnson & Johnson | 0,25 | 31,12 | 38,06 | 20,77 | 3,6186 | 0,2224 | |||
| WMT / Walmart Inc. | 0,34 | -0,46 | 33,31 | 10,87 | 3,1669 | -0,0709 | |||
| RTX / RTX Corporation | 0,22 | 19,20 | 32,00 | 31,40 | 3,0426 | 0,4180 | |||
| EOG / EOG Resources, Inc. | 0,22 | 31,74 | 26,64 | 22,87 | 2,5332 | 0,1963 | |||
| TXN / Texas Instruments Incorporated | 0,13 | 19,10 | 26,48 | 37,60 | 2,5171 | 0,4436 | |||
| SPGI / S&P Global Inc. | 0,05 | -5,82 | 24,84 | -2,26 | 2,3617 | -0,3772 | |||
| ELV / Elevance Health, Inc. | 0,06 | 42,90 | 23,04 | 27,79 | 2,1903 | 0,2474 | |||
| ACN / Accenture plc | 0,08 | -7,71 | 22,64 | -11,60 | 2,1524 | -0,6075 | |||
| FI / Fiserv, Inc. | 0,13 | -6,67 | 22,47 | -27,13 | 2,1361 | -1,1868 | |||
| AXV / AXIS Capital Holdings Limited | 0,21 | 10,03 | 21,51 | 13,96 | 2,0445 | 0,0110 | |||
| C / Citigroup Inc. | 0,24 | -38,32 | 20,44 | -26,04 | 1,9432 | -1,0348 | |||
| REGN / Regeneron Pharmaceuticals, Inc. | 0,04 | 5,38 | 19,94 | -12,77 | 1,8956 | -0,5675 | |||
| WFC / Wells Fargo & Company | 0,25 | 15,98 | 19,89 | 29,45 | 1,8911 | 0,2351 | |||
| GILD / Gilead Sciences, Inc. | 0,18 | -14,92 | 19,52 | -15,82 | 1,8558 | -0,6431 | |||
| DGX / Quest Diagnostics Incorporated | 0,10 | 37,09 | 17,85 | 45,54 | 1,6971 | 0,3753 | |||
| GNRC / Generac Holdings Inc. | 0,12 | 25,59 | 17,83 | 42,02 | 1,6951 | 0,3421 | |||
| DIS / The Walt Disney Company | 0,14 | 17,42 | 1,6565 | 1,6565 | |||||
| COR / Cencora, Inc. | 0,06 | -21,62 | 17,14 | -15,49 | 1,6294 | -0,5560 | |||
| VLTO / Veralto Corporation | 0,17 | 24,30 | 16,70 | 28,77 | 1,5874 | 0,1900 | |||
| TSM / Taiwan Semiconductor Manufacturing Company Limited - Depositary Receipt (Common Stock) | 0,07 | 0,77 | 15,78 | 37,49 | 1,5001 | 0,2633 | |||
| WAB / Westinghouse Air Brake Technologies Corporation | 0,07 | 15,70 | 15,53 | 33,57 | 1,4761 | 0,2234 | |||
| MET / MetLife, Inc. | 0,19 | 91,75 | 15,50 | 92,07 | 1,4735 | 0,6039 | |||
| DKS / DICK'S Sporting Goods, Inc. | 0,07 | 43,94 | 14,29 | 41,26 | 1,3589 | 0,2685 | |||
| EA / Electronic Arts Inc. | 0,09 | -9,96 | 14,12 | -0,50 | 1,3429 | -0,1869 | |||
| MA / Mastercard Incorporated | 0,03 | 50,17 | 14,09 | 53,97 | 1,3400 | 0,3534 | |||
| ULTA / Ulta Beauty, Inc. | 0,03 | -10,56 | 13,33 | 14,16 | 1,2677 | 0,0089 | |||
| CMCSA / Comcast Corporation | 0,36 | 1,12 | 12,82 | -2,20 | 1,2187 | -0,1937 | |||
| US0186167484 / AB Fixed Income Shares, Inc. - Government Money Market Portfolio | 12,76 | -59,54 | 12,76 | -59,54 | 1,2128 | -2,1852 | |||
| HCA / HCA Healthcare, Inc. | 0,03 | 29,73 | 12,61 | 43,83 | 1,1984 | 0,2540 | |||
| T / AT&T Inc. | 0,43 | 12,49 | 1,1878 | 1,1878 | |||||
| CVX / Chevron Corporation | 0,09 | -10,31 | 12,38 | -23,24 | 1,1766 | -0,5607 | |||
| CSX / CSX Corporation | 0,36 | 56,53 | 11,86 | 73,55 | 1,1273 | 0,3910 | |||
| RHHBY / Roche Holding AG - Depositary Receipt (Common Stock) | 0,29 | 7,88 | 11,74 | 6,85 | 1,1164 | -0,0678 | |||
| CASY / Casey's General Stores, Inc. | 0,02 | -22,63 | 11,67 | -9,04 | 1,1097 | -0,2732 | |||
| COP / ConocoPhillips | 0,13 | 17,69 | 11,35 | 0,56 | 1,0792 | -0,1372 | |||
| ROST / Ross Stores, Inc. | 0,08 | 11,54 | 10,57 | 11,35 | 1,0051 | -0,0180 | |||
| PSA / Public Storage | 0,04 | 38,18 | 10,47 | 35,48 | 0,9958 | 0,1626 | |||
| JBHT / J.B. Hunt Transport Services, Inc. | 0,07 | -23,50 | 10,47 | -25,75 | 0,9954 | -0,5242 | |||
| A / Agilent Technologies, Inc. | 0,09 | 10,46 | 0,9948 | 0,9948 | |||||
| UBER / Uber Technologies, Inc. | 0,11 | 10,13 | 0,9634 | 0,9634 | |||||
| OTIS / Otis Worldwide Corporation | 0,10 | 50,16 | 9,96 | 44,07 | 0,9465 | 0,2018 | |||
| PPG / PPG Industries, Inc. | 0,09 | 41,74 | 9,94 | 47,46 | 0,9452 | 0,2186 | |||
| STLD / Steel Dynamics, Inc. | 0,07 | -3,12 | 9,48 | -0,85 | 0,9011 | -0,1290 | |||
| CF / CF Industries Holdings, Inc. | 0,10 | -10,06 | 9,33 | 5,88 | 0,8872 | -0,0626 | |||
| PCAR / PACCAR Inc | 0,10 | 67,50 | 9,20 | 63,53 | 0,8749 | 0,2685 | |||
| LOW / Lowe's Companies, Inc. | 0,04 | 169,33 | 8,82 | 134,61 | 0,8385 | 0,4298 | |||
| NKE / NIKE, Inc. | 0,12 | -34,03 | 8,54 | -26,18 | 0,8117 | -0,4346 | |||
| NICE / NICE Ltd. - Depositary Receipt (Common Stock) | 0,05 | 19,37 | 8,46 | 30,79 | 0,8041 | 0,1072 | |||
| GEHC / GE HealthCare Technologies Inc. | 0,11 | -39,55 | 8,43 | -44,53 | 0,8014 | -0,8362 | |||
| MDLZ / Mondelez International, Inc. | 0,11 | 7,72 | 0,7335 | 0,7335 | |||||
| PSX / Phillips 66 | 0,06 | -44,31 | 7,62 | -46,20 | 0,7247 | -0,8020 | |||
| UTHR / United Therapeutics Corporation | 0,03 | -4,57 | 7,33 | -11,05 | 0,6964 | -0,1910 | |||
| ALLE / Allegion plc | 0,05 | 15,91 | 7,32 | 28,06 | 0,6960 | 0,0799 | |||
| MSM / MSC Industrial Direct Co., Inc. | 0,09 | 42,93 | 7,30 | 56,47 | 0,6941 | 0,1913 | |||
| BXSL / Blackstone Secured Lending Fund | 0,22 | 11,81 | 6,64 | 6,25 | 0,6315 | -0,0422 | |||
| ALSN / Allison Transmission Holdings, Inc. | 0,07 | 20,98 | 6,53 | 20,11 | 0,6207 | 0,0350 | |||
| SBUX / Starbucks Corporation | 0,07 | -42,03 | 6,34 | -45,85 | 0,6032 | -0,6594 | |||
| NVT / nVent Electric plc | 0,08 | -25,89 | 6,04 | 3,55 | 0,5739 | -0,0543 | |||
| LRCX / Lam Research Corporation | 0,06 | -42,26 | 5,48 | -22,69 | 0,5212 | -0,2430 | |||
| ZBRA / Zebra Technologies Corporation | 0,02 | 5,36 | 0,5095 | 0,5095 | |||||
| CW / Curtiss-Wright Corporation | 0,01 | -16,25 | 5,36 | 28,94 | 0,5093 | 0,0616 | |||
| MTG / MGIC Investment Corporation | 0,19 | 10,98 | 5,27 | 24,70 | 0,5012 | 0,0456 | |||
| CSCO / Cisco Systems, Inc. | 0,08 | 9,04 | 5,26 | 59,24 | 0,4997 | 0,1301 | |||
| BWA / BorgWarner Inc. | 0,15 | -5,16 | 5,16 | 10,83 | 0,4905 | -0,0112 | |||
| CSL / Carlisle Companies Incorporated | 0,01 | 4,96 | 0,4718 | 0,4718 | |||||
| FCN / FTI Consulting, Inc. | 0,03 | -10,43 | 4,29 | -11,84 | 0,4078 | -0,1165 | |||
| RMD / ResMed Inc. | 0,02 | 4,15 | 0,3947 | 0,3947 | |||||
| WHD / Cactus, Inc. | 0,08 | 100,94 | 3,61 | 91,72 | 0,3436 | 0,1404 | |||
| LULU / lululemon athletica inc. | 0,01 | -48,70 | 3,37 | -56,94 | 0,3204 | -0,5231 | |||
| LSTR / Landstar System, Inc. | 0,02 | 2,87 | 0,2728 | 0,2728 | |||||
| JLL / Jones Lang LaSalle Incorporated | 0,01 | 2,12 | 0,2018 | 0,2018 |