Statistiques de base
| Valeur du portefeuille | $ 173 710 560 |
| Positions actuelles | 102 |
Dernières positions, performances, ASG (à partir des dépôts 13F, 13D)
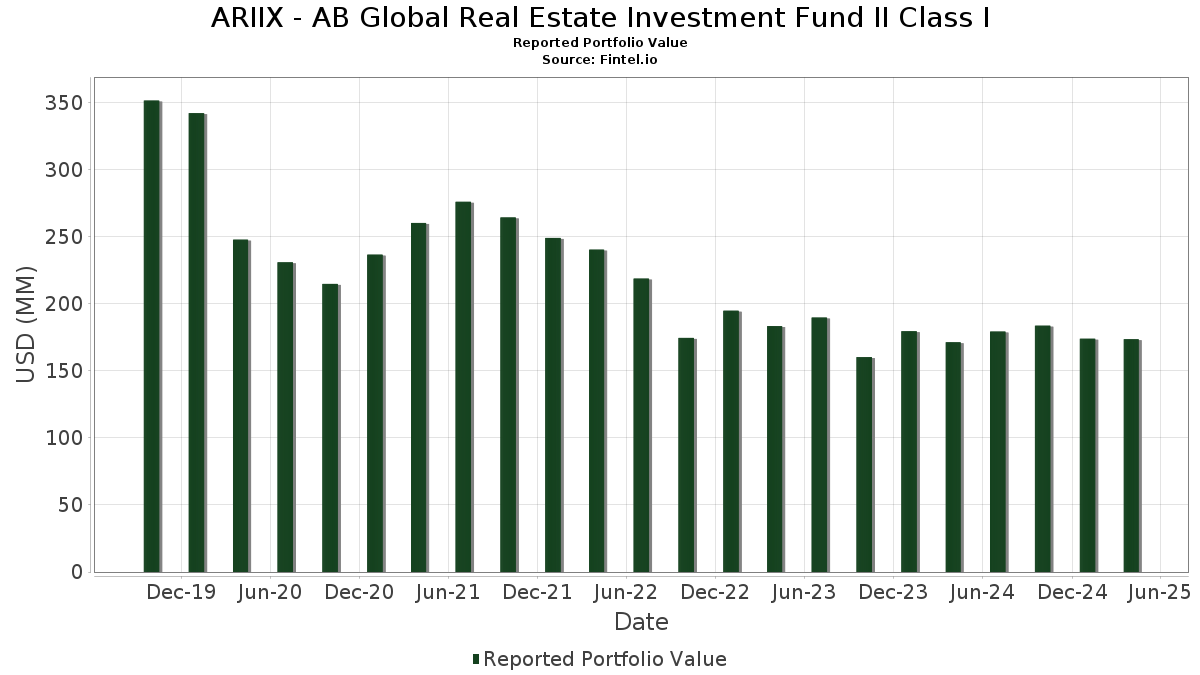
ARIIX - AB Global Real Estate Investment Fund II Class I a déclaré un total de 102 positions dans ses derniers dépôts auprès de la SEC. La valeur la plus récente du portefeuille est calculée à 173 710 560 USD. Les actifs sous gestion réels (ASG) sont cette valeur plus les liquidités (qui ne sont pas divulguées). Les principales positions de ARIIX - AB Global Real Estate Investment Fund II Class I sont Welltower Inc. (US:WELL) , Prologis, Inc. (US:PLD) , Equinix, Inc. (US:EQIX) , Digital Realty Trust, Inc. (US:DLR) , and Ventas, Inc. (US:VTR) . Les nouvelles positions de ARIIX - AB Global Real Estate Investment Fund II Class I incluent British Land Company PLC (MX:BLND N) , Kumagai Gumi Co.,Ltd. (US:KMGGF) , .
Meilleures augmentations ce trimestre
Nous utilisons la variation de l'allocation du portefeuille car il s'agit de l'indicateur le plus significatif. Les changements peuvent être dus à des transactions ou à des variations de prix des actions.
| Titre | Actions (en millions) |
Valeur ($ en millions) |
% du portefeuille | ΔPortefeuille % |
|---|---|---|---|---|
| 0,07 | 11,13 | 6,3793 | 1,0389 | |
| 0,24 | 1,24 | 0,7125 | 0,7125 | |
| 0,16 | 2,53 | 1,4508 | 0,5858 | |
| 1,31 | 2,15 | 1,2329 | 0,3963 | |
| 0,15 | 4,85 | 2,7808 | 0,3875 | |
| 0,07 | 2,53 | 1,4520 | 0,3681 | |
| 0,11 | 1,29 | 0,7369 | 0,3456 | |
| 0,07 | 2,44 | 1,3991 | 0,3174 | |
| 0,02 | 0,55 | 0,3161 | 0,3161 | |
| 0,02 | 5,42 | 3,1080 | 0,2575 |
Principales baisses ce trimestre
Nous utilisons la variation de l'allocation du portefeuille car il s'agit de l'indicateur le plus significatif. Les changements peuvent être dus à des transactions ou à des variations de prix des actions.
| Titre | Actions (en millions) |
Valeur ($ en millions) |
% du portefeuille | ΔPortefeuille % |
|---|---|---|---|---|
| 0,09 | 9,54 | 5,4688 | -1,1019 | |
| 0,04 | 6,30 | 3,6131 | -0,9613 | |
| 0,10 | 1,87 | 1,0726 | -0,7824 | |
| 0,01 | 8,14 | 4,6690 | -0,6555 | |
| 0,09 | 3,96 | 2,2712 | -0,4732 | |
| 0,04 | 0,41 | 0,2345 | -0,4645 | |
| 0,01 | 0,74 | 0,4259 | -0,4508 | |
| 0,03 | 5,46 | 3,1305 | -0,3888 | |
| 0,05 | 1,47 | 0,8429 | -0,3768 | |
| 0,07 | 2,18 | 1,2498 | -0,3219 |
Déclarations 13F et dépôts de fonds
Ce formulaire a été déposé le 2025-06-26 pour la période de déclaration 2025-04-30. Cliquez sur l'icône du lien pour voir l'historique complet des transactions.
Mettre à niveau pour débloquer les données premium et exporter vers Excel ![]() .
.
| Titre | Type | Prix moyen de l'action | Actions (en millions) |
ΔActions (%) |
ΔActions (%) |
Valeur ($ en millions) |
Portefeuille (%) |
ΔPortefeuille (%) |
|
|---|---|---|---|---|---|---|---|---|---|
| WELL / Welltower Inc. | 0,07 | 6,88 | 11,13 | 19,50 | 6,3793 | 1,0389 | |||
| PLD / Prologis, Inc. | 0,09 | -2,85 | 9,54 | -16,74 | 5,4688 | -1,1019 | |||
| EQIX / Equinix, Inc. | 0,01 | -6,89 | 8,14 | -12,28 | 4,6690 | -0,6555 | |||
| DLR / Digital Realty Trust, Inc. | 0,04 | -19,35 | 6,30 | -20,99 | 3,6131 | -0,9613 | |||
| VTR / Ventas, Inc. | 0,09 | -8,23 | 6,23 | 6,45 | 3,5695 | 0,2148 | |||
| SPG / Simon Property Group, Inc. | 0,03 | -1,70 | 5,46 | -11,02 | 3,1305 | -0,3888 | |||
| PSA / Public Storage | 0,02 | 8,36 | 5,42 | 9,08 | 3,1080 | 0,2575 | |||
| MAA / Mid-America Apartment Communities, Inc. | 0,03 | -1,49 | 5,37 | 3,07 | 3,0786 | 0,0907 | |||
| VICI / VICI Properties Inc. | 0,15 | 8,06 | 4,85 | 16,23 | 2,7808 | 0,3875 | |||
| UDR / UDR, Inc. | 0,09 | -17,49 | 3,96 | -17,20 | 2,2712 | -0,4732 | |||
| SGP / Stockland - Debt/Equity Composite Units | 1,08 | -2,33 | 3,80 | 8,35 | 2,1796 | 0,1672 | |||
| 8801 / Mitsui Fudosan Co., Ltd. | 0,37 | -2,31 | 3,65 | 7,27 | 2,0907 | 0,1410 | |||
| IRT / Independence Realty Trust, Inc. | 0,18 | 0,02 | 3,47 | 1,16 | 1,9921 | 0,0222 | |||
| BRX / Brixmor Property Group Inc. | 0,13 | -2,51 | 3,22 | -6,80 | 1,8465 | -0,1357 | |||
| O / Realty Income Corporation | 0,05 | 0,04 | 3,17 | 5,95 | 1,8168 | 0,1012 | |||
| GMG / Goodman Group - Debt/Equity Composite Units | 0,15 | -0,35 | 2,88 | -14,46 | 1,6529 | -0,2799 | |||
| EPRT / Essential Properties Realty Trust, Inc. | 0,09 | 0,02 | 2,84 | 0,25 | 1,6299 | 0,0034 | |||
| AHR / American Healthcare REIT, Inc. | 0,09 | 0,27 | 2,83 | 14,42 | 1,6201 | 0,2037 | |||
| EXR / Extra Space Storage Inc. | 0,02 | 0,00 | 2,82 | -4,83 | 1,6147 | -0,0830 | |||
| PSPN / PSP Swiss Property AG | 0,01 | -2,96 | 2,62 | 16,95 | 1,5040 | 0,2178 | |||
| INVH / Invitation Homes Inc. | 0,07 | 22,10 | 2,53 | 34,04 | 1,4520 | 0,3681 | |||
| NTST / NETSTREIT Corp. | 0,16 | 49,33 | 2,53 | 67,88 | 1,4508 | 0,5858 | |||
| CDP / COPT Defense Properties | 0,10 | -3,27 | 2,52 | -14,22 | 1,4425 | -0,2396 | |||
| IRM / Iron Mountain Incorporated | 0,03 | 24,05 | 2,51 | 9,52 | 1,4389 | 0,1246 | |||
| VONOY / Vonovia SE - Depositary Receipt (Common Stock) | 0,07 | 19,34 | 2,44 | 29,44 | 1,3991 | 0,3174 | |||
| SURDF / Sumitomo Realty & Development Co., Ltd. | 0,06 | 0,00 | 2,25 | 7,78 | 1,2878 | 0,0927 | |||
| REXR / Rexford Industrial Realty, Inc. | 0,07 | -2,29 | 2,18 | -20,47 | 1,2498 | -0,3219 | |||
| C38U / CapitaLand Integrated Commercial Trust | 1,31 | 27,87 | 2,15 | 47,46 | 1,2329 | 0,3963 | |||
| SCG / Scentre Group | 0,90 | 21,99 | 2,07 | 24,88 | 1,1891 | 0,2366 | |||
| RHP / Ryman Hospitality Properties, Inc. | 0,02 | -4,03 | 2,07 | -19,50 | 1,1886 | -0,2883 | |||
| S3Z / CapitaLand Ascendas REIT | 0,98 | 0,00 | 1,99 | 7,45 | 1,1414 | 0,0791 | |||
| 16 / Sun Hung Kai Properties Limited | 0,20 | 0,00 | 1,94 | 6,11 | 1,1151 | 0,0640 | |||
| AKR / Acadia Realty Trust | 0,10 | -30,23 | 1,87 | -42,18 | 1,0726 | -0,7824 | |||
| 8976 / Daiwa Office Investment Corporation | 0,00 | 0,00 | 1,83 | 12,93 | 1,0467 | 0,1196 | |||
| CSH.UN / Chartwell Retirement Residences | 0,14 | -4,92 | 1,72 | 8,10 | 0,9871 | 0,0737 | |||
| UMH / UMH Properties, Inc. | 0,10 | 0,00 | 1,71 | -1,78 | 0,9793 | -0,0181 | |||
| MITEF / Mitsubishi Estate Co., Ltd. | 0,08 | 10,71 | 1,47 | 33,88 | 0,8430 | 0,2129 | |||
| CUZ / Cousins Properties Incorporated | 0,05 | -48,32 | 1,47 | -34,72 | 0,8429 | -0,3768 | |||
| SUI / Sun Communities, Inc. | 0,01 | -24,57 | 1,29 | -25,79 | 0,7394 | -0,2574 | |||
| TEX / Castellum AB (publ) | 0,11 | 67,86 | 1,29 | 88,42 | 0,7369 | 0,3456 | |||
| S4C / Nippon Building Fund Inc. | 0,00 | 0,00 | 1,27 | 16,59 | 0,7297 | 0,1035 | |||
| UTGPF / Unite Group PLC | 0,11 | 13,66 | 1,26 | 23,29 | 0,7226 | 0,1363 | |||
| GLPJF / GLP J-REIT | 0,00 | 0,00 | 1,25 | 5,32 | 0,7162 | 0,0361 | |||
| BLND N / British Land Company PLC | 0,24 | 1,24 | 0,7125 | 0,7125 | |||||
| KTITF / KATITAS CO., Ltd. | 0,08 | -16,92 | 1,21 | -13,95 | 0,6937 | -0,1122 | |||
| 1972 / Swire Properties Limited | 0,54 | -9,33 | 1,19 | 1,46 | 0,6797 | 0,0096 | |||
| LKREF / Link Real Estate Investment Trust | 0,24 | -9,82 | 1,11 | 2,22 | 0,6336 | 0,0134 | |||
| LMP / Lee & Man Paper Manufacturing Limited | 0,43 | -16,60 | 1,09 | -12,34 | 0,6275 | -0,1122 | |||
| STAG / STAG Industrial, Inc. | 0,03 | 0,00 | 1,08 | -3,40 | 0,6203 | -0,0218 | |||
| 4ZQ / Tritax Big Box REIT plc | 0,57 | 15,17 | 1,08 | 21,60 | 0,6201 | 0,1100 | |||
| URW / Unibail-Rodamco-Westfield SE | 0,01 | -30,25 | 1,08 | -29,52 | 0,6179 | -0,2585 | |||
| LEG / LEG Immobilien SE | 0,01 | 0,00 | 1,04 | 2,86 | 0,5983 | 0,0165 | |||
| KMP.UN / Killam Apartment REIT | 0,08 | 0,00 | 1,04 | 11,11 | 0,5967 | 0,0594 | |||
| 8UT / Japan Logistics Fund, Inc. | 0,00 | 0,00 | 1,02 | 12,99 | 0,5838 | 0,0667 | |||
| GPT / The GPT Group - Debt/Equity Composite Units | 0,33 | 21,89 | 0,97 | 27,30 | 0,5564 | 0,1191 | |||
| CHC / Charter Hall Group - Debt/Equity Composite Units | 0,09 | 0,00 | 0,97 | 12,47 | 0,5537 | 0,0611 | |||
| CATE / Catena AB (publ) | 0,02 | 24,94 | 0,95 | 35,00 | 0,5423 | 0,1405 | |||
| AED / Grupo Aeroportuario del Sureste, S. A. B. de C. V. | 0,01 | -10,31 | 0,91 | 19,37 | 0,5199 | 0,0841 | |||
| HMSO / Hammerson Plc | 0,26 | 0,00 | 0,87 | -4,62 | 0,4979 | -0,0241 | |||
| 3282 / Comforia Residential REIT, Inc | 0,00 | 0,00 | 0,86 | 11,24 | 0,4938 | 0,0494 | |||
| MRL / Marlowe plc | 0,08 | 0,00 | 0,85 | -1,61 | 0,4898 | -0,0081 | |||
| J69U / Frasers Centrepoint Trust | 0,49 | 5,40 | 0,85 | 16,35 | 0,4862 | 0,0681 | |||
| BNL / Broadstone Net Lease, Inc. | 0,05 | 29,66 | 0,84 | -21,05 | 0,4840 | 0,0722 | |||
| PECO / Phillips Edison & Company, Inc. | 0,02 | 59,08 | 0,80 | 57,48 | 0,4590 | 0,1762 | |||
| LI / Klépierre SA | 0,02 | 0,00 | 0,77 | 22,92 | 0,4401 | 0,0820 | |||
| GFC / Gecina | 0,01 | -50,75 | 0,74 | -64,45 | 0,4259 | -0,4508 | |||
| TEG / TAG Immobilien AG | 0,05 | -8,52 | 0,74 | 0,14 | 0,4219 | 0,0008 | |||
| LINE / Lineage, Inc. | 0,01 | -9,26 | 0,70 | -27,04 | 0,4010 | -0,1490 | |||
| NIPOF / Japan Hotel REIT Investment Corporation | 0,00 | 74,72 | 0,68 | 87,64 | 0,3919 | 0,1941 | |||
| SRI / Supermarket Income REIT plc | 0,59 | 0,00 | 0,61 | 23,64 | 0,3513 | 0,0669 | |||
| UUICF / United Urban Investment Corporation | 0,00 | 0,00 | 0,59 | 8,59 | 0,3409 | 0,0271 | |||
| 9CI / CapitaLand Investment Limited | 0,26 | -14,48 | 0,55 | 0,18 | 0,3163 | 0,0003 | |||
| KMGGF / Kumagai Gumi Co.,Ltd. | 0,02 | 0,55 | 0,3161 | 0,3161 | |||||
| 28F0 / Fastighets AB Balder (publ) | 0,07 | -45,26 | 0,53 | -44,71 | 0,3057 | -0,2473 | |||
| SGRO / SEGRO Plc | 0,06 | -35,34 | 0,53 | -33,50 | 0,3030 | -0,1526 | |||
| AZRG / Azrieli Group Ltd | 0,01 | -14,51 | 0,52 | -24,86 | 0,3002 | -0,0995 | |||
| VGP / VGP NV | 0,01 | 0,00 | 0,51 | 8,26 | 0,2934 | 0,0227 | |||
| SHUR / Shurgard Self Storage SA | 0,01 | 0,00 | 0,46 | 12,11 | 0,2659 | 0,0286 | |||
| INW / Infrastrutture Wireless Italiane S.p.A. | 0,04 | -36,26 | 0,42 | -26,75 | 0,2404 | -0,0880 | |||
| XHR / Xenia Hotels & Resorts, Inc. | 0,04 | -52,99 | 0,41 | -66,42 | 0,2345 | -0,4645 | |||
| NMEHF / Nomura Real Estate Holdings, Inc. | 0,07 | 400,00 | 0,41 | 11,81 | 0,2336 | 0,0247 | |||
| US0186167484 / AB Fixed Income Shares, Inc. - Government Money Market Portfolio | 0,40 | 31,24 | 0,40 | 31,13 | 0,2276 | 0,0541 | |||
| K9R / KDX Realty Investment Corporation | 0,00 | 0,00 | 0,39 | 4,34 | 0,2209 | 0,0090 | |||
| DIR.UN / Dream Industrial Real Estate Investment Trust | 0,05 | -53,89 | 0,37 | -55,87 | 0,2133 | -0,2703 | |||
| PNDXB / Pandox AB | 0,02 | -52,95 | 0,29 | -57,04 | 0,1665 | -0,2211 | |||
| CTPNV / CTP N.V. | 0,01 | -52,42 | 0,27 | -46,27 | 0,1572 | -0,1356 | |||
| PURCHASED AUD / SOLD USD / DFE (000000000) | 0,01 | 0,0085 | 0,0085 | ||||||
| PURCHASED EUR / SOLD USD / DFE (000000000) | 0,01 | 0,0070 | 0,0070 | ||||||
| PURCHASED GBP / SOLD USD / DFE (000000000) | 0,01 | 0,0064 | 0,0064 | ||||||
| PURCHASED GBP / SOLD USD / DFE (000000000) | 0,01 | 0,0060 | 0,0060 | ||||||
| PURCHASED EUR / SOLD USD / DFE (000000000) | 0,01 | 0,0036 | 0,0036 | ||||||
| PURCHASED CHF / SOLD USD / DFE (000000000) | 0,00 | 0,0010 | 0,0010 | ||||||
| PURCHASED CAD / SOLD USD / DFE (000000000) | 0,00 | 0,0009 | 0,0009 | ||||||
| PURCHASED USD / SOLD AUD / DFE (000000000) | 0,00 | 0,0000 | 0,0000 | ||||||
| PURCHASED SEK / SOLD USD / DFE (000000000) | 0,00 | 0,0000 | 0,0000 | ||||||
| PURCHASED GBP / SOLD USD / DFE (000000000) | -0,00 | -0,0004 | -0,0004 | ||||||
| US06747W8495 / Barclays Bank plc into Metlife, Inc. | -0,00 | -0,0015 | -0,0015 | ||||||
| PURCHASED USD / SOLD CAD / DFE (000000000) | -0,01 | -0,0058 | -0,0058 | ||||||
| PURCHASED USD / SOLD GBP / DFE (000000000) | -0,01 | -0,0069 | -0,0069 | ||||||
| PURCHASED USD / SOLD GBP / DFE (000000000) | -0,02 | -0,0110 | -0,0110 | ||||||
| PURCHASED USD / SOLD CHF / DFE (000000000) | -0,03 | -0,0172 | -0,0172 | ||||||
| PURCHASED USD / SOLD EUR / DFE (000000000) | -0,07 | -0,0414 | -0,0414 |